Taiwan Data Center Market Size and Share
Market Overview
| Study Period | 2019 - 2030 |
|---|---|
| Base Year For Estimation | 2024 |
| Forecast Data Period | 2025 - 2030 |
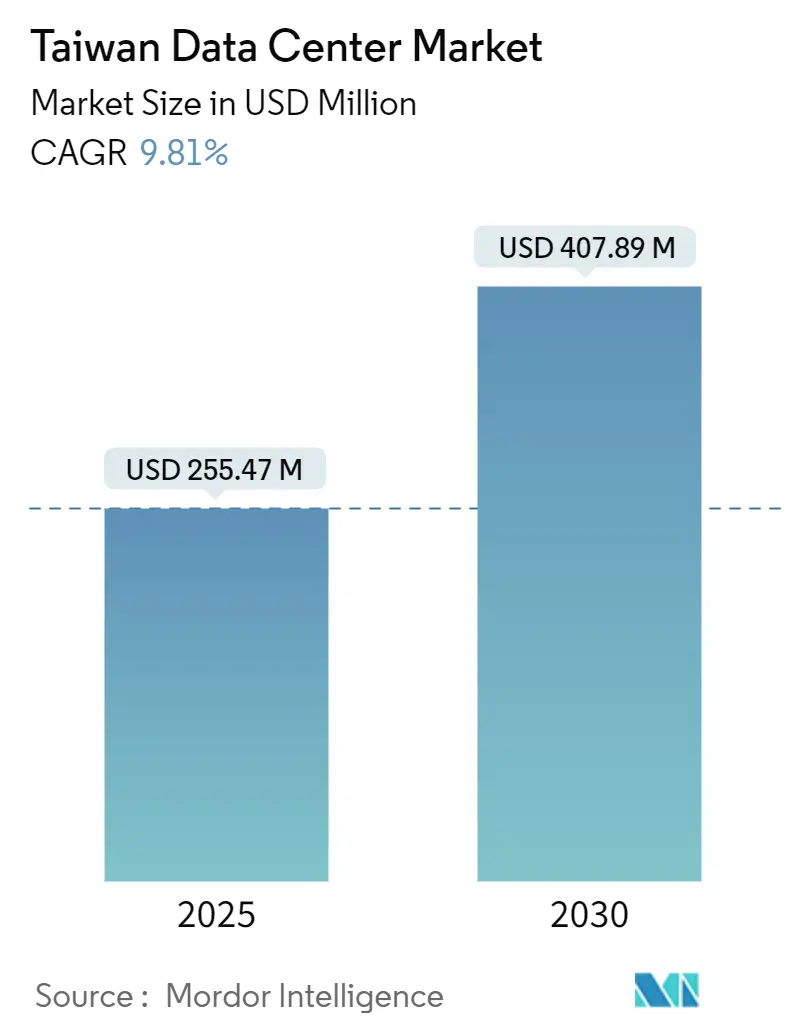
| Market Size (2025) | USD 255.47 Million |
| Market Size (2030) | USD 407.89 Million |
| Growth Rate (2025 - 2030) | 9.81% CAGR |
| Market Concentration | Medium |
Major Players
*Disclaimer: Major Players sorted in no particular order Image © Mordor Intelligence. Reuse requires attribution under CC BY 4.0. |
|
Taiwan Data Center Market Analysis by Mordor Intelligence
The Taiwan data center market size is projected to reach USD 407.89 million by 2030, advancing at a 9.81% CAGR from USD 255.47 million in 2025. In terms of IT load capacity, the market is expected to grow from 280.90 MW in 2025 to 430.90 MW by 2030, at a CAGR of 8.94% during the forecast period (2025-2030). The market segment shares and estimates are calculated and reported in terms of MW. Semiconductor manufacturing, hyperscale self-build projects, and increasing artificial-intelligence workloads position Taiwan as a critical node for Asia-Pacific connectivity. Large facilities account for the majority of capacity as enterprises consolidate their infrastructure, while medium-sized sites are gaining traction in edge-computing use cases. Colocation demand remains healthy, yet cloud majors increasingly favor sovereign campuses to secure power, land, and regulatory control. Taipei dominates due to its high fiber density and submarine cable landings, although power approval bottlenecks spur growth in Taoyuan. Heightened competition, escalating construction costs tied to seismic hardening, and a skilled-labor deficit shape the strategic outlook.
Key Report Takeaways
- By data center size, large data centers led with 58.03% of the Taiwan data center market share in 2024, whereas medium facilities are forecast to expand at a 10.00% CAGR to 2030.
- By tier type, Tier 3 sites captured 57.00% of the Taiwan data center market size in 2024; Tier 4 infrastructure is projected to record the highest CAGR at 11.2% through 2030.
- By data center type, colocation accounted for 45.00% of 2024 revenue, while hyperscale self-build facilities are projected to grow at a 9.20% CAGR to 2030.
- By end user, IT and telecommunications held 48.01% of the demand in 2024, while banking, financial services, and insurance are growing at the fastest rate, with a 10.92% CAGR.
- By hotspot, Taipei retained 61.52% capacity share in 2024; Taoyuan is advancing at a 10.55% CAGR to become the primary expansion corridor.
Taiwan Data Center Market Trends and Insights
Drivers Impact Analysis
| Driver | (~) % Impact on CAGR Forecast | Geographic Relevance | Impact Timeline |
|---|---|---|---|
| Surging hyperscale self-build projects by U.S. cloud majors | +2.1% | National, concentrated in Taipei and Taoyuan | Medium term (2-4 years) |
| Government green-energy subsidy program for data-center PUE optimisation | +1.8% | National, with early gains in the Taoyuan industrial zones | Long term (≥ 4 years) |
| Rapid 5G roll-out driving edge micro-site demand | +1.5% | Urban centers, expanding to secondary cities | Short term (≤ 2 years) |
| Semiconductor industry big data workloads (EUV lithography analytics) | +2.3% | Northern Taiwan, concentrated around TSMC facilities | Medium term (2-4 years) |
| Rising submarine-cable landings are elevating Taiwan's regional inter-connectivity | +1.2% | Coastal regions, particularly Toucheng and Tamsui | Long term (≥ 4 years) |
| Colocation demand from AI model-training start-ups | +1.7% | Taipei and New Taipei technology corridors | Short term (≤ 2 years) |
| Source: Mordor Intelligence | |||
Surging Hyperscale Self-Build Projects by United States Cloud Majors
Direct investment by Amazon, Google, and Microsoft is fundamentally redrawing competitive boundaries. In June 2025, Amazon pledged more than USD 5 billion to create a multi-zone AWS region, the country’s single largest digital infrastructure outlay. These projects bundle land acquisition, renewable-energy sourcing, and standardized design, locking in long-horizon commitments despite cross-strait geopolitical noise. Cloud majors’ preference for proprietary campuses limits retail colocation growth but stimulates local supply-chain innovation in power systems, modular cooling, and automated operations.
Semiconductor-Industry Big-Data Workloads (EUV Lithography Analytics)
TSMC’s sub-5 nm production generates petabyte-scale telemetry that must be processed in real-time near fabs. Each EUV scanner requires dedicated compute nodes for defect mapping and pattern recognition, pushing rack densities beyond 30 kW and favoring the adoption of liquid cooling.[1]Staff, “Taiwan’s Foxconn says building world’s largest ‘superchip’ plant,” TechXplore, techxplore.com Taiwan’s command of 83% of global AI-chip output underpins a specialized data-center segment where latency, not just uptime, underwrites yield.
Government Green-Energy Subsidy Program for Data-Center PUE Optimization
The Ministry of Economic Affairs links power-usage effectiveness targets to tariff rebates and renewable certificate allocations. Operators that achieve quantifiable drops in PUE through heat-recovery chillers, free-air economization, or on-site photovoltaics gain expedited permits and lower electricity surcharges.[2]Sheila Chiang, “Google invests in BlackRock-backed Taiwanese solar developer,” CNBC, cnbc.com This incentive matrix accelerates the adoption of corporate solar PPAs exceeding 100 MW, a model pioneered by Google’s 300 MW arrangement with New Green Power.
Rapid 5G Roll-Out Driving Edge Micro-Site Demand
Nationwide standalone 5 G coverage reaches 93% in 2025, enabling ultra-low-latency applications in manufacturing automation and smart mobility. Telecom carriers deploy micro-modular data centers at base-station clusters, typically ranging from 50 to 250 kW, to localize content caching and AI inference. These edge nodes complement core campuses yet require synchronized orchestration platforms, adding service-integration revenue streams to colocation providers.
Restraints Impact Analysis
| Restraint | (~) % Impact on CAGR Forecast | Geographic Relevance | Impact Timeline |
|---|---|---|---|
| High seismic risk elevates construction costs and insurance premiums | -1.4% | National, with the highest impact in the eastern coastal regions | Long term (≥ 4 years) |
| Delayed grid-connection approvals in northern hotspots | -2.2% | Northern Taiwan, particularly areas north of Taoyuan | Medium term (2-4 years) |
| Scarcity of experienced bilingual data-center O and M workforce | -0.8% | National, with acute shortages in technical specializations | Medium term (2-4 years) |
| Intensifying power-rationing risk amid aggressive chip-fab expansion | -1.6% | National, with the highest impact in industrial zones | Short term (≤ 2 years) |
| Source: Mordor Intelligence | |||
Delayed Grid-Connection Approvals in Northern Hotspots
Taipower places a moratorium on projects exceeding 5 MW in Taipei and New Taipei, stretching connection lead times beyond 36 months. Operators either fragment deployments into sub-5 MW blocks or relocate to Taoyuan industrial parks, which offer faster hook-ups.[3]James Dalziel et al., “Event Response: Hualien City Earthquake,” Willis Towers Watson, wtwco.com Protracted approvals impose opportunity costs that far outweigh tariff advantages, nudging providers toward on-site solar-plus-storage hybrids to mitigate peak draws.
High Seismic Risk Elevating Construction Cost and Insurance Premiums
Taiwan’s Mw 7.4 Hualien quake in April 2024 prompted insurers to re-rate data-center policies, driving annual premiums to 2–4% of operating costs. Deep-pile foundations, base-isolation pads, and redundant structural bracing now add up to 25% to capex, a hurdle acute for second-tier entrants.[4]Think Hazard, “Taiwan - Tsunami,” thinkhazard.org Despite the added expenditure, Taiwan has registered zero catastrophic data loss events, thanks to stringent code compliance.
Segment Analysis
By Data Center Size: Consolidation around High-Capacity Sites
Large facilities accounted for 58.03% of the Taiwan data center market in 2024, a position explained by economies of scale in power procurement and cooling infrastructure. The Taiwan data center market size allocated to medium sites is projected to grow 10.00% CAGR as edge analytics and regional cloud nodes proliferate. Operators favor multi-story designs to optimize scarce land, while hyperscale giants negotiate multi-hundred-MW campuses on Taoyuan’s industrial plots. Medium-footprint builds (5–15 MW) appeal to domestic enterprises seeking step-wise migration out of on-premise rooms yet unwilling to commit to mega footprints. As a result, supplier ecosystems encompassing prefabricated power modules, aqueous rear-door coolers, and high-density PDUs find a ready customer base.
In parallel, mega and massive campuses, although constituting a smaller slice of overall square footage, command board-level attention because they anchor sovereign-cloud strategies. Chemical-filtering technologies and battery-energy storage systems become integral, allowing operators to meet new emissions-intensity thresholds tied directly to green-power subsidies. Consolidation pressures may trigger mergers among mid-tier players unable to finance ultra-efficient builds, a dynamic that sets the stage for private-equity-backed roll-ups by 2027.

Note: Segment shares of all individual segments available upon report purchase
By Tier Type: Tier 3 as the Pragmatic Sweet Spot
Tier 3 infrastructure accounted for 57.00% of Taiwan's data center market share in 2024 and is forecasted to grow at a 10.80% CAGR. Enterprises are turning to N+1 redundancy, striking a balance between cost and resilience. This approach helps them minimize single points of failure, all while avoiding the hefty capital expenses tied to more advanced fault tolerance models like 2N or N+2. Tier 4 adoption remains confined to trading platforms and national-security workloads that demand 99.995% availability, whereas Tier 1 and 2 sites handle development and test environments that tolerate planned outages. The Taiwan data center market size attributed to Tier 3 aligns with seismic mitigation mandates, which stipulate dual utility feeds and on-site diesel gensets scaled for 72-hour autonomy.
Tier-4 construction faces headwinds – each additional mechanical path doubles the floor-space allocation to chillers and switchgear, inflating real-estate costs in land-scarce districts. Nonetheless, a niche persists among multinationals seeking to replicate their global compliance postures within Taiwan, ensuring a steady but modest Tier 4 pipeline through 2030.
By Data Center Type: Colocation Retains Breadth, Hyperscale Gains Depth
Colocation secured 45.00% revenue in 2024. Retail racks support SMB digitalization, whereas wholesale suites satisfy enterprise cloud bursts and regulatory-driven localization. The Taiwan data center market size for hyperscale self-build facilities is expanding at a 9.20% CAGR, driven by external cloud and internal AI demand. Enterprise and edge architectures constitute a balancing layer, placing compute closer to factories and 5G cells where sub-10-millisecond latency is beneficial.
The colocation model is evolving toward high-density, liquid-ready chambers to host GPU clusters for generative AI start-ups. Taiwan Mobile and Vantage Data Centers’ joint venture exemplifies this shift, offering 30-50 kW racks and closed-loop coolant circuits coupled with carbon-free energy blocks. Conversely, hyperscale campuses integrate on-site substations and solar arrays, bypassing Taipower constraints, and directly contracting local EPC firms for speed-to-capacity advantages.

Note: Segment shares of all individual segments available upon report purchase
By End User: IT and Telecom Lead, BFSI Accelerates
IT and telecommunications accounted for 48.01% of 2024 demand, as local software-as-a-service vendors and mobile operators increased cloud usage. Banking, financial services, and insurance sectors display the highest CAGR of 10.92%, driven by amended outsourcing rules that require personal data to be stored domestically. Mandatory encryption, real-time audit trails, and disaster-recovery zones in separate seismic bands elevate BFSI rack densities and facility certifications.
Manufacturing uptake mirrors Industry 4.0 adoption – factories stream sensor telemetry and machine-vision feeds into local data centers for AI-driven quality control. Government workloads prioritize citizen-data platforms and smart-city dashboards, often stipulating Tier 3 as the baseline. Media and entertainment workloads rise with 4K streaming and esports, yet remain less than 5% of the total power draw, indicating incremental but not transformative growth.
Geography Analysis
Taipei controlled 61.52% of the capacity in 2024 but faces saturated grid allotments and real-estate premiums topping USD 4,000 per square meter. Taoyuan’s 10.55% CAGR trajectory leverages industrial park land banks and proactive permit desks, cutting typical build-to-ready cycles by nine months. The Taiwan data center market in central and southern cities is small yet strategically important. Taichung offers proximity to machine-tool clusters, while Kaohsiung’s harbor could attract subsea cable spurs, giving rise to future edge hubs.
Taipei anchors the national backbone through four submarine cable stations and the densest metro fiber grid. Financial exchanges and cloud on-ramp nodes reside within 5 km of core colocation halls, driving high-margin interconnect revenue. Yet, power application queues now exceed 1.1 GW, prompting new entrants to explore adjacent municipalities. Municipal incentives, such as real-property tax abatements, partially offset opex; however, the city’s seismic-risk zoning requirements demand base-isolation footings, which add 18% to structural budgets.
Taoyuan benefits from dual 345 kV utility loops and zoning coded for “special industrial” uses, streamlining environmental reviews. Land parcels average 20–40 acres, enabling the development of contiguous, multi-building campuses that suit 100 MW hyperscale phases. Aerial-fiber spurs link into Taipei’s carrier hotels, offering sub-1 ms round-trip latency and preserving application performance while avoiding downtown congestion. Local authorities enhance the attractiveness of their areas by issuing accelerated renewable certificates tied to adjacent solar farms.
Secondary regions, such as Taichung and Kaohsiung, emerge as contingency nodes for edge AI inference and disaster-recovery topologies. While lacking hyperscale commitments today, both cities command significant electricity quotas from heavy industries and offer cheaper labor pools. Government policy that promotes balanced regional development could channel future grants toward these markets, potentially diversifying national load distribution and easing northern grid stress.
Competitive Landscape
Market concentration is moderate, with the top five operators controlling a significant share of installed capacity. Chunghwa Telecom leverages domestic fiber and regulatory familiarity to defend enterprise colocation accounts. Chief Telecom focuses on high-interconnect density within Taipei's Nu-Ai Center, offering cross-connects to over 400 network carriers. Amazon and Google headline foreign investors, each layering captive power-purchase agreements over new campuses to manage carbon budgets.
Strategic initiatives center on vertical integration. Google inked a 300 MW solar PPA that hedges both energy costs and sustainability optics. Nvidia and Foxconn's 10,000-GPU Blackwell supercomputer targets sovereign AI infrastructure, reinforcing Taiwan's AI hardware prestige. Domestic challengers such as FarEasTone and Asia Pacific Telecom are exploring mergers to pool their spectrum assets and data center footprints, a move that would increase interconnect switching volumes.
Capital expenditure races intensify risk profiles. Rising steel and copper prices lift per-MW build costs above USD 12 million, while mandatory seismic retrofits and diesel-tier upgrades squeeze returns. Foreign-investment scrutiny by the Department of Investment Review lengthens closing timelines, compelling joint ventures with local entities to smooth compliance pathways.
Taiwan Data Center Industry Leaders
-
Microsoft Corporation
-
Chief Telecom Inc.
-
Chunghwa Telecom Co., Ltd.
-
Google LLC
-
Amazon Web Services, Inc.
- *Disclaimer: Major Players sorted in no particular order

Recent Industry Developments
- June 2025: Nvidia and Foxconn unveiled plans for a 10,000-GPU Blackwell supercomputer, located in Taoyuan, to accelerate national AI research.
- May 2025: The National Science and Technology Council launched a USD 350 million high-performance computing program aimed at AI start-ups.
- March 2025: Foxconn acquired 86.34 acres in Houston, along with a 92,900-square-meter building, for USD 142 million to expand AI server output, underscoring overseas supply-chain integration.
- January 2025: Amazon confirmed that it will invest more than USD 5 billion to deploy a Taiwan AWS region spanning three availability zones.
Taiwan Data Center Market Report Scope
Taipei are covered as segments by Hotspot. Large, Massive, Medium, Mega, Small are covered as segments by Data Center Size. Tier 1 & 2, Tier 1 and 2, Tier 3, Tier 4 are covered as segments by Tier Type. Non-Utilized, Utilized are covered as segments by Absorption.| Small |
| Medium |
| Large |
| Mega |
| Massive |
| Tier 1 and 2 |
| Tier 3 |
| Tier 4 |
| Hyperscale/Self-built | ||
| Enterprise/Edge | ||
| Colocation | Utilized | Retail Colocation |
| Wholesale Colocation | ||
| Non-Utilized | ||
| BFSI |
| IT and ITES |
| E-Commerce |
| Government |
| Manufacturing |
| Media and Entertainment |
| Telecom |
| Other End Users |
| Taipei |
| Taoyuan |
| Rest of Taiwan |
| By Data Center Size | Small | ||
| Medium | |||
| Large | |||
| Mega | |||
| Massive | |||
| By Tier Type | Tier 1 and 2 | ||
| Tier 3 | |||
| Tier 4 | |||
| By Data Center Type | Hyperscale/Self-built | ||
| Enterprise/Edge | |||
| Colocation | Utilized | Retail Colocation | |
| Wholesale Colocation | |||
| Non-Utilized | |||
| By End User | BFSI | ||
| IT and ITES | |||
| E-Commerce | |||
| Government | |||
| Manufacturing | |||
| Media and Entertainment | |||
| Telecom | |||
| Other End Users | |||
| By Hotspot | Taipei | ||
| Taoyuan | |||
| Rest of Taiwan | |||
Market Definition
- IT LOAD CAPACITY - The IT load capacity or installed capacity, refers to the amount of energy consumed by servers and network equipments placed in a rack installed. It is measured in megawatt (MW).
- ABSORPTION RATE - It denotes the extend to which the data center capacity has been leased out. For instance, a 100 MW DC has leased out 75 MW, then absorption rate would be 75%. It is also referred as utilization rate and leased-out capacity.
- RAISED FLOOR SPACE - It is an elevated space build over the floor. This gap between the original floor and the elevated floor is used to accommodate wiring, cooling, and other data center equipment. This arrangement assist in having proper wiring and cooling infrastructure. It is measured in square feet (ft^2).
- DATA CENTER SIZE - Data Center Size is segmented based on the raised floor space allocated to the data center facilities. Mega DC - # of Racks must be more than 9000 or RFS (raised floor space) must be more than 225001 Sq. ft; Massive DC - # of Racks must be in between 9000 and 3001 or RFS must be in between 225000 Sq. ft and 75001 Sq. ft; Large DC - # of Racks must be in between 3000 and 801 or RFS must be in between 75000 Sq. ft and 20001 Sq. ft; Medium DC # of Racks must be in between 800 and 201 or RFS must be in between 20000 Sq. ft and 5001 Sq. ft; Small DC - # of Racks must be less than 200 or RFS must be less than 5000 Sq. ft.
- TIER TYPE - According to Uptime Institute the data centers are classified into four tiers based on the proficiencies of redundant equipment of the data center infrastructure. In this segment the data center are segmented as Tier 1,Tier 2, Tier 3 and Tier 4.
- COLOCATION TYPE - The segment is segregated into 3 categories namely Retail, Wholesale and Hyperscale Colocation service. The categorization is done based on the amount of IT load leased out to potential customers. Retail colocation service has leased capacity less than 250 kW; Wholesale colocation services has leased capacity between 251 kW and 4 MW and Hyperscale colocation services has leased capacity more than 4 MW.
- END CONSUMERS - The Data Center Market operates on a B2B basis. BFSI, Government, Cloud Operators, Media and Entertainment, E-Commerce, Telecom and Manufacturing are the major end-consumers in the market studied. The scope only includes colocation service operators catering to the increasing digitalization of the end-user industries.
| Keyword | Definition |
|---|---|
| Rack Unit | Generally referred as U or RU, it is the unit of measurement for the server unit housed in the racks in the data center. 1U is equal to 1.75 inches. |
| Rack Density | It defines the amount of power consumed by the equipment and server housed in a rack. It is measured in kilowatt (kW). This factor plays a critical role in data center design and, cooling and power planning. |
| IT Load Capacity | The IT load capacity or installed capacity, refers to the amount of energy consumed by servers and network equipment placed in a rack installed. It is measured in megawatt (MW). |
| Absorption Rate | It denotes how much of the data center capacity has been leased out. For instance, if a 100 MW DC has leased out 75 MW, then the absorption rate would be 75%. It is also referred to as utilization rate and leased-out capacity. |
| Raised Floor Space | It is an elevated space built over the floor. This gap between the original floor and the elevated floor is used to accommodate wiring, cooling, and other data center equipment. This arrangement assists in having proper wiring and cooling infrastructure. It is measured in square feet/meter. |
| Computer Room Air Conditioner (CRAC) | It is a device used to monitor and maintain the temperature, air circulation, and humidity inside the server room in the data center. |
| Aisle | It is the open space between the rows of racks. This open space is critical for maintaining the optimal temperature (20-25 °C) in the server room. There are primarily two aisles inside the server room, a hot aisle and a cold aisle. |
| Cold Aisle | It is the aisle wherein the front of the rack faces the aisle. Here, chilled air is directed into the aisle so that it can enter the front of the racks and maintain the temperature. |
| Hot Aisle | It is the aisle where the back of the racks faces the aisle. Here, the heat dissipated from the equipment’s in the rack is directed to the outlet vent of the CRAC. |
| Critical Load | It includes the servers and other computer equipment whose uptime is critical for data center operation. |
| Power Usage Effectiveness (PUE) | It is a metric which defines the efficiency of a data center. It is calculated by: (𝑇𝑜𝑡𝑎𝑙 𝐷𝑎𝑡𝑎 𝐶𝑒𝑛𝑡𝑒𝑟 𝐸𝑛𝑒𝑟𝑔𝑦 𝐶𝑜𝑛𝑠𝑢𝑚𝑝𝑡𝑖𝑜𝑛)/(𝑇𝑜𝑡𝑎𝑙 𝐼𝑇 𝐸𝑞𝑢𝑖𝑝𝑚𝑒𝑛𝑡 𝐸𝑛𝑒𝑟𝑔𝑦 𝐶𝑜𝑛𝑠𝑢𝑚𝑝𝑡𝑖𝑜𝑛). Further, a data center with a PUE of 1.2-1.5 is considered highly efficient, whereas, a data center with a PUE >2 is considered highly inefficient. |
| Redundancy | It is defined as a system design wherein additional component (UPS, generators, CRAC) is added so that in case of power outage, equipment failure, the IT equipment should not be affected. |
| Uninterruptible Power Supply (UPS) | It is a device that is connected in series with the utility power supply, storing energy in batteries such that the supply from UPS is continuous to IT equipment even during utility power is snapped. The UPS primarily supports the IT equipment only. |
| Generators | Just like UPS, generators are placed in the data center to ensure an uninterrupted power supply, avoiding downtime. Data center facilities have diesel generators and commonly, 48-hour diesel is stored in the facility to prevent disruption. |
| N | It denotes the tools and equipment required for a data center to function at full load. Only "N" indicates that there is no backup to the equipment in the event of any failure. |
| N+1 | Referred to as 'Need plus one', it denotes the additional equipment setup available to avoid downtime in case of failure. A data center is considered N+1 when there is one additional unit for every 4 components. For instance, if a data center has 4 UPS systems, then for to achieve N+1, an additional UPS system would be required. |
| 2N | It refers to fully redundant design wherein two independent power distribution system is deployed. Therefore, in the event of a complete failure of one distribution system, the other system will still supply power to the data center. |
| In-Row Cooling | It is the cooling design system installed between racks in a row where it draws warm air from the hot aisle and supplies cool air to the cold aisle, thereby maintaining the temperature. |
| Tier 1 | Tier classification determines the preparedness of a data center facility to sustain data center operation. A data center is classified as Tier 1 data center when it has a non-redundant (N) power component (UPS, generators), cooling components, and power distribution system (from utility power grids). The Tier 1 data center has an uptime of 99.67% and an annual downtime of <28.8 hours. |
| Tier 2 | A data center is classified as Tier 2 data center when it has a redundant power and cooling components (N+1) and a single non-redundant distribution system. Redundant components include extra generators, UPS, chillers, heat rejection equipment, and fuel tanks. The Tier 2 data center has an uptime of 99.74% and an annual downtime of <22 hours. |
| Tier 3 | A data center having redundant power and cooling components and multiple power distribution systems is referred to as a Tier 3 data center. The facility is resistant to planned (facility maintenance) and unplanned (power outage, cooling failure) disruption. The Tier 3 data center has an uptime of 99.98% and an annual downtime of <1.6 hours. |
| Tier 4 | It is the most tolerant type of data center. A Tier 4 data center has multiple, independent redundant power and cooling components and multiple power distribution paths. All IT equipment are dual powered, making them fault tolerant in case of any disruption, thereby ensuring interrupted operation. The Tier 4 data center has an uptime of 99.74% and an annual downtime of <26.3 minutes. |
| Small Data Center | Data center that has floor space area of ≤ 5,000 Sq. ft or the number of racks that can be installed is ≤ 200 is classified as a small data center. |
| Medium Data Center | Data center which has floor space area between 5,001-20,000 Sq. ft, or the number of racks that can be installed is between 201-800, is classified as a medium data center. |
| Large Data Center | Data center which has floor space area between 20,001-75,000 Sq. ft, or the number of racks that can be installed is between 801-3,000, is classified as a large data center. |
| Massive Data Center | Data center which has floor space area between 75,001-225,000 Sq. ft, or the number of racks that can be installed is between 3001-9,000, is classified as a massive data center. |
| Mega Data Center | Data center that has a floor space area of ≥ 225,001 Sq. ft or the number of racks that can be installed is ≥ 9001 is classified as a mega data center. |
| Retail Colocation | It refers to those customers who have a capacity requirement of 250 kW or less. These services are majorly opted by small and medium enterprises (SMEs). |
| Wholesale Colocation | It refers to those customers who have a capacity requirement between 250 kW to 4 MW. These services are majorly opted by medium to large enterprises. |
| Hyperscale Colocation | It refers to those customers who have a capacity requirement greater than 4 MW. The hyperscale demand primarily originates from large-scale cloud players, IT companies, BFSI, and OTT players (like Netflix, Hulu, and HBO+). |
| Mobile Data Speed | It is the mobile internet speed a user experiences via their smartphones. This speed is primarily dependent on the carrier technology being used in the smartphone. The carrier technologies available in the market are 2G, 3G, 4G, and 5G, where 2G provides the slowest speed while 5G is the fastest. |
| Fiber Connectivity Network | It is a network of optical fiber cables deployed across the country, connecting rural and urban regions with high-speed internet connection. It is measured in kilometer (km). |
| Data Traffic per Smartphone | It is a measure of average data consumption by a smartphone user in a month. It is measured in gigabyte (GB). |
| Broadband Data Speed | It is the internet speed that is supplied over the fixed cable connection. Commonly, copper cable and optic fiber cable are used in both residential and commercial use. Here, optic cable fiber provides faster internet speed than copper cable. |
| Submarine Cable | A submarine cable is a fiber optic cable laid down at two or more landing points. Through this cable, communication and internet connectivity between countries across the globe is established. These cables can transmit 100-200 terabits per second (Tbps) from one point to another. |
| Carbon Footprint | It is the measure of carbon dioxide generated during the regular operation of a data center. Since, coal, and oil & gas are the primary source of power generation, consumption of this power contributes to carbon emissions. Data center operators are incorporating renewable energy sources to curb the carbon footprint emerging in their facilities. |
Research Methodology
Mordor Intelligence follows a four-step methodology in all our reports.
- Step-1: Identify Key Variables: In order to build a robust forecasting methodology, the variables and factors identified in Step-1 are tested against available historical market numbers. Through an iterative process, the variables required for market forecast are set and the model is built on the basis of these variables.
- Step-2: Build a Market Model: Market-size estimations for the forecast years are in nominal terms. Inflation is not a part of the pricing, and the average selling price (ASP) is kept constant throughout the forecast period for each country.
- Step-3: Validate and Finalize: In this important step, all market numbers, variables and analyst calls are validated through an extensive network of primary research experts from the market studied. The respondents are selected across levels and functions to generate a holistic picture of the market studied.
- Step-4: Research Outputs: Syndicated Reports, Custom Consulting Assignments, Databases & Subscription Platforms


