
Tablet Coatings Market Size and Share
Market Overview
| Study Period | 2020 - 2031 |
|---|---|
| Market Size (2026) | USD 1.04 Billion |
| Market Size (2031) | USD 1.33 Billion |
| Growth Rate (2026 - 2031) | 5.12 % |
| Fastest Growing Market | Asia-Pacific |
| Largest Market | Asia Pacific |
| Market Concentration | Medium |
Major Players *Disclaimer: Major Players sorted in no particular order Image © Mordor Intelligence. Reuse requires attribution under CC BY 4.0. | |
Tablet Coatings Market Analysis by Mordor Intelligence
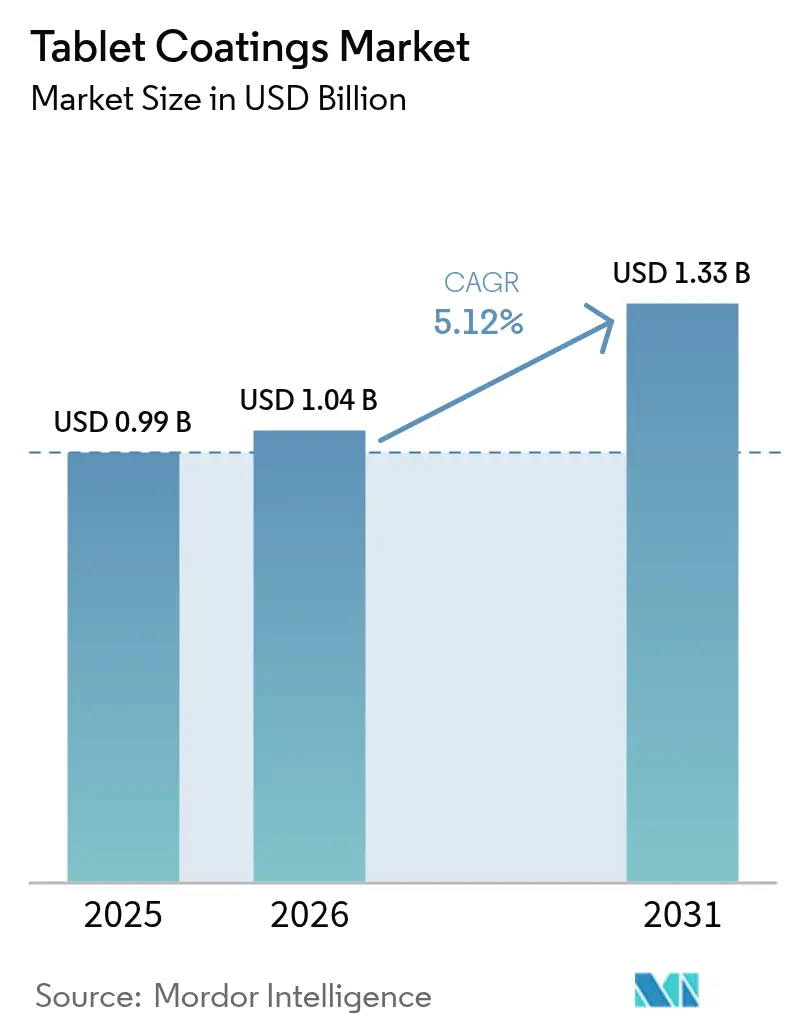
tablet coatings market size in 2026 is estimated at USD 1.04 billion, growing from 2025 value of USD 0.986 billion with 2031 projections showing USD 1.33 billion, growing at 5.12% CAGR over 2026-2031. Robust capital spending by drug makers, a pivot toward continuous manufacturing, and tightening quality expectations are the prime forces behind this steady expansion. Film-coated tablets hold more than half of current demand, while enteric technologies register the quickest unit growth as companies pursue targeted delivery. Asia-Pacific’s share already tops one-third of global value and continues to grow thanks to aggressive capacity additions in India and China. Heightened scrutiny of titanium dioxide is reshaping formulation strategies, yet regulatory bodies in the United States, Europe, and Asia simultaneously encourage adoption of advanced, more sustainable coating systems. Against this backdrop, the tablet coatings market offers suppliers a multi-year runway for incremental volume as well as premium, technology-rich opportunities.
Key Report Takeaways
- By coating type, film-coated tablets led with 52.74% revenue share in 2025, whereas enteric-coated products are forecast to post the fastest 6.73% CAGR to 2031.
- By polymer, cellulose ethers commanded 38.25% share of the tablet coatings market size in 2025; acrylic acid polymers are projected to expand at an 7.86% CAGR through 2031.
- By formulation component, plasticizers delivered 41.88% of 2025 revenue, while colorants are on track for a 6.95% CAGR to 2031.
- By process, conventional pan equipment held 40.92% of the 2025 tablet coatings market share, with continuous systems advancing at an 7.98% CAGR.
- By application, immediate-release coatings accounted for 47.76% of 2025 value; sustained-release solutions are expected to grow at 7.46% to the end of the decade.
- By end-user, pharmaceutical manufacturers retained 61.83% share in 2025, yet CDMOs/CMOs are slated for the highest 8.02% CAGR.
- By geography, Asia-Pacific dominated at 33.67% share in 2025 and is simultaneously the fastest-growing region with an 7.72% CAGR projection.
Note: Market size and forecast figures in this report are generated using Mordor Intelligence’s proprietary estimation framework, updated with the latest available data and insights as of 2026.
Global Tablet Coatings Market Trends and Insights
Drivers Impact Analysis*
| Driver | (~) % Impact on CAGR Forecast | Geographic Relevance | Impact Timeline |
|---|---|---|---|
| Expeditious growth of the global pharmaceutical manufacturing base | +1.8% | Global (APAC & North America concentration) | Medium term (2–4 years) |
| Rapid adoption of orphan drugs & nutraceuticals | +1.2% | Global (North America & Europe lead) | Long term (≥ 4 years) |
| Growing demand for taste-masking & aesthetic coatings for pediatric and geriatric compliance | +0.9% | Global (developed markets first) | Short term (≤ 2 years) |
| Shift toward continuous manufacturing in solid-dose formulations | +0.7% | North America & EU extending to APAC | Medium term (2–4 years) |
| Personalized medicine driving demand for mini-tabs & micro-encapsulation | +0.5% | North America & EU, spill-over to APAC | Long term (≥ 4 years) |
| Accelerated regulatory approvals shortening time-to-market for reformulated tablets | +0.4% | Global | Short term (≤ 2 years) |
| Source: Mordor Intelligence | |||
Expeditious Growth Of The Global Pharmaceutical Manufacturing Base
Drug makers have launched an unprecedented wave of bricks-and-mortar expansion. PCI Pharma Services earmarked USD 365 million for coating-friendly lines in the United States and Europe, while CordenPharma allocated EUR 900 million to peptides that rely on sophisticated protective layers. In Asia, WuXi STA activated a 169-acre active-ingredient campus and tripled peptide capacity, reflecting the region’s appetite for complex solid forms. These multimillion-dollar moves immediately lift baseline consumption of coating polymers, pigments, and plasticizers. They also spur downstream investments such as Lotte Fine Chemical’s USD 740 million cellulose pact with Colorcon, which aims to secure a leadership position in excipient supply. As more biologicals make the leap to oral dosage, demand extends beyond conventional barrier films into moisture-tight or enteric layers engineered for fragile APIs. For suppliers, the expanding factory footprint translates into recurring raw-material volumes, steady retrofits of aging pans, and adoption of inline quality controls that favor premium, ready-to-use powders.
Rapid Adoption Of Orphan Drugs & Nutraceuticals
Record orphan-drug approvals and booming nutraceutical launches broaden the coating toolbox. Vertex, Gilead, and peer innovators each spent more than USD 4 billion in 2024 to secure rare-disease candidates that often demand pH-dependent release or micro-layered actives for low-dose accuracy. On the supplement side, Colorcon debuted Nutrapure, the first aqueous clear organic film system, crafted to satisfy clean-label consumers without compromising stability. Evonik’s EUDRAGUARD® line delivers probiotic-friendly enteric functionality, showing how pharmaceutical-grade science migrates into wellness products. Hovione’s pact with Zerion Pharma extends high-surface-area Dispersome carriers to vitamin blends, highlighting the cross-pollination of Rx and OTC technologies. With the FDA now offering clearer notification rules for new dietary ingredients, novel coatings can reach shelves faster while capturing premium margins.
Growing Demand For Taste-Masking & Aesthetic Coatings For Pediatric And Geriatric Compliance
Palatable dosage forms materially improve adherence. University of California – San Diego confirmed that a single timed-release capsule wrapped in pH-responsive layers could replace multiple daily pills for chronic disease sufferers.[1]UCSD News Staff, “Timed-Release Capsule Could Replace Multiple Pills,” UC San Diego, phys.orgClinical trials show in-situ coating boosts swallowability in 87% of children and enhances perceived taste in 85% of cases, quantifying real-world benefits. Formulators now lean on electronic-tongue analytics to perfect polymer blends, isolating sugar, fat, and pH variables that correlate with sensory scores.[2]George Brown, “Suitability of E-tongue Sensors,” Springer Nature, link.springer.com The University of Nottingham’s multi-material ink-jet 3D printing takes personalization further by embedding color coding and dose titration in a single print job. As regulators finalize guidance on alternative colorants, brand owners seize the chance to refresh visual identity while simultaneously hitting compliance targets.
Shift Toward Continuous Manufacturing In Solid-Dose Formulations
Cost and quality pressures are pushing tablet lines from batch to continuous flow. The FDA’s January 2025 advanced-manufacturing guidance creates a preferential review lane for equipment such as GEA’s ConsiGma, which integrates dosing, granulation, drying, and film coating in one skid. Hovione installed a next-generation continuous tableting suite in Lisbon that halves development time and slashes material use during scale-up. Syntegon’s Settle Plate Changer automates viable monitoring, cutting manual interventions by 80% and ensuring data-rich coating runs. For excipient vendors, continuous lines favor ready-to-use aqueous dispersions that dissolve quickly and exhibit tight viscosity windows, reinforcing demand for premium high-purity grades.
Restraints Impact Analysis*
| Restraint | (~) % Impact on CAGR Forecast | Geographic Relevance | Impact Timeline |
|---|---|---|---|
| Stringent & divergent regional GMP requirements | -1.1% | Global (EU-US-APAC) | Medium term (2–4 years) |
| Time- and cost-intensive coating process validation | -0.8% | Global | Short term (≤ 2 years) |
| Rising scrutiny of titanium-dioxide use | -0.6% | EU-led, potential global ripple | Medium term (2–4 years) |
| Supply-chain volatility in specialty polymers | -0.4% | Global (polymer-producing hubs) | Short term (≤ 2 years) |
| Source: Mordor Intelligence | |||
Stringent & Divergent Regional GMP Requirements
Regulatory labyrinths complicate execution. Europe’s 2024 draft medicines law adds layers of supply-chain traceability, while the FDA’s CFR 211.110 revision mandates scientifically justified sampling plans.[3]European Pharmaceutical Review Staff, “GMP Update 2024/2025,” ECA Academy, gmp-journal.com Asia-Pacific introduces country-specific modules despite PIC/S harmonization, forcing manufacturers to compile overlapping dossiers for India, China, and Japan. For coaters, each jurisdiction can demand fresh validation of inlet air temperature, spray pattern, and cleaning cycles. The added paperwork inflates launch budgets and slows global rollout, blunting some CAGR upside predicted for the tablet coatings market.
Time- and Cost-Intensive Coating Process Validation
Every new film layer requires demonstration of uniformity, stability, and leachable safety. Stability testing alone can span six to 12 months under ICH conditions, delaying revenue capture. Pilot-scale batches consume kilograms of API, which is especially costly for high-potency oncology products. Real-time-release testing reduces some burden but still necessitates complex multivariate models and regulator concurrence. These hurdles encourage companies to favor well-characterized, ready-to-use systems, yet smaller firms often lack funds for upfront validation, limiting broad adoption.
*Our forecasts treat driver/restraint impacts as directional, not additive. The impact forecasts reflect baseline growth, mix effects, and variable interactions.
Segment Analysis
By Coating Type: Film-Coated Dominance Drives Innovation
Film-coated tablets contributed 52.74% of 2025 revenue, underscoring how a single layer can combine moisture protection, UV shielding, and brand color in one economical pass. The tablet coatings market size for enteric-coated formats is projected to rise at 6.73% CAGR as biologic actives and probiotics demand intestine-directed release. Over the next five years, film formulations will integrate digital watermark pigments for anti-counterfeiting and low-foaming surfactants to support continuous lines. Concurrently, sugar-coat demand will stay niche, serving mainly pediatric syrups converted into chewable cores.
Continuous processing magnifies film-coat advantages because the step’s short residence time aligns well with ready-to-use aqueous systems. Hovione’s Lisbon installation links continuous granulation to direct pan coating, demonstrating 30% faster cycle times versus batch. Enteric players innovate with plasticizer-free acrylic dispersions that cut preparation time by 70%, led by Evonik’s EUDRAGIT FL 30 D-55. Suppliers see rising orders for functional films combining delayed and sustained-release layers in single-step processes, saving floor space and validation hours.


By Polymer: Cellulose Ethers Lead Amid Acrylic Innovation
Cellulose ethers owned 38.25% of 2025 demand thanks to a decades-long safety record and universal compendial listings. Acrylics, however, show an 7.86% forward CAGR, positioning them as the fastest polymer class in the broader tablet coatings market. Pharmaceutical buyers value acrylics for superior film strength under low solids and for ease of pH tuning, both key for continuous spray. Lotte Fine Chemical’s partnership with Colorcon aims to enlarge cellulose output dramatically, a sign core users still prioritize supply security for traditional grades.
Next-generation acrylics integrate quaternary-amine groups for colon targeting, while bio-based celluloses gain momentum in sustainability audits. The tablet coatings market share that acrylics capture will also benefit from regulatory pressures on TiO2 because many acrylic dispersions mask core discoloration without added opacifiers. Polymer producers invest in green-chemistry solvent recovery and energy-efficient reactors to lower scope-1 emissions, aligning with ESG mandates from top-20 pharma customers.
By Formulation Component: Plasticizers Dominate While Colorants Accelerate
Plasticizers represented 41.88% of revenue in 2025 because nearly every film requires flexibility to resist edge chipping. Yet colorants, at a 6.95% projected CAGR, will outpace all other additives as companies revamp branding and compliance with new FDA color guidance fda.gov. The tablet coatings market size for colorants is set to expand further as traceability tools embed QR-readable patterns directly into thin films.
Sorbitol and triethyl citrate remain top plasticizers, but their dosage is dropping as polymer science advances toward inherently pliable backbones. Titanium-dioxide-free opacifiers based on calcium carbonate are gaining traction, although higher loadings are required to reach equivalent hiding power, which nudges solvent demand upward. Multifunctional anti-tack agents that double as gloss enhancers help formulators reduce ingredient count and validation burden.
By Process/Equipment: Conventional Pan Coating Leads Amid Continuous Innovation
Conventional pans still held 40.92% of 2025 throughput, reflecting broad installed bases in generics plants. Continuous lines, posting an 7.98% forward CAGR, are the headline story in the tablet coatings market. Early adopters report 30% less waste and real-time release testing that short-circuits days-long lab waits. Syntegon’s SPC-1000 and GEA’s ConsiGma exemplify platforms that integrate environmental monitoring, PAT, and cleaning validation into digital twins, cutting change-over from hours to minutes.
Perforated pans find use where heat-sensitive actives need gentle drying, and fluidized beds thrive in pellet and multiparticulate niches. Equipment OEMs now ship plug-and-play skids with cloud-ready sensors so users can benchmark coating uniformity across sites, a key element in global tech-transfer programs.
By Application: Immediate-Release Dominates While Sustained-Release Accelerates
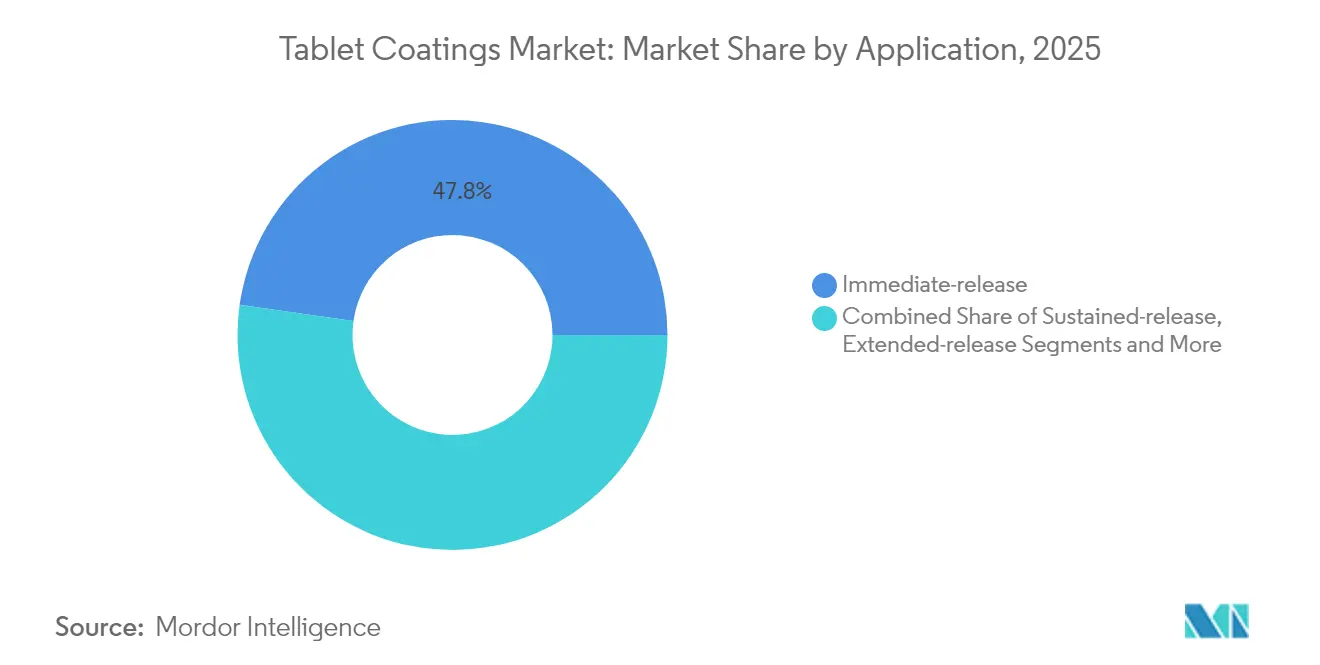
Immediate-release layers accounted for 47.76% of 2025 spending; routine taste masking and brand coloration keep this share high. Sustained-release coatings, forecast at 7.46% CAGR, reflect chronic disease realities and payer preference for once-daily dosing. The tablet coatings market share for extended-release profiles is growing in cardiometabolic therapy where steady plasma levels improve outcomes.
3D-printed prototypes demonstrate pulsatile release by stacking dissimilar polymers in concentric rings. pH-responsive delayed-release designs are increasingly combined with time-based diffusion barriers, yielding hybrid systems that maintain acid protection yet offer afternoon drug pulses. Such complexity elevates the value of process-analytical-technology-enabled coaters capable of monitoring layer thickness in microns.
By End-User: Pharmaceutical Manufacturers Lead While CDMOs Accelerate
Originator and generic drug makers generated 61.83% of 2025 demand, leveraging captive formulary control to optimize coatings. CDMOs/CMOs, with an 8.02% CAGR outlook, are expanding fastest as big pharma outsources older molecules and niche therapies. Adare Pharma Solutions upgraded its Italian site for high-potency coatings, while Serán BioScience broke ground on a USD 200 million Oregon facility tailored for continuous lines.
The tablet coatings industry model is thus bifurcating: large pharma retains strategic pipelines yet relies on partners for volume flexibility and specialized polymer know-how. Nutraceutical houses adopt pharmaceutical standards via turnkey systems such as Roquette’s plant-based ReadiLYCOAT™, further stretching end-user diversity.
Geography Analysis
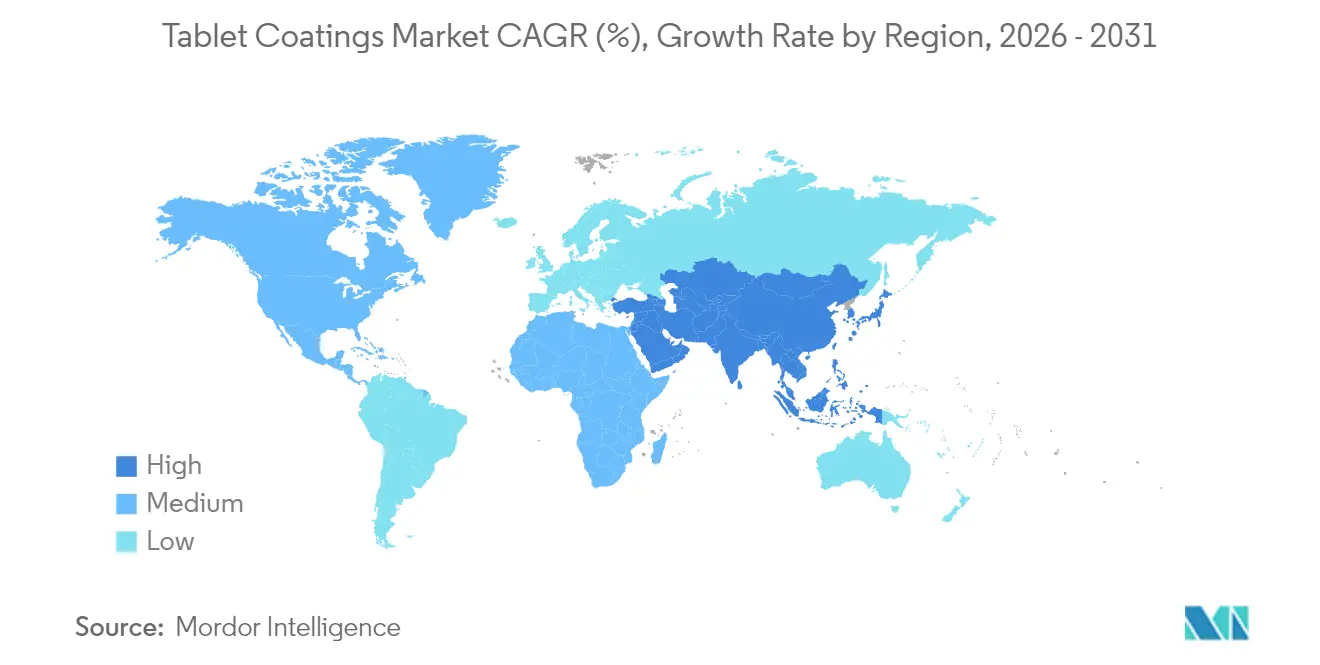
Asia-Pacific controlled 33.67% of 2025 revenue and is projected for an 7.72% CAGR, making it both the largest and the fastest region in the tablet coatings market. India’s CRDMO operators collectively announce multi-year capex aimed at doubling coated-tablet output by 2030, supported by government production incentives. China’s modernization drive includes WuXi STA’s peptide complex that triples spray-drying and film-coating capacity; Korean player SK pharmteco injects USD 260 million into small-molecule lines, underscoring regional momentum. These investments pull in coating raw materials ranging from hydroxypropyl methylcellulose to specialized color blends.
North America retains its innovation edge. The FDA’s 2025 guideline on continuous processing triggers fresh equipment orders, while USD 160 billion in projected pharmaceutical capex provides a steady pipeline for retrofit opportunities. PCI Pharma’s USD 365 million upgrade and Hovione’s USD 170 million New Jersey expansion highlight the commitment to higher-value coating technologies.
Europe wrestles with regulatory unknowns surrounding TiO2 but compensates through technology leadership and large-scale peptide projects. CordenPharma’s EUR 900 million commitment underlines continued confidence, and Evonik’s restructuring channels resources into high-growth drug-delivery coatings. The upcoming EMA opinion on TiO2 may catalyze a wave of reformulations, providing suppliers of calcium-carbonate opacifiers and polymeric whiteners with new revenue streams.

Regulatory Landscape
Tablet coating materials and processes fall under global GMP and quality frameworks that address excipient safety, manufacturing controls, and post-approval changes. In the United States, the FDA Inactive Ingredient Database (IID) is a key reference for excipient use in drug products and is updated on a quarterly cadence (January, April, July, and October), which affects how coating polymers, plasticizers, colorants, and opacifiers are justified in submissions and lifecycle updates.
In Europe, EMA quality guidance is tightening expectations for excipients used in solid oral dosage forms. EMA implemented Q&A requirements for co-processed excipients (CoPE) in solid oral dosage forms effective August 1, 2026, introducing risk categories that shape dossier depth and supplier qualification. Separately, EMA Guideline on stability testing for variations (Revision 3) became effective January 15, 2026, explicitly covering situations where changes in coating weight are critical to release mechanisms, raising the documentation and stability-data burden for modified-release and enteric coated tablets. ICH Q3D(R2) remains the cross-region anchor for elemental-impurity risk assessments applied to excipients and finished products.
Value Chain Analysis
The tablet coatings value chain begins with upstream chemical and mineral inputs that feed polymer and additive manufacturing (cellulose ethers, acrylic polymers, plasticizers, pigments/opacifiers, anti-tack agents). These inputs then get converted by formulators into ready-to-use coating systems (aqueous dispersions or dry blends), which pharmaceutical manufacturers and CDMOs/CMOs apply using conventional pans, perforated pans, fluid beds, or continuous coaters.
Qualification and compliance requirements shape bottlenecks and differentiation across the chain. EMA guidance on excipient labeling and emerging expectations for co-processed excipients increase scrutiny through tighter supplier audits, more traceable documentation, and stricter change-notification discipline, which tends to raise the value of established excipient players and validated, ready-to-use systems. Supply resilience and localization remain visible priorities, with Ashland announcing in June 2026 the groundbreaking of a new aquarius film coatings manufacturing facility in Ambernath, Maharashtra, India. Innovation aimed at titanium dioxide-free solutions is also advancing, with BIOGRUND and Seprify launching a plant-based coating system in April 2026 using Seprify's cellulose-based SilvaAlba ingredient.
Competitive Landscape
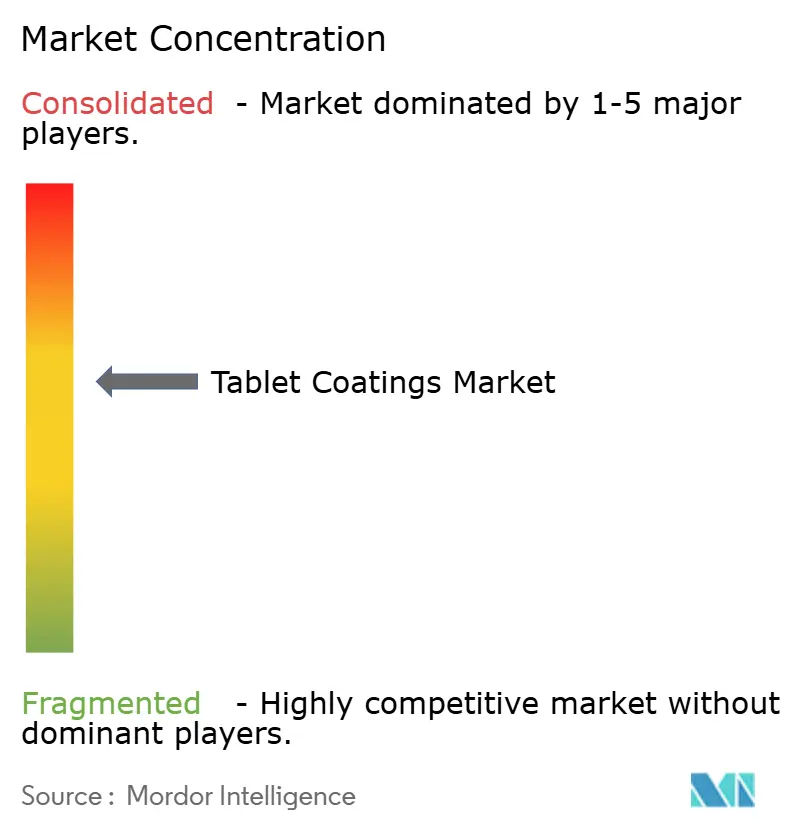
The tablet coatings market remains moderately concentrated. Colorcon tops the leaderboard, cementing position via a USD 740 million cellulose distribution alliance with Lotte Fine Chemical. BASF leverages a broad excipient catalog, while Evonik focuses on specialty acrylics that cut preparation time by 70%. Continuous innovation is vital. Jabil’s acquisition of Pharmaceutics International adds 360,000 ft² of CDMO space, signaling rising demand for turnkey coating services. Integer Holdings acquired Precision Coating to blend device surface expertise with pharma coatings, hinting at cross-sector convergence.
Partnerships drive technical depth. Hovione and Zerion Pharma formed a venture to scale Dispersome carriers, while Colorcon launches Nutrapure, targeting clean-label supplement makers. Sustainability is another competition axis; suppliers race to offer TiO2-free whites and biodegradable polymers in advance of potential mandates. Digitalization equally separates leaders, as companies integrate PAT, MES, and cloud analytics into equipment offerings, cutting downtime and providing predictive maintenance insights to clients.
Tablet Coatings Industry Leaders
Merck KGaA
Kerry Group PLC
Ashland Global Holdings
BASF SE
Evonik Industries AG
- *Disclaimer: Major Players sorted in no particular order

Market Opportunities and Future Outlook
The most immediate opportunity centers on reformulation and change-control support as coating compositions and weights are adjusted to meet evolving quality expectations, particularly for functional coatings where the layer is tied directly to release performance. In Europe, updated variation handling for quality changes effective mid-January 2026 classifies coating-weight changes by criticality to release mechanisms, expanding demand for suppliers and service partners that provide application know-how, stability packages, and manufacturing-ready systems designed to shorten validation and comparability work.
Equipment and process upgrades create another whitespace where coating suppliers and OEMs can co-develop robust, PAT-friendly film systems for both batch and continuous environments. Romaco's May 2026 debut of the Maximus 400 tablet coater, featuring automated baffle geometry adjustment and radar-based spray arm technology, illustrates user pull for improved endpoint control and repeatability across variable batch sizes. On the excipient side, EU action in January 2026 authorizing shellac (E 904) as a glazing agent in foods for special medical purposes in tablet and coated tablet forms points to continued product development for specialized coated formats, while ongoing scrutiny of titanium dioxide keeps the commercial pathway open for titanium dioxide-free opacification and plant-based coating systems already entering the market.
Recent Industry Developments
- June 2026: Ashland announced the groundbreaking of its fourth global and first South Asian tablet coatings manufacturing facility in Ambernath, Maharashtra, India, designed to produce the aquarius film coating portfolio. The investment supports regional supply continuity for fast-growing solid-dose manufacturing clusters and aims to improve lead times for coating systems that require tight quality controls.
- July 2025: Colorcon celebrated the grand opening of a 200,000 square-foot film coating manufacturing facility in Johor, Malaysia, positioned as a regional production hub for Asia-Pacific customers. The added footprint improves local availability of film-coating systems and reduces cross-border logistics complexity for multinational and regional pharma supply chains.
- April 2025: Ashland completed a USD 10 million expansion of its pharmaceutical manufacturing plant in Cabreuva, Brazil, adding capacity for Aquarius tablet coatings and upgrading microbial protection capabilities supporting its Sao Paulo R and D laboratory. The upgrade improves supply resilience for the Americas and aligns plant capabilities with tighter microbiological and quality expectations for aqueous coating systems.


Research Methodology Framework and Report Scope
Market Definition and Coverage
For this study, the tablet coatings market covers the materials and related coating inputs used to apply protective or functional layers on oral solid tablets across pharmaceutical and nutraceutical manufacturing, measured in value terms.
Scope exclusions: We exclude standalone coating equipment, contract manufacturing revenues, and downstream finished drug sales, unless coating materials are explicitly priced within the coating supply.
Segmentation Overview
- By Coating Type
- Film-coated
- Sugar-coated
- Enteric-coated
- Functional coatings
- Other coating types
- By Polymer
- Cellulose ethers
- Acrylic acid polymers
- Vinyl alcohol polymers
- Polyethylene glycol & derivatives
- Other polymers
- By Formulation Component
- Plasticizers
- Colorants
- Solvents / Vehicles
- Opacifiers & anti-tack agents
- By Process / Equipment
- Conventional pan coating
- Perforated pan coating
- Fluidized-bed coating
- Continuous coating systems
- By Application
- Immediate-release
- Sustained-release
- Extended-release
- Delayed / enteric release
- By End-User
- Pharmaceutical manufacturers
- Nutraceutical & dietary-supplement companies
- CDMOs & CMOs
- By Geography
- North America
- United States
- Canada
- Mexico
- Europe
- Germany
- United Kingdom
- France
- Italy
- Spain
- Rest of Europe
- Asia-Pacific
- China
- Japan
- India
- Australia
- South Korea
- Rest of Asia-Pacific
- Middle East and Africa
- GCC
- South Africa
- Rest of Middle East and Africa
- South America
- Brazil
- Argentina
- Rest of South America
- North America
Data Sources, Market Sizing, and Validation
Desk Research
Desk research was used to set the market boundary, build initial assumptions, and sanity check demand signals before numbers were modeled. We leaned on public sources that reflect oral solid dose activity and excipient usage patterns, such as the US FDA database and guidance updates, the European Medicines Agency publications, the US Pharmacopeia (USP) standards, and International Council for Harmonisation (ICH) quality guidelines.
To connect coatings demand to real production, we also reviewed sources such as national trade and manufacturing statistics, customs and trade releases where available, peer reviewed pharmaceutics journals for coating material trends, and trade association updates linked to excipient and nutraceutical output. Company annual reports, investor presentations, and reputable industry news were used to map supplier footprints and typical pricing logic, supported by a paid subscription for company financials and another for patent and innovation tracking. The sources listed above are illustrative, and other public references were also used for data collection, validation, and clarification.
Primary Interviews and Surveys
Primary work focused on checking what drives coatings consumption in practice, since it is strongly linked to tablet production choices and formulation shifts. We spoke with coating material suppliers, excipient distributors, formulation scientists, and manufacturing and quality leaders across APAC, EMEA, and the Americas to confirm adoption levels, pricing moves, and usage intensity by application.
Distribution of primary research fieldwork respondents
| Company type | Respondent position | Region |
|---|---|---|
| Top tier: 27% | CXOs: 15% | APAC: 47% |
| Mid tier: 53% | Functional/Unit leaders: 33% | EMEA: 34% |
| Smaller Players: 20% | Managers: 52% | Americas: 19% |
Market-Sizing & Forecasting
Sizing started with a top-down build that reconstructs coating demand from oral solid dose activity, and then narrowed it using coating penetration and use-rate assumptions by application. In practice, we used a demand pool logic tied to variables such as coated tablet share within total tablet output, the mix shift between film and enteric coatings, the share of aqueous versus solvent systems, and typical coating weight gain ranges used for protection or modified release.
Those totals were corroborated with selective bottom-up approximations, mainly by rolling up sampled supplier revenues by region, running channel checks on coating material price bands, and stress testing volumes through sample ASP times consumption estimates. Where bottom-up visibility was incomplete for smaller suppliers or private entities, gaps were handled through conservative share-of-supply assumptions, and those assumptions were kept only after being checked with interview feedback.
For forecasting, we used scenario analysis because the market is sensitive to a few visible drivers that can move differently by region. The forward view was anchored to expected pharmaceutical and nutraceutical manufacturing growth, pipeline to commercialization conversion signals, regulatory shifts that influence solvent use, and ongoing formulation moves toward functional coatings that support stability or targeted release. The scenario outputs were then reviewed with experts to keep the CAGR path realistic.
Data Validation & Update Cycle
We validate outputs by triangulating modeled totals against independent signals, including oral solid manufacturing momentum, observed coating mix trends, and price movement ranges collected during interviews. Outliers are flagged early, and the assumptions behind them are rechecked, followed by a second analyst review so the final totals are consistent across regions and applications.
Reports are refreshed on an annual cycle, and interim updates are triggered when material events occur, such as regulatory changes tied to solvents, sharp raw material cost movement, or meaningful capacity additions. Before delivery, we run a final review pass so clients receive an updated view that reflects the latest available public releases and recent expert feedback.
Mordor Intelligence's Tablet Coatings Market Sizing Compared With Other Published Estimates
Published market sizes for tablet coatings often vary because each publisher draws the boundary in a slightly different way, and then applies its own assumptions for coating penetration, pricing, and what counts as in-scope revenue. Differences also show up when base years do not match, or when the update timing misses recent formulation and compliance shifts.
Production linked checks, such as oral solid dose output direction, coating mix signals, and interview-confirmed price bands, are the evidence points that keep Mordor Intelligence aligned to a repeatable demand pool for coating materials, instead of counting adjacent revenues like equipment or finished dosage sales. The remaining gaps usually come from whether nutraceutical usage is included fully, how aqueous systems are priced versus solvent systems, and whether the model uses a single CAGR overlay rather than region-level drivers and re-contacts.
Benchmark comparison
| Source | Market Size | Gaps in Research Methodology |
|---|---|---|
| Mordor Intelligence | USD 1.04 B (2026) | |
| Trade Journal A | USD 0.92 B (2024) | Uses an earlier base year and does not make the scope boundary clear on whether nutraceutical coating materials and reformulation-driven functional coatings are fully captured, which can compress the value total. |
| Industry Publisher B | USD 0.90 B (2026) | Appears to apply a higher growth curve off a smaller starting pool, with limited transparency on how coating weight gain, film versus enteric mix, and aqueous price progression are modeled across regions. |
Across the three values, the spread is mainly explained by base-year alignment and the practical boundary around what is counted as coating materials revenue. By tying the model to visible manufacturing and formulation inputs, and then rechecking them through interviews and cross-metric reviews, the final number stays traceable and easier to replicate.


Key Questions Answered in the Report
What is the current value of the tablet coatings market?
The tablet coatings market is valued at USD 1.04 billion in 2026 and is projected to reach USD 1.33 billion by 2031.
Which coating type generates the highest revenue?
Film-coated tablets hold 52.74% of 2025 revenue, making them the leading coating type.
Why is Asia-Pacific considered pivotal for market growth?
Asia-Pacific commands 33.67% share and posts the fastest 7.72% CAGR due to aggressive pharmaceutical manufacturing expansion in India, China, and South Korea.
How are regulations influencing titanium dioxide usage?
The European Medicines Agency is assessing TiO2 safety, and potential restrictions are pushing formulators toward calcium-carbonate and polymeric opacifiers.
What drives the surge in continuous manufacturing adoption?
Regulatory incentives from the FDA, coupled with demonstrable cost and quality benefits, are accelerating the shift from batch to continuous coating lines.
Page last updated on:


 Your data is secure and never sold or shared.


