
Syringe Filling Machine Market Size and Share
Market Overview
| Study Period | 2020 - 2031 |
|---|---|
| Market Size (2026) | USD 2.09 Billion |
| Market Size (2031) | USD 2.99 Billion |
| Growth Rate (2026 - 2031) | 7.41 % |
| Fastest Growing Market | Asia Pacific |
| Largest Market | North America |
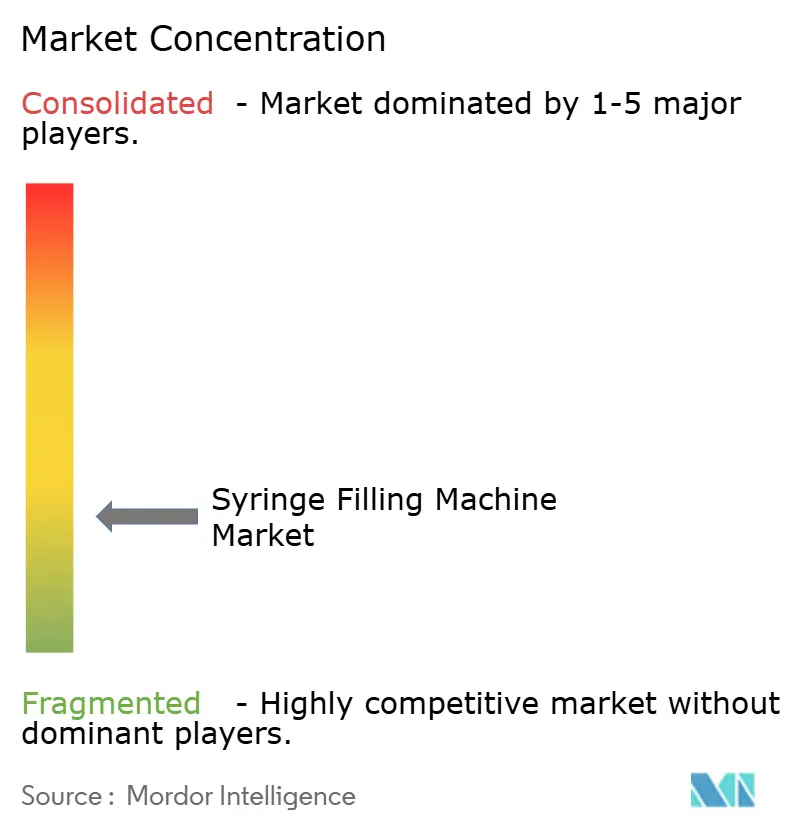
| Market Concentration | Low |
Major Players *Disclaimer: Major Players sorted in no particular order Image © Mordor Intelligence. Reuse requires attribution under CC BY 4.0. | |
Syringe Filling Machine Market Analysis by Mordor Intelligence
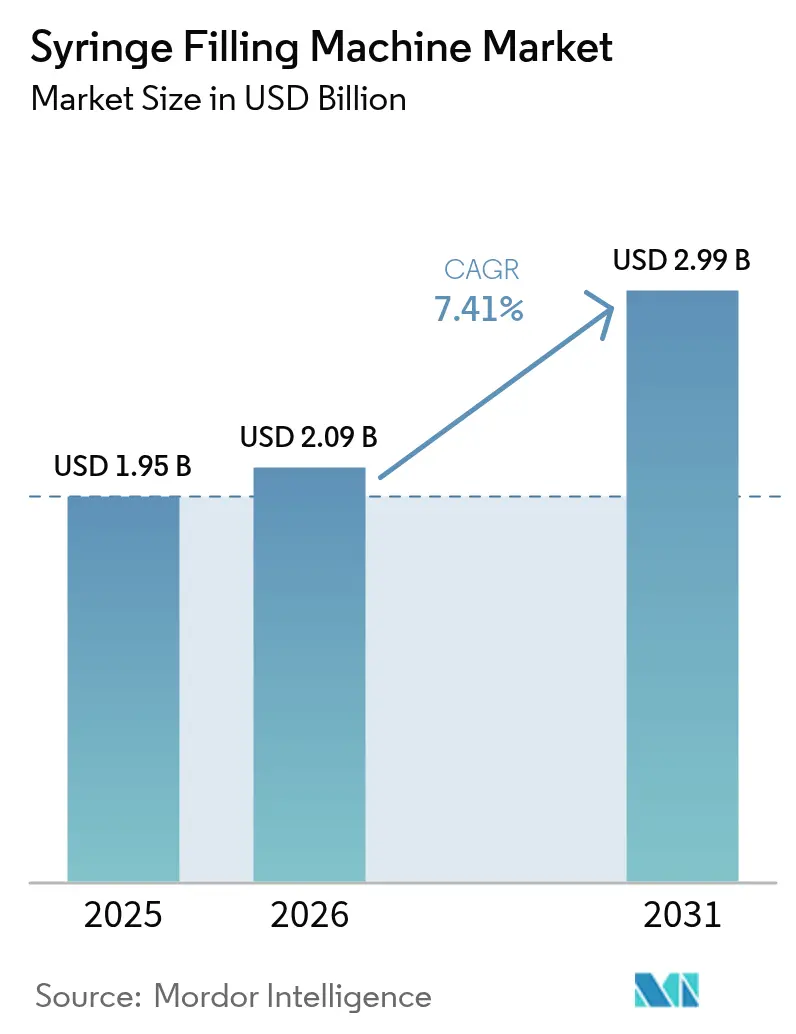
The syringe filling machine market size was valued at USD 1.95 billion in 2025 and estimated to grow from USD 2.09 billion in 2026 to reach USD 2.99 billion by 2031, at a CAGR of 7.41% during the forecast period (2026-2031). Growth is propelled by the pharmaceutical sector’s rapid embrace of automated aseptic processing in response to stricter global regulations and a swelling biologics pipeline that mandates precise, contamination-free filling. Investments in high-speed commercial systems, adoption of ready-to-use containers, and the expansion of contract manufacturing organizations continue to widen the syringe filling machine market’s addressable base. North American capacity expansions that answer quality concerns tied to imported syringes, Asia-Pacific regulatory harmonization, and hospital pharmacy automation further reinforce demand. At the same time, consolidation among leading vendors underscores the strategic importance of vertical integration, intellectual property, and service portfolios in defending competitive positions.
Key Report Takeaways
- By automation type, automated systems led with 63.92% syringe filling machine market share in 2025, while the same segment is advancing at 9.29% CAGR through 2031.
- By technology, servo-driven piston systems commanded 44.05% share of the syringe filling machine market size in 2025 and are expanding at 9.78% CAGR to 2031.
- By output capacity, high-speed systems (>18,000 SPH) held 28.12% share in 2025; mid-scale lines (6,001-18,000 SPH) are growing fastest at 7.88% CAGR through 2031.
- By end-user, pharmaceutical manufacturers accounted for 44.76% of the syringe filling machine market in 2025, whereas hospital and compounding pharmacies exhibit the highest growth at 10.16% CAGR to 2031.
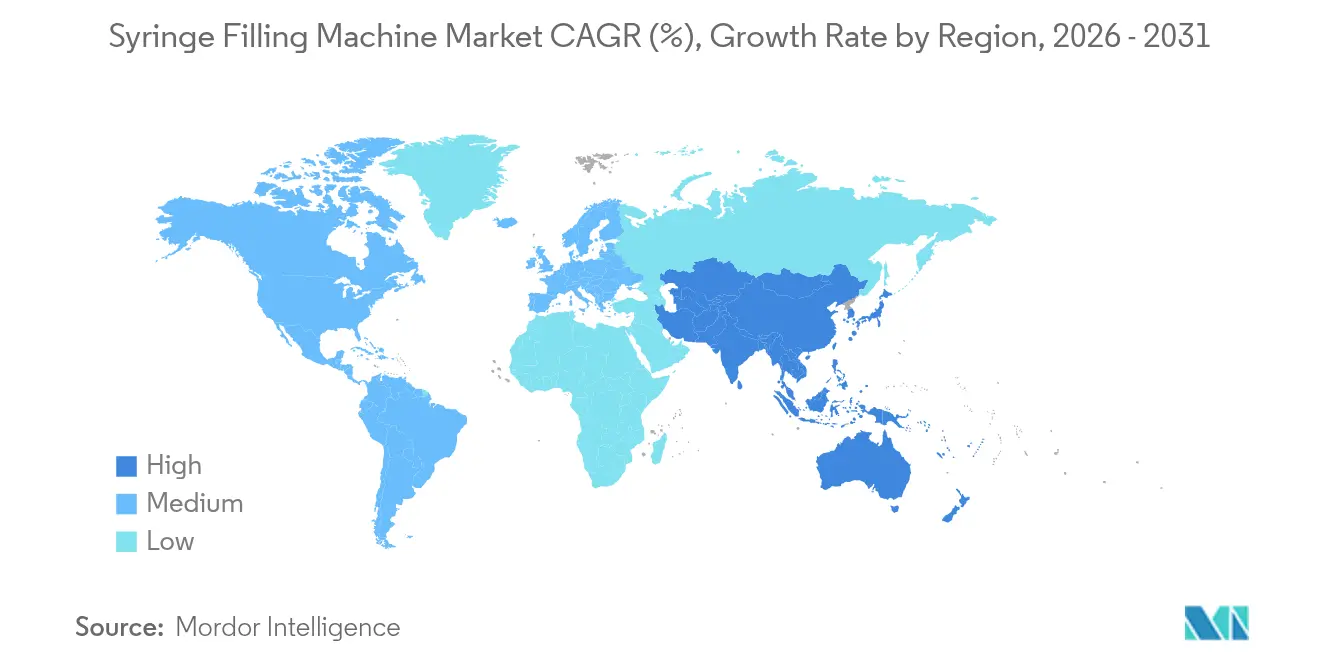
- By region, North America dominated with 42.35% share in 2025, while Asia-Pacific posts the strongest regional CAGR at 10.72% through 2031.
Note: Market size and forecast figures in this report are generated using Mordor Intelligence’s proprietary estimation framework, updated with the latest available data and insights as of 2026.
Market Trends and Insights
Drivers Impact Analysis of Syringe Filling Machine Market*
| Driver | (~) % Impact on CAGR Forecast | Geographic Relevance | Impact Timeline |
|---|---|---|---|
| Rising demand for pre-filled syringes | +1.8% | Global, with concentration in North America and Europe | Medium term (2-4 years) |
| Shift toward high-speed automated fill-finish lines for biologics | +1.5% | Global, Asia-Pacific core with spill-over to North America | Long term (≥ 4 years) |
| Adoption of ready-to-use (RTU) nested syringe formats | +1.2% | Europe and North America, expanding to Asia-Pacific | Medium term (2-4 years) |
| Stringent regulatory focus on aseptic accuracy | +1.0% | Global, with early implementation in EU and US | Short term (≤ 2 years) |
| Growing CMO outsourcing among small biotech firms | +0.8% | Global, with concentration in Asia-Pacific | Long term (≥ 4 years) |
| AI-driven predictive maintenance to cut downtime | +0.7% | North America and Europe, expanding globally | Medium term (2-4 years) |
| Source: Mordor Intelligence | |||
Rising Demand for Pre-filled Syringes
Elevated patient convenience, reduced contamination risk, and regulatory encouragement continue to shift injectable drug delivery toward pre-filled syringes. BD expanded Neopak XtraFlow glass syringe capacity sevenfold at Le Pont-de-Claix to support high-viscosity biologics, confirming soaring industrial uptake.[1]BD, “BD and Ypsomed Collaborate to Advance Self-Injection Systems for High-Viscosity Biologics,” news.bd.com Collaboration between BD and Ypsomed that marries XtraFlow syringes with autoinjectors underscores device-platform co-development. Equipment makers supplying servo-driven piston systems optimized for nested, pre-sterilized formats secure a meaningful advantage as manufacturers demand sterility assurance levels beyond traditional vial lines. The preference of hospital pharmacies for pre-filled units that simplify bedside administration further fuels the syringe filling machine market.
Shift Toward High-Speed Automated Fill-Finish Lines for Biologics
Biologics now represent one-fifth of pharmaceutical sales and require gentle, contamination-free handling. WuXi Biologics achieved 99.5% quality acceptance on Cytiva’s SA25 robotic workcell that fills vials, syringes, and cartridges in closed conditions. The emergence of large-volume subcutaneous injections up to 20 mL places a premium on volumetric accuracy over prolonged cycles. With contract manufacturers projected to hold 54% of global biologics capacity by 2028, versatile high-throughput systems that traverse multiple jurisdictions gain traction.
Adoption of Ready-to-Use (RTU) Nested Syringe Formats
EU GMP Annex 1 revisions highlight RTU containers as an effective contamination-control tool, prompting redesigns of fill-finish suites around pre-sterilized nest.[2]PDA, “GMP Annex 1 Implementation,” pda.org Syntegon’s MLD Advanced line handles RTU nests at 400 syringes per minute with no-touch transfer and integrated weighing for documentation. Groninger case studies show three-fold capacity gains for Merz Pharma after switching to flexfill RTU solutions. Reduced facility footprints and simplified validation make RTU technology attractive for smaller biotech firms with limited cleanroom real estate.
Stringent Regulatory Focus on Aseptic Accuracy
The EMA clarified maximum bioburden levels of 10 CFU/100 mL and endorsed rapid microbial methods, raising quantitative performance bars for filling lines. Real-time 5 μm particle monitoring in Grade A/B zones and FDA airflow velocity guidance compel equipment makers to boost environmental controls and data logging. Platforms embedding quality-risk-management modules and trend analytics satisfy the expanding documentation burden and secure faster approvals.
Restraints Impact Analysis of Syringe Filling Machine Market*
| Restraint | (~) % Impact on CAGR Forecast | Geographic Relevance | Impact Timeline |
|---|---|---|---|
| High capital expenditure and validation costs | -1.2% | Global, particularly impacting emerging markets | Short term (≤ 2 years) |
| Limited flexibility of legacy equipment | -0.8% | North America and Europe with aging infrastructure | Medium term (2-4 years) |
| Skilled-operator shortages in emerging markets | -0.6% | APAC core, spill-over to MEA and South America | Long term (≥ 4 years) |
| Sustainability pressure on single-use fluid paths | -0.4% | Europe and North America, expanding globally | Medium term (2-4 years) |
| Source: Mordor Intelligence | |||
High Capital Expenditure and Validation Costs
Modern syringe filling systems often exceed USD 2 million, and full validation can stretch 18 months, discouraging smaller firms. Argonaut Manufacturing Services allocated USD 45 million for a new Carlsbad aseptic facility,[3]Business Wire, “Argonaut Manufacturing Services Expands Aseptic Pharmaceutical Fill-Finish Capabilities,” via.ritzau.dk illustrating the financial weight of competitive entry. Rising raw-material prices—steel surpassing USD 800 per ton—and tariff impacts reported by West Pharmaceutical inflate project budgets. Cleanroom build-outs, personnel training, and digital documentation platforms further raise total cost of ownership.
Limited Flexibility of Legacy Equipment
Older vial-centric systems cannot accommodate RTU nests or high-viscosity biologics, forcing replacement or extensive retrofits. Hospital pharmacies that kept 14-year-old dispensing robots experienced escalating failures, prompting complete upgrades. Integration gaps between legacy hardware and modern quality-management software add compliance risk. Nordson’s portfolio reshuffle, including divestitures, highlights vendors’ need to focus on adaptable technologies.
*Our forecasts treat driver/restraint impacts as directional, not additive. The impact forecasts reflect baseline growth, mix effects, and variable interactions.
Syringe Filling Machine Market Segment Analysis
By Type:
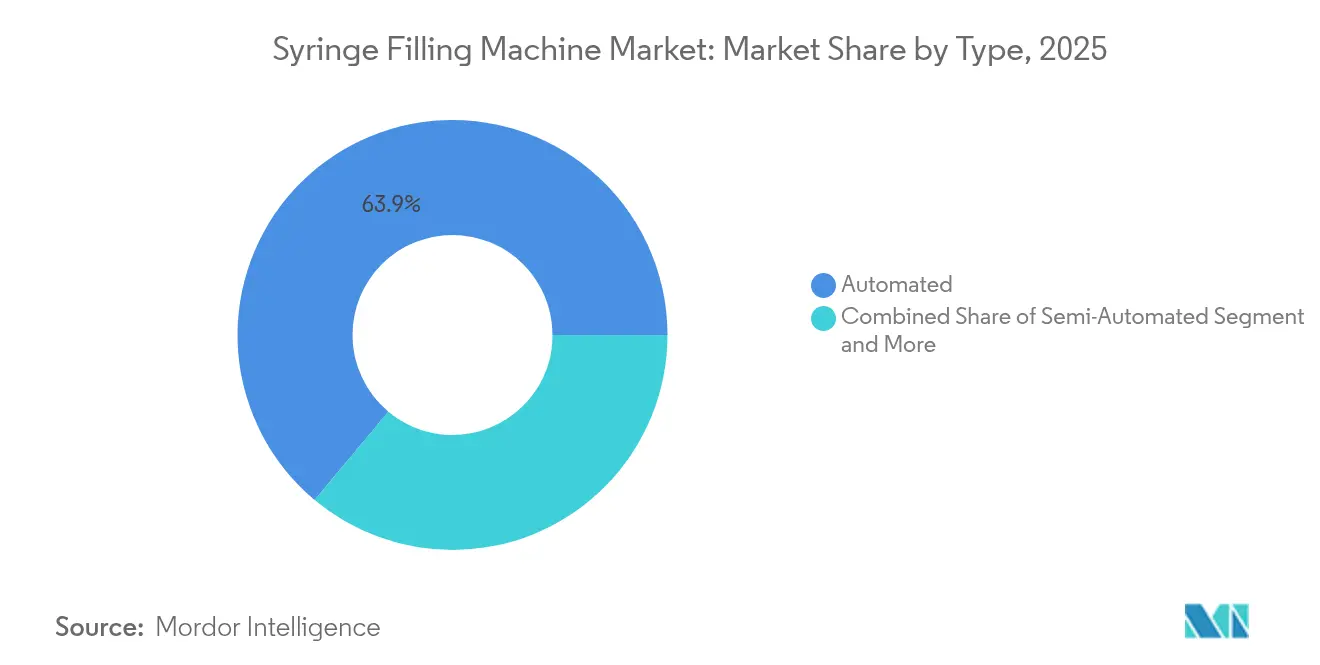
Automation Drives Market TransformationAutomated platforms accounted for 63.92% of the syringe filling machine market in 2025, and the segment is rising at 9.29% CAGR toward 2031 as regulators promote contamination-free processes. The convergence of high market share and high growth positions automation as the dominant paradigm. Manual and semi-automated setups persist where batch flexibility trumps throughput, yet their relevance diminishes in cGMP environments that increasingly favor enclosed, robotic modules.
Automation’s ascent is fueled by Annex 1 updates encouraging closed systems that curb human contact. Installations such as Cytiva’s SA25 workcells at WuXi Biologics achieve 99.5% acceptance, validating productivity and compliance benefits. Hospital pharmacies extend the same logic, adopting IntelliFill IV robots that slash medication-prep errors. As these gains become industry expectations, automated units cement their role in the syringe filling machine market.


By Technology:
Servo-Driven Systems Lead InnovationServo-driven piston technology controlled 44.05% of the syringe filling machine market size in 2025 and is advancing at 9.78% CAGR. Superior volumetric control across viscosities, especially for protein-rich biologics, drives adoption. Peristaltic pumps still serve shear-sensitive formulations, while time-pressure and gravity systems remain in legacy niches.
Syntegon’s MLD Advanced leverages servo precision to reach 400 syringes per minute and document every dispense for regulators. Nordson’s PICO Nexμs couples servo jets with predictive analytics, exemplifying convergence of mechanical accuracy and digital oversight. Patent filings describing dual-stage force profiles attest to continuous gains in servo actuation finesse.
By Output Capacity:
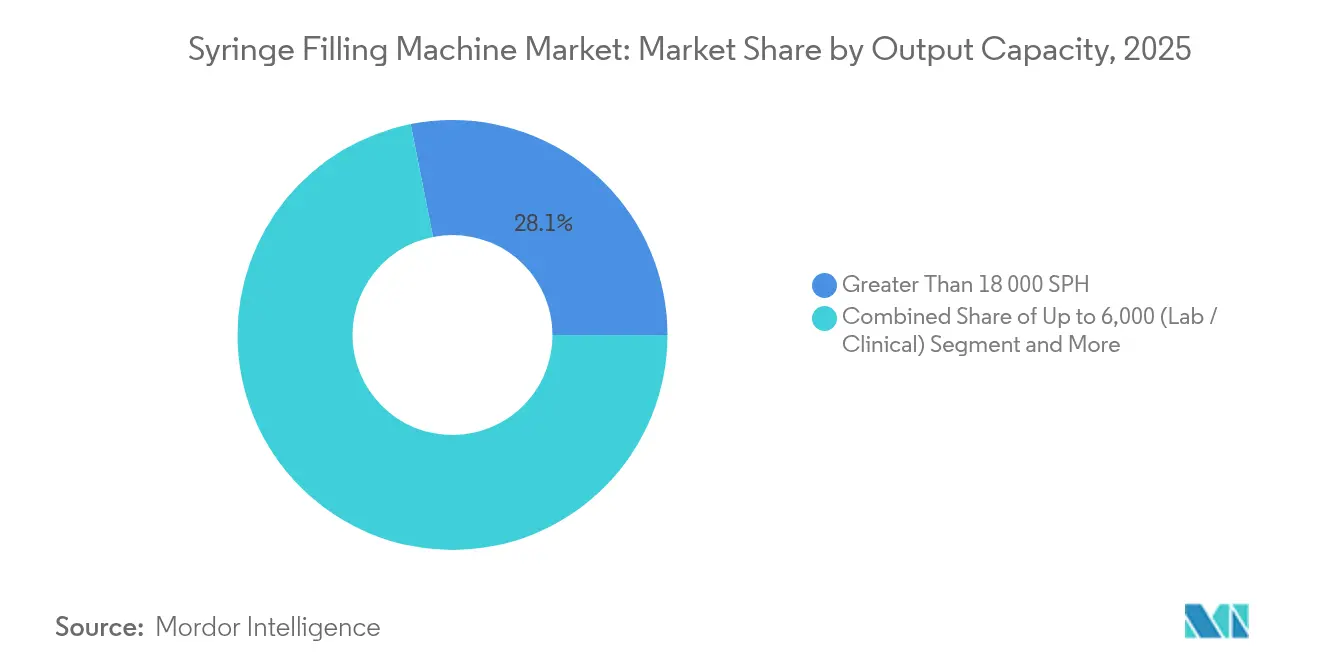
Mid-Scale Systems Gain MomentumHigh-speed lines exceeding 18,000 SPH held 28.12% market share in 2025. Yet mid-scale units (6,001-18,000 SPH) exhibit the fastest 7.88% CAGR as producers juggle commercial runs with smaller biologics batches. Lab-scale systems address early-stage research where volume requirements stay modest.
Vetter’s commercial line that fills 800 RTU syringes per minute under RABS demonstrates elevated output within a mid-scale footprint. Flexible design supports frequent format changes without prolonged downtime, matching evolving product portfolios. Hospitals deploy similar capacity in automated dispensing centers that handle thousands of doses daily, underscoring breadth of mid-scale demand.
By End-User:
Hospital Pharmacies Drive GrowthPharmaceutical manufacturers commanded 44.76% of the syringe filling machine market share in 2025, fortified by entrenched infrastructure and blockbuster pipelines. Nevertheless, hospital and compounding pharmacies grow quickest at 10.16% CAGR. Automation cuts labor costs, mitigates error, and complies with traceability mandates for compounded sterile preparations.
North Luxembourg hospital center captured EUR 4 million efficiency gains after adopting automated dispensing, demonstrating financial incentives. Helsinki University Hospital manages 80,000 SKUs using NewIcon Mega-Fixu, pairing real-time stock monitoring with GMP compliance. Vendors fine-tune interfaces and lot-tracking to hospital workflows, broadening penetration.
Geography Analysis
North America Syringe Filling Machine Market
North America retained 42.35% syringe filling machine market share in 2025 on the back of domestic capacity expansions and regulatory vigilance that favors local sourcing. BD’s boost to US syringe output responded directly to FDA warnings on imported devices, exemplifying policy-driven reshoring. Regional manufacturers such as Nordson pioneer predictive maintenance and Industry 4.0 features, embedding competitive technology advantages. Consolidation deals—Nordson’s USD 800 million Atrion purchase—indicate available capital and strategic drive for portfolio depth.
Europe Syringe Filling Machine Market
Europe maintains significant presence through regulatory leadership. Annex 1 revisions guide global aseptic norms, and equipment makers like Syntegon tailor offerings to ready-to-use requirements, achieving 400-unit-per-minute outputs while satisfying no-touch imperatives. Nipro’s investment in its Münnerstadt plant widens European PFS supply and emphasizes sustainable practices such as energy-efficient washing lines. Digital twin projects backed by ISPE and EU research grants illustrate the region’s innovation ecosystem.
APAC Syringe Filling Machine Market
Asia-Pacific is the fastest-growing territory at 10.72% CAGR to 2031. China’s NMPA standards YY 1001-2024 frame stringent syringe quality metrics, fostering domestic demand for compliant. WuXi Biologics achieved GMP release just 15 months after purchasing the SA25 workcell, underscoring regional execution speed. Samsung Biologics and Daiichi Sankyo headline multibillion-dollar expansions that will anchor 45% of global biologics capacity in Asia by 2028. Coupled with government incentives, these investments cement Asia-Pacific as a pivotal hub for the syringe filling machine market.

Regulatory Landscape
Regulation shaping syringe filling machine design and validation is anchored in aseptic manufacturing rules for sterile medicinal products, alongside harmonized quality-management expectations for combination products and device components. In Europe, EudraLex Volume 4 GMP Annex 1 (2022 revision) frames contamination-control execution and pushes fill-finish operations toward barrier technology, closed processing, and documented environmental monitoring.
In the United States, FDA oversight applies to both drug fill-finish and device-related submissions, as well as quality systems, which influences how syringe filling lines are specified, validated, and audited. FDA guidance for 510(k) submissions for piston syringes informs device-side documentation and performance expectations for syringe components used in combination presentations, while the QMSR aligns 21 CFR Part 820 with ISO 13485:2016, tightening supplier controls and risk management practices that flow through OEM and CDMO equipment purchases.
Competitive Landscape
Market fragmentation coexists with mounting consolidation. Technology differentiation, regulatory proficiency, and service breadth outweigh pure manufacturing scale. BD’s USD 4.2 billion acquisition of Edwards Lifesciences’ Critical Care division reinforces vertical integration aimed at supplying devices, disposables, and filling solutions under one roof. Syntegon focuses on RTU equipment while Cytiva advances robotic workcells that deliver near-perfect acceptance rates, highlighting specialization paths.
Patent activity clusters around servo actuation and single-use module design, illustrating a pipeline of incremental but commercially relevant innovations. Mid-market players leverage niche expertise—for example, Groninger’s flexfill systems—to capture biotech and hospital contracts where agility trumps volume. Meanwhile, automation suppliers like ARxIUM and NewIcon address downstream hospital needs, expanding the competitive arena beyond traditional pharmaceutical equipment vendors.
Strategic partnerships proliferate as firms seek complete solutions. BD collaborates with Ypsomed on high-viscosity autoinjectors, merging container science with delivery technology. IMA Group’s Sarong acquisition augments thermoforming and suppository capabilities that complement fill-finish lines. The fluid competitive landscape rewards companies that integrate digital analytics, RTU compatibility, and service contracts to deepen customer lock-in.
Syringe Filling Machine Industry Leaders
Nordson Corporation
Romaco Group
Added Pharma B.V.
OPTIMA packaging group GmbH
Automated Systems of Tacoma (AST)
- *Disclaimer: Major Players sorted in no particular order
Syringe Filling Machine Market Companies Covered in this Report
- Maquinaria Industrial Dara, S.L.
- Vanrx Pharmasystems (Cytiva)
- Nordson Corporation
- Musashi Engineering, Inc.
- I.M.A. Industria Macchine Automatiche S.p.A.
- Romaco Group
- Added Pharma B.V.
- Automated Systems of Tacoma (AST)
- Shenzhen Penglai Industrial Corp. Ltd.
- OPTIMA Packaging Group GmbH
- Prosys Innovative Packaging Equipment
- Syntegon Technology GmbH
- Becton, Dickinson & Company (BD)
- Groninger & Co. GmbH
- Marchesini Group S.p.A.
- Robert Bosch Manufacturing Solutions GmbH
- Steriline S.r.l.
- Coesia S.p.A.
- Stäubli International AG
- Shenghi Machinery Co., Ltd.
- Datwyler Holding Inc.
- Accutek Packaging Equipment
- TurboFil Packaging Machines
- Vetter Pharma-Fertigung GmbH & Co. KG

Market Opportunities and Future Outlook
Replacement and upgrade cycles are emerging as a near-term opportunity tied to Annex 1 contamination-control strategy requirements and the broader shift toward barrier-based, closed aseptic processing. That dynamic is pulling through demand for RTU-nest capable platforms, isolator and RABS-compatible designs, and integrated environmental monitoring with data-logging packages, especially for biologics and higher-viscosity formulations. Suppliers that can deliver validated, multi-format lines (vials, syringes, cartridges) with documented no-touch transfer and in-process controls have a clearer path as manufacturers standardize fill-finish suites around reduced human intervention.
A second opportunity is capacity buildout in the US for sterile fill-finish and drug-device delivery, pairing filling with downstream assembly for pre-filled syringes and safety devices. In April 2026, PCI Pharma Services announced an investment program exceeding USD 1 billion to expand US sterile fill-finish and combination capabilities, including autoinjector lines and pre-filled syringe safety device assembly infrastructure in Philadelphia, Pennsylvania and Rockford, Illinois, reflecting capital deployment by CDMO-scale buyers. This supports demand for modular syringe filling machines that can be integrated with device-assembly workflows, electronic documentation, and supplier-quality controls aligned with FDA QMSR and ISO 13485, extending the addressable market beyond standalone filling into end-to-end combination-product manufacturing cells.
Recent Industry Developments in Syringe Filling Machine Market
- April 2026: PCI Pharma Services announced an expansion program backed by investments exceeding USD 1 billion to grow US sterile fill-finish and drug-device delivery combination capabilities, including autoinjector lines and pre-filled syringe safety device assembly infrastructure in Philadelphia, Pennsylvania and Rockford, Illinois. The scale and combination-product focus increases demand for integrated fill-finish and assembly-ready equipment configurations, benefiting suppliers with RTU syringe handling, barrier integration, and documentation-centric automation.
- May 2025: Syntegon launched the MLD Advanced filling machine tailored for RTU nested syringes, emphasizing high-throughput, no-touch handling with integrated weighing for documentation. The launch reinforces competitive pressure to pair RTU compatibility with in-line controls that support sterility assurance and batch-record readiness.
- February 2025: Argonaut Manufacturing Services announced expansion of aseptic fill-finish capacity at its Carlsbad facility. The project indicates ongoing demand for validated syringe-capable lines and integrated process controls across CDMO suppliers.


Syringe Filling Machine Market Report Scope and Research Methodology
Market Definition and Coverage
This market covers revenue generated from syringe filling machines used to dose and fill liquid or semi-liquid drug products into syringes in controlled manufacturing settings. Coverage includes manual, semi-automatic, and automatic systems sold to pharma, biotech, and related operators.
Scope exclusions: We exclude general-purpose liquid filling machines that are not designed for syringe formats, along with vial and ampoule filling lines.
Segments Covered in This Report
- By Type
- Automated
- Semi-Automated
- Manual / Benchtop
- By Technology
- Servo-driven Piston
- Peristaltic Pump
- Time-Pressure / Volumetric
- Vacuum / Gravity
- By Output Capacity (Syringes per hour)
- Up to 6,000 (Lab / Clinical)
- 6,001 - 18,000 (Mid-scale)
- Above 18,000 (Commercial High-speed)
- By End-user
- Pharmaceutical Manufacturing Companies
- Biotechnology Companies
- Contract Development and Manufacturing Organizations (CDMOs)
- Hospital and Compounding Pharmacies
- By Geography
- North America
- United States
- Canada
- Mexico
- Europe
- Germany
- France
- United Kingdom
- Italy
- Spain
- Russia
- Netherlands
- Switzerland
- Rest of Europe
- Asia-Pacific
- China
- Japan
- India
- South Korea
- Australia
- Indonesia
- Thailand
- Malaysia
- Rest of Asia-Pacific
- Middle East and Africa
- Middle East
- Saudi Arabia
- United Arab Emirates
- Turkey
- Rest of Middle East
- Africa
- South Africa
- Egypt
- Nigeria
- Kenya
- Rest of Africa
- Middle East
- South America
- Brazil
- Argentina
- Colombia
- Rest of South America
- North America
Data Sources, Market Sizing, and Validation
Desk Research
Desk work starts by mapping the demand environment around prefilled syringes and injectable drugs, then translating it into equipment needs and replacement cycle assumptions. We use public sources such as US FDA databases and guidance, the European Medicines Agency, CDC vaccination information, and UN Comtrade trade statistics for machinery and pharmaceutical flows. We also review peer-reviewed papers on aseptic processing and packaging.
To convert this context into a practical market model, we review company annual reports, investor presentations, and press releases tied to new fill-finish capacity. We also use association material from pharma packaging and aseptic manufacturing bodies.
Paid subscriptions are used as supporting inputs, mainly to confirm company financials, strengthen shipment-level import-export visibility for relevant machinery categories, and cross-check patent databases and contract or tender signals. These sources help confirm where projects are actually moving. These examples are illustrative, and many other public and paid sources were also consulted for data collection, validation, and clarification.
Primary Interviews and Surveys
Primary work is used to pressure test what desk research cannot fully pin down, especially average selling price ranges, typical line throughput choices, and the share of orders going to new builds versus upgrades. We speak with a spread of machine makers, integrators, fill-finish users, and quality and validation professionals across APAC, EMEA, and the Americas so assumptions are checked from more than one side of the buying process.
Distribution of primary research fieldwork respondents
| Company type | Respondent position | Region |
|---|---|---|
| Top tier: 33% | CXOs: 18% | APAC: 47% |
| Mid tier: 49% | Functional/Unit leaders: 26% | EMEA: 29% |
| Smaller Players: 18% | Managers: 56% | Americas: 24% |
Market-Sizing & Forecasting
Sizing is built using a top-down approach where fill-finish capacity expansion plans, installed base replacement behavior, and injectable drug production signals are translated into an equipment demand pool by region. We then corroborate totals with selective bottom-up approximations, such as sampled line quotations, typical machine configurations by throughput band, and reasonableness checks using supplier revenue splits where these are disclosed.
Key inputs that shape the model include prefilled syringe adoption trends, new aseptic line announcements, and output capacity choices across lab and clinical versus mid-scale versus commercial high-speed operations. We also track technology preference shifts, for example peristaltic pump versus servo-driven piston, and we use observed lead times to estimate when revenue is recognized. Since price points can move with automation level and the scope of validation, gaps are handled by using ASP ranges from interviews, then applying conservative mixes by region and end user before final totals are set.
For forecasting, we use scenario analysis with a central case anchored on announced capacity additions and a paced normalization of project timing. Assumptions are rechecked with experts to keep the near-term and mid-term slope realistic. Where signals conflict, the forecast is tied to observable indicators, and then qualitative expectations such as regulatory tightening and biologics pipeline growth are layered on.
Data Validation & Update Cycle
Outputs are validated through multiple cross-checks, including comparing implied machine demand against visible fill-finish project counts, trade flow direction, and capacity utilization narratives from public disclosures. Variances are reviewed, and any outliers trigger a second look at the driver inputs, followed by peer review before final numbers are completed.
The report follows an annual refresh cycle, and interim updates are made when material events occur, such as major plant launches, large order wins, or regulation changes that shift qualification intensity. Before delivery, we do a final pass on currency conversion timing, inflation assumptions, and key multipliers so clients receive the most current view available at the time of publication.
Mordor Intelligence's Syringe Filling Machine Market Size Measured Against Other Published Estimates
Published market sizes for syringe filling machines often vary because the boundary around what counts as a syringe-dedicated system is not always the same, and because some studies treat project timing and pricing differently. The spread usually increases when automation levels are mixed without a clear method, or when currency conversion timing is not aligned to the same reference period.
Key gap drivers in this market tend to be whether manual and semi-automatic units are included, how high-speed commercial lines are counted when they are sold as part of a broader fill-finish suite, and how ASPs are trended as validation and compliance requirements rise. A refresh-led process that rechecks FX timing and revalidates ASP bands with recent quotations, which is then applied in Mordor Intelligence, can also land on a different number than estimates that hold older price points or shift revenues earlier based on announced projects.
Benchmark comparison
| Source | Market Size | Gaps in Research Methodology |
|---|---|---|
| Mordor Intelligence | USD 2.09 B (2026) | |
| Industry Publisher A | USD 0.44 B (2025) | Uses a narrower revenue pool that appears to focus on syringe-specific units and certain capacity bands, which can leave out parts of high-speed commercial systems and related automation sold as integrated projects. |
| Global Publisher B | USD 1.38 B (2025) | Anchors the model on a different base year and growth window and may apply a different ASP progression and project timing logic, which shifts how upgrades and new line build-outs are recognized in market value. |
The table shows that most of the difference comes from scope boundaries and timing, rather than disagreement on demand direction. When scope is kept consistent around syringe-dedicated equipment and pricing is updated using current validation-driven configuration mixes, the market total becomes easier to trace back to clear volume and price inputs, and it stays repeatable year to year.


Key Questions Answered in the Report
What is the current size of the syringe filling machine market?
The syringe filling machine market stands at USD 2.09 billion in 2026 and is projected to reach USD 2.99 billion by 2031.
Which automation type holds the largest share?
Automated syringe filling systems lead with 63.92% share in 2025 and continue to grow rapidly at 9.29% CAGR.
Why are servo-driven piston machines in high demand?
They deliver precise volumetric control across a wide viscosity range, commanding 44.05% market share in 2025 and growing at 9.78% CAGR.
Which region is expanding fastest?
Asia-Pacific posts the highest regional CAGR at 10.72% through 2031 on the back of regulatory harmonization and large capacity expansions.
Page last updated on:


 Your data is secure and never sold or shared.


