
Synthetic Latex Polymers Market Size and Share
Market Overview
| Study Period | 2020 - 2031 |
|---|---|
| Market Size (2026) | USD 39.89 Billion |
| Market Size (2031) | USD 46.34 Billion |
| Growth Rate (2026 - 2031) | 3.04 % |
| Fastest Growing Market | Middle East and Africa |
| Largest Market | Asia Pacific |
| Market Concentration | Medium |
Major Players *Disclaimer: Major Players sorted in no particular order Image © Mordor Intelligence. Reuse requires attribution under CC BY 4.0. | |
Synthetic Latex Polymers Market Analysis by Mordor Intelligence
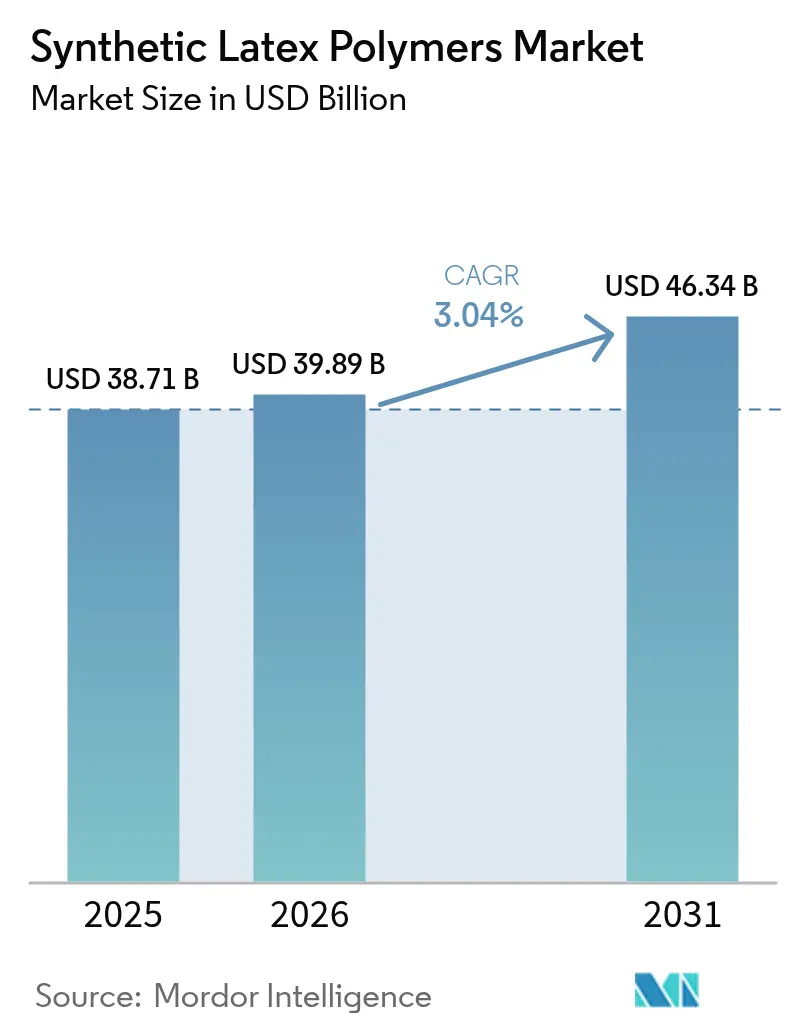
The synthetic latex polymers market size in 2026 is estimated at USD 39.89 billion, growing from 2025 value of USD 38.71 billion with 2031 projections showing USD 46.34 billion, growing at 3.04% CAGR over 2026-2031. A mix of regulatory mandates and performance-driven reformulations underpins this growth, as end users pivot to water-based systems that align with volatile organic compound limits and emerging sustainability targets. Construction programs in emerging economies, rising demand for low-VOC architectural coatings, and incremental medical uptake keep volumes expanding, even as certain mature applications such as carpet backing plateau in North America and Europe. Competitive intensity now centers on sustainable feedstocks, circular economy credentials, and supply security, with global players pursuing bio-based chemistries and plant modernization to safeguard margins. At the same time, regional champions leverage integrated feedstocks and customer proximity to defend share in price-sensitive segments, preserving a dynamic yet increasingly compliance-oriented competitive landscape.
Key Report Takeaways
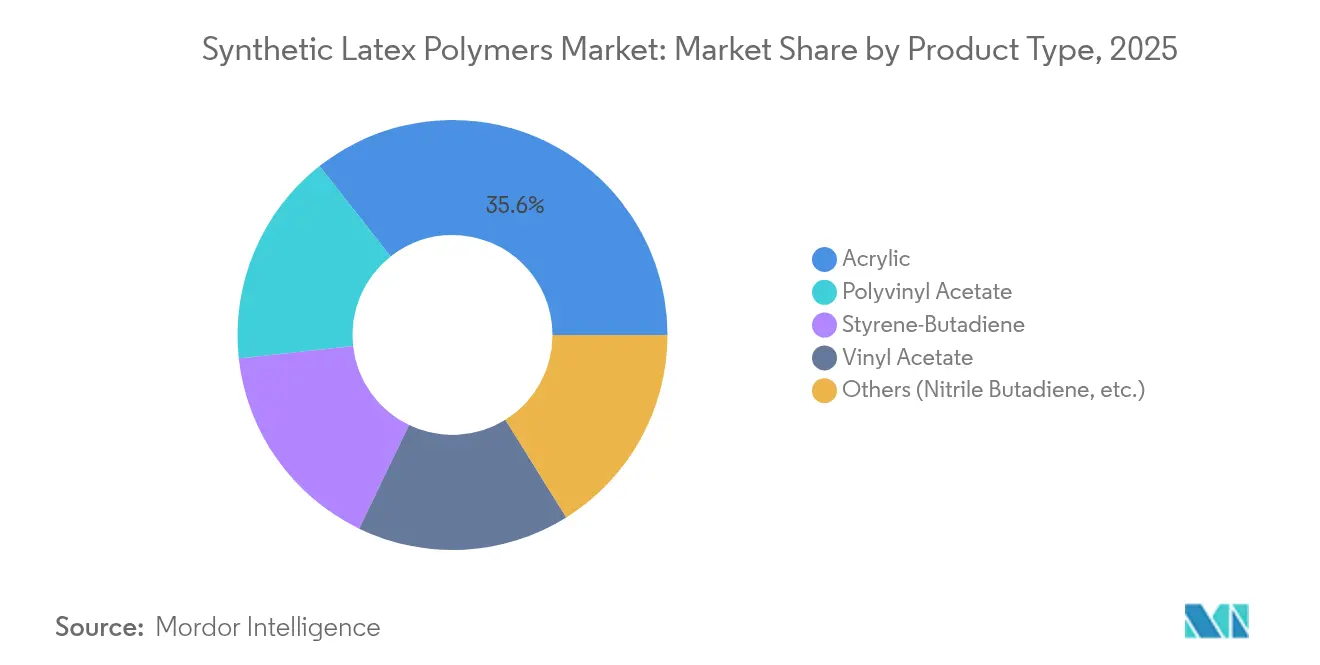
- By polymer type, acrylics captured 35.62% of the synthetic latex polymers market share in 2025; the same polymer group is set to register a 3.42% CAGR through 2031.
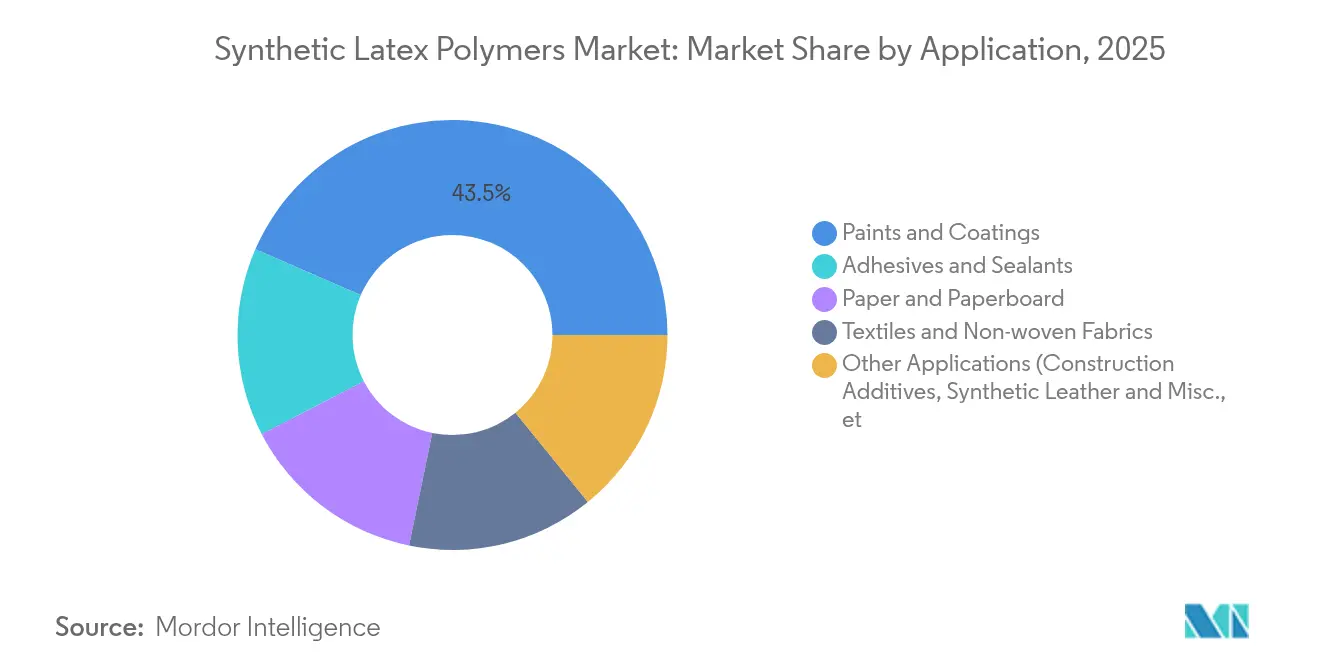
- By application, the paints and coatings application segment accounted for a significant revenue share of 43.47% in 2025. It is projected to grow at a CAGR of 3.88% through 2031, emerging as the fastest-growing segment in the industry.
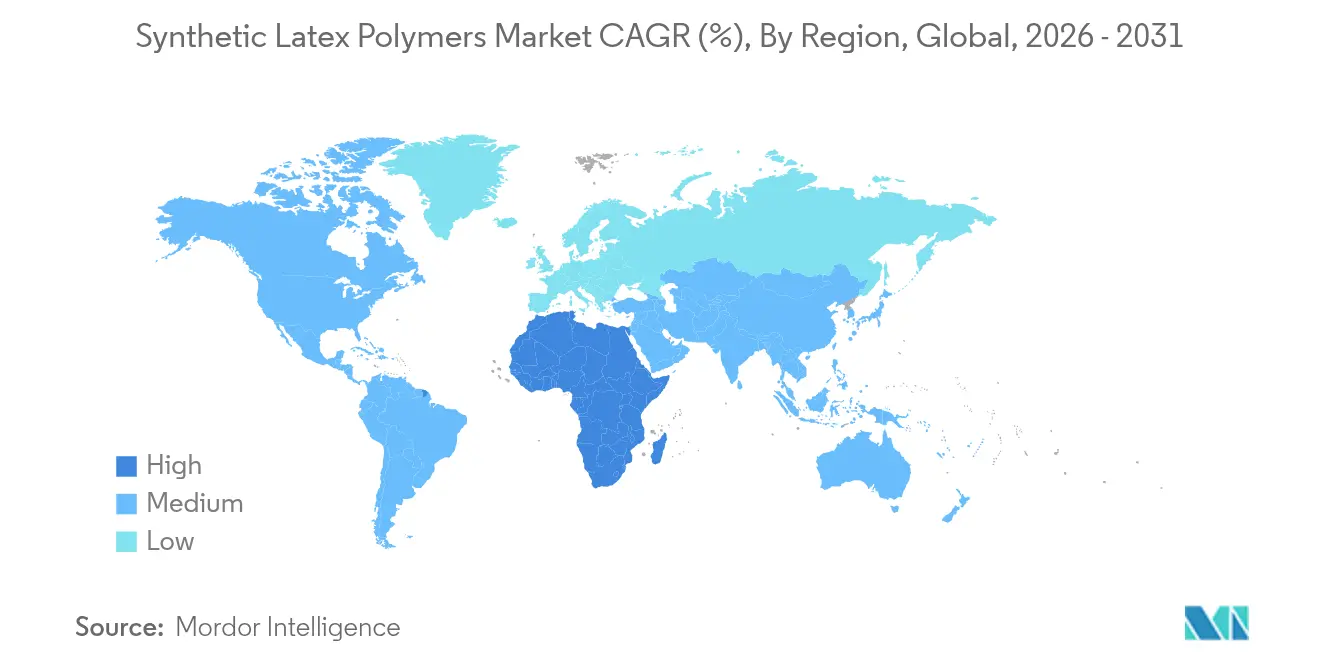
- By geography, Asia-Pacific accounted for 48.10% of the synthetic latex polymers market size in 2025, whereas the Middle East and Africa region is advancing at a 4.05% CAGR to 2031.
Note: Market size and forecast figures in this report are generated using Mordor Intelligence’s proprietary estimation framework, updated with the latest available data and insights as of 2026.
Market Trends and Insights
Drivers Impact Analysis of Synthetic Latex Polymers Market*
| Driver | (~) % Impact on CAGR | Geographic Relevance | Impact Timeline |
|---|---|---|---|
| Rising demand from paints & coatings industry | +1.2% | Global, led by APAC & North America | Medium term (2-4 years) |
| Construction boom driving adhesives & sealants usage | +0.8% | APAC core, spill-over to MEA | Medium term (2-4 years) |
| VOC regulations favouring synthetic latex over solvent systems | +0.6% | North America & EU, expanding to APAC | Long term (≥ 4 years) |
| Increasing utilization in medical and healthcare application | +0.3% | Global, led by North America & Europe | Long term (≥ 4 years) |
| 3-D printable concrete admixtures using latex for rheology | +0.1% | North America & Europe, pilot APAC | Long term (≥ 4 years) |
| Source: Mordor Intelligence | |||
Rising Demand from Paints & Coatings Industry
Architectural reformulations continue to accelerate uptake in the synthetic latex polymers market as coating makers align with VOC caps that now range from 50 g/L to 250 g/L in jurisdictions such as California’s South Coast AQMD Rule 1168[1]. Global suppliers respond with next-generation acrylic dispersions, typified by BASF’s 2025 industrial portfolio, which eliminates reportable VOCs and integrates bio-based feedstock while retaining film strength and weatherability. A widening gap between solvent and water-based systems reinforces the long-term shift toward synthetic latex, particularly in interior architectural finishes where odor, drying time, and indoor-air benchmarks converge.
Construction Boom Driving Adhesives & Sealants Usage
Emerging-market infrastructure cycles sustain another pillar of growth for the synthetic latex polymers market. Saudi Arabia’s Vision 2030 blueprint, for example, doubles national petrochemical capacity to more than 140 million tons by 2030 and prioritizes specialty polymers geared to construction chemistry. Public procurement rules echo this direction: Washington State DOT 2024 specifications require latex-modified concrete overlays on critical bridge decks, guaranteeing baseline demand for styrene-butadiene dispersions.
VOC Regulations Favouring Synthetic Latex Over Solvent Systems
Rulemaking bodies worldwide continue to tighten the compliance vise on solvent emissions, further cementing the synthetic latex polymers market trajectory. The US EPA’s 2024 Hazardous Air Pollutant amendment alone removes 6,230 tons of HAPs per year at an industry cost of USD 193 million, accelerating substitution to water-based latex dispersions[2]. Parallel initiatives in California’s Consumer Products Regulation and Maricopa County’s ozone plan demonstrate regulatory harmonization, while EPDLA’s position paper underscores five decades of solvent-free performance within European polymer dispersions[3]. Collectively, these mandates reduce formulation latitude for solvent chemistries and channel capital toward advanced latex plants.
Increasing Utilization in Medical and Healthcare Applications
Healthcare conversion gathers pace as device makers prioritize biocompatibility and traceability in glove, catheter, and film applications. Health Canada’s 2025 adoption of ISO 11193-1 for medical gloves formalizes performance rules that favor synthetic nitrile and polychloroprene latex over natural rubber for allergy risk mitigation. Research paths are widening as antimicrobial latex grades and biodegradable fillers enter the pipeline, positioning suppliers with regulatory expertise and specialty compounding capacity for incremental share capture.
Restraints Impact Analysis of Synthetic Latex Polymers Market*
| Restraint | (~) % Impact on CAGR | Geographic Relevance | Impact Timeline |
|---|---|---|---|
| Raw-material (butadiene) cost volatility | -0.7% | Global, APAC & North America prominent | Short term (≤ 2 years) |
| Carpet demand decline in developed markets | -0.4% | North America & Europe | Medium term (2-4 years) |
| C4 refinery shutdowns limiting butadiene supply | -0.3% | Global supply chains, regional variations | Short term (≤ 2 years) |
| Source: Mordor Intelligence | |||
Raw-Material (Butadiene) Cost Volatility
Butadiene swings continue to squeeze latex margins. Q1 2025 spot prices reacted sharply to soft automotive tire demand and selective cracker turnarounds. The American Chemistry Council estimates styrene-butadiene latex consumes 8% of total butadiene, exposing producers to every upstream rally. Further pressure stems from LyondellBasell’s review of European olefin assets, which clouds forward supply visibility.
Carpet Demand Decline in Developed Markets
Residential carpet is losing floor share to resilient and hard-surface options. Mohawk Industries reports accelerated investment in recycled-content rigid core lines and PVC-free variants, signaling a structural reset that directly trims latex-backing volumes. Textile Exchange notes global polyester output climbed to 71 million t in 2023, but most incremental tonnage funnels into apparel and technical textiles rather than tufted carpet. North American and European latex suppliers must therefore pivot to higher-growth uses such as architectural coatings or technical non-wovens.
*Our forecasts treat driver/restraint impacts as directional, not additive. The impact forecasts reflect baseline growth, mix effects, and variable interactions.
Synthetic Latex Polymers Market Segment Analysis
By Polymer Type:
Acrylic Leadership Anchored by Compliance EdgeAcrylics hold 35.62% of the synthetic latex polymers market share in 2025 and are expanding at a 3.42% CAGR, reinforced by excellent film-forming, weather resistance, and low-VOC compliance. Within the broader synthetic latex polymers market size, acrylic dispersions routinely serve as the default binder in premium zero-odor wall paints that meet indoor-air programs such as LEED and BREEAM. Suppliers also advance self-crosslinking technology that boosts scrub resistance without external coalescents. Styrene-butadiene grades remain competitive in paper, carpet, and cementitious admixtures because of favorable cost-performance ratios, yet the segment must navigate feedstock volatility. Vinyl acetate and polyvinyl acetate niches persist in woodworking and textile finishing where flexibility outweighs water-whitening concerns. Nitrile butadiene latex commands loyal demand in protective gloves due to chemical resistance and puncture strength. Government research grants, typified by the USD 51 million Sustainable Polymers Tech Hub in Akron, aim to commercialize bio-based butadiene, ultimately reshuffling cost structures and carbon metrics across polymer types.
Acrylic dominance looks durable, although incremental innovation will likely unfold along bio-acrylic monomers, recyclability, and circular feedstock sourcing. As regulations tighten microplastic release and carbon disclosure, the superior compliance record of acrylics positions them to preserve leadership, while producers of styrene-heavy chemistries may invest in hybrid formulations or mass-balance certification to stay relevant.

By Application:
Paints & Coatings Sustain OutperformanceThe paints & coatings segment commands 43.47% of the synthetic latex polymers market in 2025 and is set to climb at a 3.88% CAGR through 2031, outpacing overall market growth. That dominance arises from enduring construction activity, interior air-quality codes, and homeowner preference for quick-drying low-odor finishes. The segment also exemplifies tighter alignment between performance and sustainability: producers deploy high-solids latex, low surfactant residues, and biocide-optimized packages to curb lifecycle emissions. Adhesives & sealants usage mirrors infrastructure outlays, especially in Asia-Pacific roadways and Middle East megaprojects. Paper & paperboard coatings face substitution pressure from biolatex blends that can replace up to 75% of synthetic latex in certain gloss grades, yet the hybrid approach may still lock in a baseline binder demand. Technical textiles and non-wovens rise on back of single-use medical drapes and filtration media, both under scrutiny for recyclability. Emerging 3-D printing admixtures, though nascent, embody the next specialty frontier, capitalizing on latex capability to tune rheology for layered deposition in automated construction yards.
Geography Analysis
APAC Synthetic Latex Polymers Market
Asia-Pacific holds 48.10% of the synthetic latex polymers market size in 2025, reflecting its deep manufacturing base, abundant labor, and rapid urbanization. China drives a large portion of regional coating and adhesive consumption, even as plant rationalizations and ethane-based feedstock shifts redefine competitiveness in petrochemicals. India adds momentum through public housing schemes and expanding packaging demand for e-commerce. Still, the region’s growth curve is flattening as installed capacity catches up with prior surges and as ESG auditing gains traction among multinational buyers, favoring suppliers that can document low carbon intensity and circular practices.
MEA Synthetic Latex Polymers Market
The Middle East & Africa currently contributes a smaller volume but is the fastest mover, with a 4.05% CAGR anticipated to 2031. Gulf Cooperation Council economies bankroll mega-infrastructure under Vision 2030, underpinned by competitive feedstock and integrated refinery-to-polymer complexes. Saudi Arabia’s plan to more than double petrochemical output to 140 million t annually underscores commitment to downstream value capture, including synthetic latex raw materials Cross-border partnerships—such as the Sadara venture between Saudi Aramco and Dow—reinforce scale and market access.
North America and Europe Synthetic Latex Polymers Market
North America and Europe represent mature demand centers where the synthetic latex polymers market is shaped more by regulation than volume spikes. The US Department of Energy calculates that the chemicals and refining segment requires USD 90-120 billion in decarbonization investment by 2030, prodding latex producers to green electricity, heat integration, and mass-balance certified feedstocks. Europe follows a similar path, embedding polymer taxation, extended producer responsibility, and zero-pollution roadmaps into industrial policy. Suppliers with legacy solvent footprints face the most significant transformation costs, while integrated players redirect R&D to bio-acrylics, mechanical recycling, and emission-free drying ovens.
Regulatory Landscape
Regulation continues to favor water-borne latex binders over solvent systems as authorities tighten controls on VOCs and other air pollutants. In the United States, VOC limits that can range from 50 g/L to 250 g/L in California jurisdictions (for example, South Coast AQMD Rule 1168 for adhesives and sealants) reinforce reformulation toward aqueous dispersions across coatings and related uses. In parallel, the US EPA has advanced hazardous air pollutant rulemaking that supports lower-emitting process and formulation choices.
In Europe, microplastics policy is becoming a compliance driver for latex and dispersion value chains. Commission Regulation (EU) 2023/2055 introduced restrictions on synthetic polymer microparticles from October 2023 with phased obligations, and Commission Regulation (EU) 2026/1168 further amends REACH Annex XVII. Reporting requirements for industrial downstream users handling relevant synthetic polymer microparticles begin with 2026 activity, increasing documentation needs across pellets, flakes, and powders and shaping material selection, labeling, and supplier qualification in dispersion-linked applications.
Value Chain Analysis
The value chain starts with petrochemical and increasingly renewable feedstocks (styrene, butadiene, acrylic and vinyl acetate monomers), which then move through emulsion polymerization into bulk latex shipments (totes, drums, bulk) for formulators in paints and coatings, adhesives and sealants, paper coatings, and textiles and non-wovens. Upstream volatility in C4 streams and butadiene availability remains a key bottleneck for styrene-butadiene latex, while compliance requirements and customer audits drive producers to tighten traceability, product stewardship, and lot-to-lot quality.
Recent moves also point to more integration and certification across the chain. In February 2025, Synthomer established an ISCC PLUS certified value chain for bio-based nitrile latexes with Neste and PCS Pte. Ltd., showing how mass-balance and certified renewable inputs are being operationalized from feedstock through finished latex. Technology access further shapes competitiveness: in 2025, Synthomer partnered with Lummus Technology to license acrylic acid esters technology, broadening raw-material flexibility, including bio-based options, and supporting manufacturing footprints closer to major coatings and adhesives demand centers.
Competitive Landscape
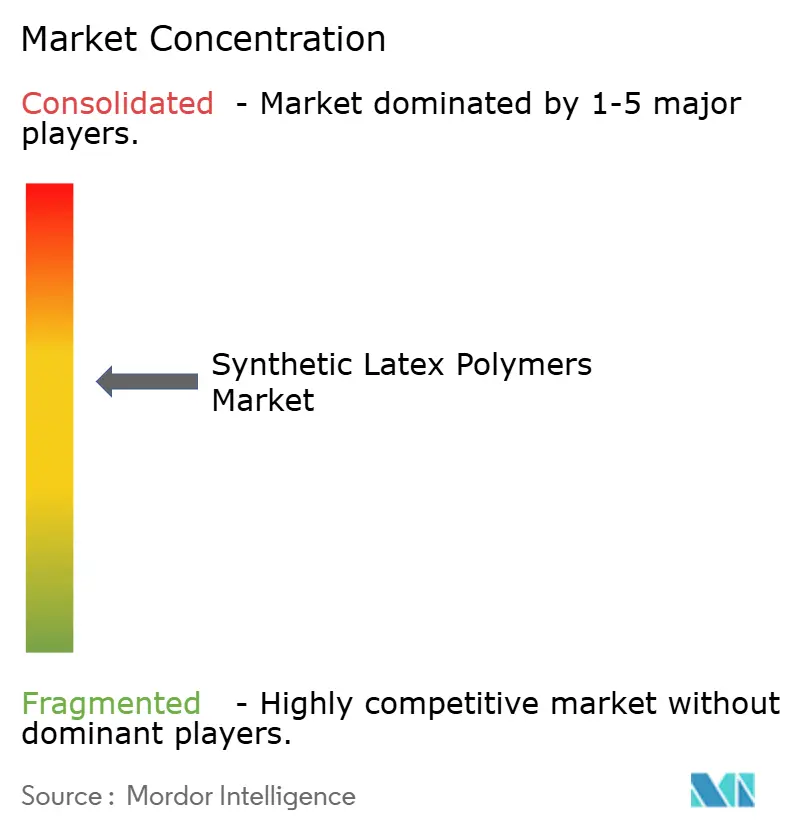
The synthetic latex polymers market exhibits moderate consolidation among the top 5 players. Prominent companies such as BASF, Dow, Arkema, and LyondellBasell are strategically aligning their operations by leveraging integrated production capabilities and making targeted investments. These actions are driven by the need to adapt to evolving regulations and shifting customer preferences. The nature of competition has transitioned, with a greater emphasis on technological advancements rather than cost leadership. Consequently, compliance with regulatory standards has become a fundamental prerequisite for market entry rather than a competitive differentiator. Simultaneously, regional participants like Kumho Petrochemical, LANXESS, and ZEON Corporation are establishing specialized niches by utilizing their technical expertise and fostering strong customer relationships within specific application areas or regions.
Synthetic Latex Polymers Industry Leaders
-
Dow
-
Matco Chemicals Group
-
Arkema
-
BASF
-
Kumho Petrochemical
- *Disclaimer: Major Players sorted in no particular order
Synthetic Latex Polymers Market Companies Covered in this Report
- Apcotex
- Arkema
- ARLANXEO
- Ashland
- BASF
- DIC Corporation
- Dow
- Jubilant Agri and Consumer Products Limited (JACPL)
- Kumho Petrochemical
- LANXESS
- LG Chem
- Lion Elastomers
- Matco Chemicals Group
- SIBUR
- Sumitomo Chemical Advanced Technologies
- ZEON CORPORATION
Market Opportunities and Future Outlook
Certified low-carbon and bio-attributed latexes are creating a clearer whitespace, particularly for customers working to meet VOC constraints and tightening procurement scrutiny on traceability. Synthomer’s February 2025 ISCC PLUS certified value chain for bio-based nitrile latexes (with Neste and PCS Pte. Ltd.) provides a concrete template for producers to differentiate on chain-of-custody credentials while maintaining drop-in performance for medical and industrial applications.
Medical and hygiene-related synthetic latex capacity additions and product introductions also point to near-term addressable demand for protein-free alternatives. Cariflex’s Jurong Island project in Singapore shifted from operations (November 2024) to an official inauguration in May 2025 after a USD 355 million investment, highlighting continued spending on polyisoprene latex used in gloves and other medical products. In parallel, published 2026 research on degradable latex routes via scalable emulsion polymerization outlines a path for specialty grades where end users are looking for improved end-of-life options, building alongside ongoing shifts toward water-based systems in coatings and adhesives.
Recent Industry Developments in Synthetic Latex Polymers Market
- April 2026: INTCO Medical expanded its non-latex glove portfolio with the launch of Syntex Synthetic Latex Gloves and Synmax Pro Gloves. The introductions target protein-free synthetic alternatives. They reinforce downstream demand signals for synthetic latex materials in medical and protective applications and shape qualification pipelines for latex suppliers serving glove ecosystems.
- June 2025: Zeon Corporation announced an expansion program for high-grade solution-polymerised styrene-butadiene rubber (S-SBR) capacity at its Singapore site, Zeon Chemicals Singapore Pte Ltd (ZCS), with test production preceding full operations in 2026 and combined annual capacity reaching 125,000 tonnes. The expansion supports regional supply of high-performance styrenic elastomers used in demanding applications. It can also affect competitive positioning in Asia-centered value chains.
- March 2024: Arlanxeo announced plans to build a hydrogenated nitrile butadiene rubber (HNBR) plant in Changzhou, China, with a nameplate capacity of 5,000 tons per year and a first phase of 2,500 tons annually. The investment adds local specialty elastomer capability for higher-performance, chemical-resistant applications. It also strengthens supply security for customers sourcing nitrile-based materials.
Synthetic Latex Polymers Market Report Scope and Research Methodology
Market Definition and Coverage
This market is defined as the sales value of synthetic latex polymers supplied as waterborne polymer emulsions or dispersions, which are used as binders and performance additives across downstream manufacturing uses.
Scope exclusions: Natural rubber latex, silicone dispersions, and finished compounded goods such as ready mixed paints and formulated adhesive pastes are excluded from this sizing.
Segments Covered in This Report
- By Polymer Type
- Styrene-Butadiene
- Acrylic
- Vinyl Acetate
- Polyvinyl Acetate
- Others (Nitrile Butadiene, etc.)
- By Application
- Paints and Coatings
- Adhesives and Sealants
- Paper and Paperboard
- Textiles and Non-woven Fabrics
- Other Applications (Construction Additives, Synthetic Leather and Misc., etc.)
- By Geography
- Asia-Pacific
- China
- India
- Japan
- South Korea
- Rest of Asia-Pacific
- North America
- United States
- Canada
- Mexico
- Europe
- Germany
- United Kingdom
- France
- Italy
- Rest of Europe
- South America
- Brazil
- Argentina
- Rest of South America
- Middle East and Africa
- Saudi Arabia
- South Africa
- Rest of Middle East and Africa
- Asia-Pacific
Data Sources, Market Sizing, and Validation
Desk Research
Desk work starts by mapping how these latexes move from monomers into finished dispersions, then into the key consuming industries, so we do not count downstream products twice. For baseline signals, we use public statistics such as USGS chemical and mineral data where it aligns with latex related input streams, US Census Bureau manufacturing and trade tables for regional output and trade direction, UN Comtrade for import and export direction, and Eurostat industrial production series to support volume patterns by region.
To keep assumptions grounded, we review sources such as company annual reports and investor presentations, environmental agency publications on VOC rules and waterborne adoption, and peer reviewed journal articles on emulsion polymerization and end use performance. For cross checks, paid subscriptions for company financials and intelligence are used where available, alongside patent databases and shipment level import export datasets when coverage is meaningful. The sources listed here are illustrative only, and many other public documents and datasets are also reviewed during data collection and validation.
Primary Interviews and Surveys
Primary discussions are used to pressure test the demand pool for major consuming industries and to refine the splits by latex chemistry and end use, because public statistics rarely match the exact product boundary used in this study. We speak with manufacturers, distributors, formulators, and large end users across APAC, EMEA, and the Americas, and then re contact sources when a variable such as pricing or operating rates changes materially.
Distribution of primary research fieldwork respondents
| Company type | Respondent position | Region |
|---|---|---|
| Top tier: 30% | CXOs: 13% | APAC: 45% |
| Mid tier: 53% | Functional/Unit leaders: 43% | EMEA: 30% |
| Smaller Players: 17% | Managers: 44% | Americas: 25% |
Market-Sizing & Forecasting
Sizing is built using a top-down structure where production and trade signals are used to reconstruct the regional availability of synthetic latex dispersions, then aligned to end use demand indicators. Once the market total is assembled, selective bottom-up checks are applied using sampled supplier revenue footprints, channel discussions, and a price times volume sanity check for large applications.
Inputs that are tracked include waterborne coatings output trends, construction activity indicators that influence architectural coatings and sealants, paper and packaging coating volumes, nonwoven production trends, and the direction of key monomer pricing that feeds through to latex average selling prices. Because realized prices can move differently by chemistry and region, we use scenario analysis for forecast building and then select the most probable path based on what industry experts expect for capacity utilization, substitution toward water based systems, and regulation driven adoption. Where supplier level detail is incomplete, gaps are handled by applying conservative coverage factors that are reviewed in interviews and then re tested against trade and production statistics.
Data Validation & Update Cycle
Validation is done by triangulating the model output against independent signals such as trade flows, downstream output trends, and known capacity changes, then checking for unusual jumps that cannot be explained by price or volume movements. When a variance is spotted, the assumptions are revisited and, if needed, a short follow up call is done to confirm what changed in the real market.
Before sign off, the work goes through multi step analyst reviews where calculations, unit conversions, and currency timing are checked, followed by a final consistency pass across regions and applications. Reports are refreshed annually, and interim updates are triggered when major events occur, such as sharp raw material price shifts or large capacity additions. Right before delivery, the dataset is re checked so clients receive the latest updated view.
Mordor Intelligence's Synthetic Latex Polymers Market Size Compared With Other Published Estimates
Published market values for synthetic latex polymers can differ even when the topic name looks the same, because sources may not count the same product forms, years, or pricing points. Differences also show up when one estimate leans more on demand indicators and another leans more on broader chemical totals.
Finished formulated paints and adhesive pastes are kept outside Mordor Intelligence's scope, which reduces double counting that can happen when downstream goods are mixed with producer level latex shipment value. Other gaps usually come from how average selling prices are trended (spot monomer swings versus contract pass through), whether trade is netted out cleanly by region, and how often the model is refreshed when capacity utilization changes.
Benchmark comparison
| Source | Market Size | Gaps in Research Methodology |
|---|---|---|
| Mordor Intelligence | USD 39.89 B (2026) | |
| Industry Publisher A | USD 40.60 B (2024) | Uses a different base year and may apply faster price progression through the forecast window, which can lift the starting value if producer prices are assumed to recover quickly after raw material swings. |
| Industry Publisher B | USD 39.70 B (2024) | Long forecast horizon can embed a higher growth trajectory, and the scope language suggests broad aqueous dispersions that may not be consistently separated from adjacent water based polymer categories in country level rollups. |
The comparison shows that the spread is mainly explained by year selection, how pricing is carried forward, and whether downstream goods or adjacent dispersions get mixed into the same bucket. By keeping the scope tied to factory supplied latex dispersions and by cross checking totals against trade and demand signals, we keep a traceable number that can be repeated with the same inputs next year.
Key Questions Answered in the Report
What is the current Synthetic Latex Polymers Market size?
The market stands at USD 39.89 billion in 2026 and is forecast to climb to USD 46.34 billion by 2031 at a 3.04% CAGR.
Which application segment leads demand?
Paints & coatings dominate with 43.47% revenue share in 2025, driven by low-VOC architectural coatings and steady construction activity.
Which region grows the fastest over the forecast period?
The Middle East & Africa region advances at a 4.05% CAGR through 2031 on the back of Vision 2030 infrastructure and petrochemical capacity expansion.
How does regulation influence market growth?
Tightening VOC and hazardous pollutant standards worldwide accelerate the shift to water-based latex systems, adding roughly 0.6 percentage points to forecast CAGR.