
Market Overview
| Study Period | 2020 - 2031 |
|---|---|
| Forecast Data Period | 2026 - 2031 |
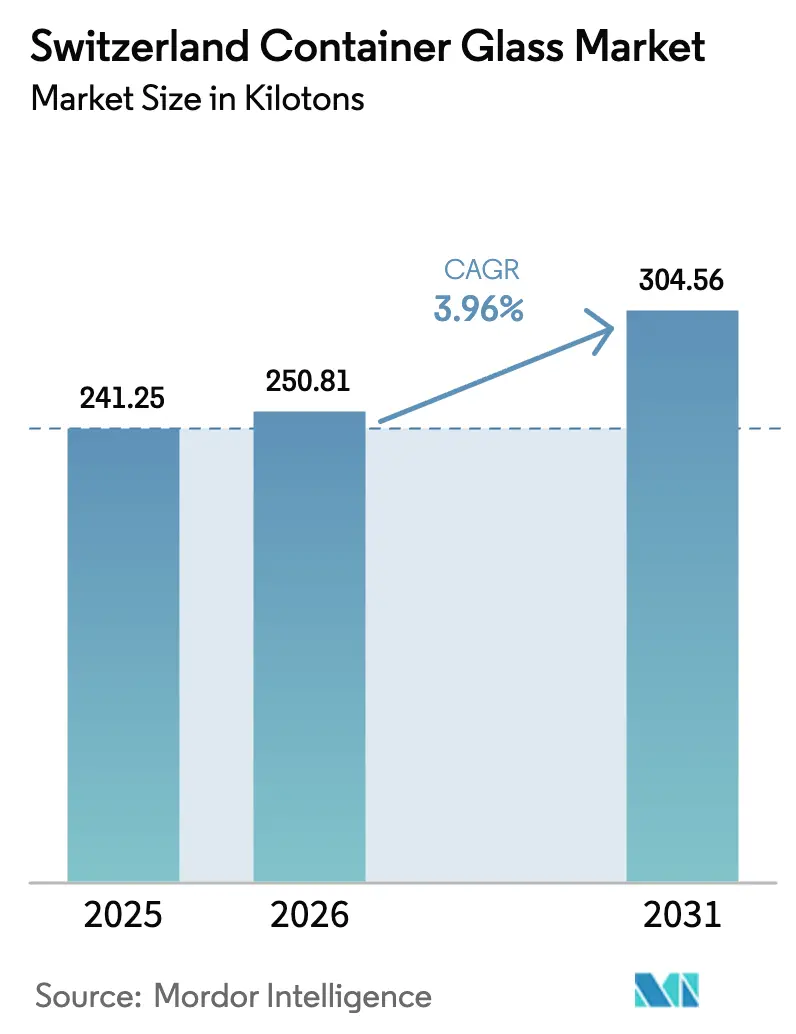
| Base Year Market Size (2025) | 241.25 kilotons |
| Market Volume (2026) | 250.81 kilotons |
| Market Volume (2031) | 304.56 kilotons |
| Growth Rate (2026 - 2031) | 3.96 % |
| Market Concentration | Medium |
Major Players *Disclaimer: Major Players sorted in no particular order Image © Mordor Intelligence. Reuse requires attribution under CC BY 4.0. | |
Switzerland Container Glass Market Analysis by Mordor Intelligence
The Switzerland container glass market size in 2026 is estimated at 250.81 kilotons, growing from 2025 value of 241.25 kilotons with 2031 projections showing 304.56 kilotons, growing at 3.96% CAGR over 2026-2031. Demand is concentrated in beverages, pharmaceuticals, cosmetics, and premium food, while a 97% national recycling rate supplies an abundant supply of cullet, reducing energy needs and reinforcing Switzerland’s leadership in the circular economy.[1]VetroSwiss, “Recycling,” vetroswiss.ch Regulatory alignment with the forthcoming EU Packaging and Packaging Waste Regulation targets, a rising preference for returnable bottles, and ongoing lightweighting innovations provide domestic producers with a structural cost offset against Switzerland’s elevated energy and labor expenses. Furthermore, the Switzerland container glass market benefits from premium brand strategies, as luxury beverages and biologics rely on glass for product integrity, shelf appeal, and regulatory compliance. Consolidation, most recently, Vetropack’s St-Prex closure, reduces overcapacity and sharpens focus on technically advanced, higher-margin applications.
Key Report Takeaways
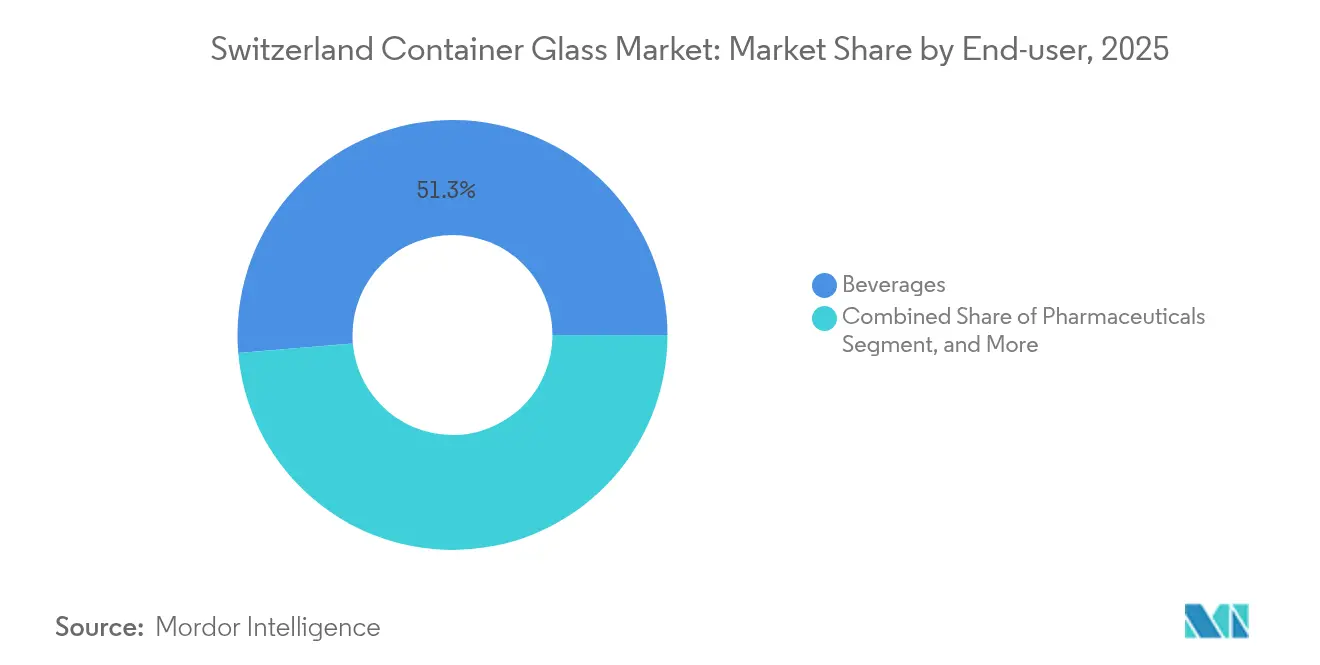
- By end-user, beverages accounted for 51.34% of the Swiss container glass market share in 2025.
- By color, the Switzerland container glass market size for the amber segment is projected to grow at a 4.98% CAGR between 2026-2031.
Note: Market size and forecast figures in this report are generated using Mordor Intelligence’s proprietary estimation framework, updated with the latest available data and insights as of 2026.
Switzerland Container Glass Market Trends and Insights
Drivers Impact Analysis*
| Driver | (~) % Impact on CAGR Forecast | Geographic Relevance | Impact Timeline |
|---|---|---|---|
| Rising demand for sustainable and recyclable packaging | +1.2% | Switzerland and DACH region | Medium term (2-4 years) |
| Premium packaging trends boosting glass container adoption | +0.8% | Switzerland; luxury markets in EU | Short term (≤ 2 years) |
| Government regulations supporting recycling and circular economy | +0.7% | Switzerland; EU alignment | Long term (≥ 4 years) |
| Urbanization increasing packaged goods consumption rates | +0.5% | Swiss urban centers; cross-border regions | Medium term (2-4 years) |
| Pharmaceutical sector growth driving glass container usage | +0.6% | Switzerland; global pharma hubs | Long term (≥ 4 years) |
| Technological advancements improving lightweight glass production | +0.3% | Global; Swiss manufacturing focus | Long term (≥ 4 years) |
| Source: Mordor Intelligence | |||
Rising Demand for Sustainable and Recyclable Packaging
Accelerating corporate commitments to net-zero supply chains elevates glass above single-use plastics in the Switzerland container glass market. A 97% collection rate yields cullet fractions of up to 80% in furnace feed, reducing energy consumption and CO₂ emissions, which align with brand scorecards at Nestlé and Givaudan. Swiss consumers demonstrate a strong willingness to pay premiums for demonstrably circular packaging, allowing producers to pass through higher electricity costs without sacrificing their margins. VetroSwiss’s nationwide collection network supplies a reliable domestic cullet stream, insulating manufacturers from the volatility of imported raw materials. Regulatory momentum behind Extended Producer Responsibility in Switzerland and the EU adds further lift, embedding glass in long-term compliance roadmaps. Together, these factors anchor a virtuous loop of demand, recycling, and reinvestment that sustains above-average growth for the Switzerland container glass market.
Premium Packaging Trends Boosting Glass Container Adoption
The premiumization wave sweeping through Swiss alcoholic beverages and craft food products remains a potent force. Coca-Cola HBC Switzerland increased returnable-glass output by 22% in 2023, as on-premise channels favored upscale presentation and circular logistics.[2]Coca-Cola HBC, “Sustainability-Packaging,” coca-colahellenic.com Spirits and winery brands repositioned flagship SKUs in bespoke flint and emerald bottles to accentuate provenance, reinforcing glass as the material of choice for high-margin line extensions. In parallel, the growth of biologics raises specifications for prefilled syringes, stimulating pharmaceutical demand for borosilicate and amber formats. Vetropack’s Echovai technology demonstrates that lightweight bottles can cut material intensity without compromising aesthetics, aligning luxury cues with environmental goals. These converging drivers increase the average revenue per ton and strengthen the Swiss container glass market against low-cost imports.
Government Regulations Supporting Recycling and Circular Economy
Switzerland’s Beverage Container Ordinance mandates closed-loop collection metrics that glass already surpasses, supporting its entrenched role in national waste-management infrastructure. Draft EU rules targeting a 90% beverage-container collection rate and minimum recycled-content thresholds confer a first-mover advantage to Swiss producers when exporting into the single market. Disclosure obligations on lifecycle carbon push retailers toward materials with transparent, data-rich recycling records an attribute that glass satisfies through long-standing traceability practices. VetroSwiss and industry partners provide standardized reporting templates that reduce administrative burdens for brand owners, further solidifying the glass industry. Looking forward, the certainty offered by aligned Swiss-EU regulation reduces investment risk, catalyzing furnace upgrades and fueling a consistent 4.01% CAGR in the Switzerland container glass market.
Pharmaceutical Sector Growth Driving Glass Container Usage
Home to Basel’s life-sciences cluster and global contract manufacturers, Switzerland relies on glass to ensure drug stability and compliance with EMA and FDA guidelines. SCHOTT Pharma expanded its Swiss R&D hub to tackle prefilled syringe innovation, underscoring the shift toward high-value, small-batch biologic therapies that demand Type I borosilicate containers. Growth in autoinjectors and cartridge-based delivery systems pushes specifications beyond the limits of plastics’ barrier properties, favoring glass for its inertness and control over leachables. Although Gerresheimer’s 2025 guidance flagged destocking, secular demand is expected to return as pipeline biologics enter late-stage trials. Local sourcing preferences rooted in supply-chain resilience amplify opportunities for Swiss converters able to validate ISO 15378 clean-room credentials. Consequently, pharma’s 5.69% CAGR cements it as the primary driver of growth within the Swiss container glass market.
Restraints Impact Analysis*
| Restraint | (~) % Impact on CAGR Forecast | Geographic Relevance | Impact Timeline |
|---|---|---|---|
| High production costs limit glass container expansion | -0.9% | Switzerland, high-cost European markets | Short term (≤ 2 years) |
| Fragility of glass complicates logistics and transportation | -0.4% | Switzerland, export-dependent markets | Medium term (2-4 years) |
| Environmental impact of glass production remains significant | -0.3% | Switzerland, EU carbon regulation zones | Long term (≥ 4 years) |
| Competition from plastics and metals restricts growth | -0.6% | Global, with focus on cost-sensitive applications | Medium term (2-4 years) |
| Source: Mordor Intelligence | |||
High Production Costs Limit Glass Container Expansion
Furnace operations rely on uninterrupted energy flows, and Swiss spot electricity prices averaged 33% above the EU mean in 2024, further tightening margins even after accounting for renewable-power credits. Vetropack’s shutdown of St-Prex reflects the unavoidable economics of a domestic cost base, where labor and environmental levies outpace those of its neighbors. Capital-intensive rebuilds, typically USD 40 million per furnace, heighten financing hurdles for midsize players. Currency appreciation further compresses export competitiveness in commodity SKUs, prompting buyers to opt for lower-cost French and Italian imports. Together, these headwinds shave 0.9 percentage points off the Switzerland container glass market CAGR during the near term.
Fragility of Glass Complicates Logistics and Transportation
Weight and breakage risks exacerbate fulfillment costs in Switzerland’s export-oriented economy. Multimodal routes to Germany and France expose pallets to multiple touchpoints, raising insurance and wastage charges that erode the glass cost proposition compared with PET. E-commerce penetration intensified the challenge as direct-to-consumer formats require secondary protection layers, inflating dimensional weight fees. Bucher Emhart Glass’ 37.7% decline in order intake in 1H 2024 signals producer caution toward new capacity, while logistics remain a constraint. Although lightweighting mitigates some issues, switching a legacy line demands furnace redesign and tooling outlays, barriers that small firms struggle to cross. These factors trim a further 0.4 percentage points from the overall Switzerland container glass market expansion.
*Our forecasts treat driver/restraint impacts as directional, not additive. The impact forecasts reflect baseline growth, mix effects, and variable interactions.
Segment Analysis
By End-User: Pharmaceuticals Drive Premium Growth
Pharmaceutical applications, which account for only 11.28% of the 2025 volume, are on track for a 5.46% CAGR, outpacing the pace of beverages and unlocking steady share gains in the Swiss container glass market size. Demand focuses on Type I borosilicate vials, cartridges, and syringes, where extractable thresholds and thermal-shock resistance are critical. Swiss biologics pipelines, spanning oncology and personalized vaccines, rely on ready-to-fill formats that command pricing multiples of commodity beverage bottles. SCHOTT Pharma’s investments reinforce local competencies, giving Swiss assemblers rapid prototyping support and regulatory documentation for EMA filings.
Beverages, anchored by wine, beer, and premium mineral water, retained 51.34% of Switzerland's container glass market share in 2025, underpinned by returnable schemes and the proliferation of craft products. Coca-Cola HBC’s shift into 200 ml and 330 ml refillable SKUs broadens addressable volume. Non-alcoholic categories are gaining traction through health-conscious formulations, packaged in flint glass to highlight natural ingredients. Cosmetics and specialty foods round out consumption, leveraging glass to reinforce prestige branding and clean-label cues. Overall, cross-segment diversification provides a ballast against beverage cyclicality and sustains the Switzerland container glass market.


By Color: Amber Growth Reflects Pharmaceutical Expansion
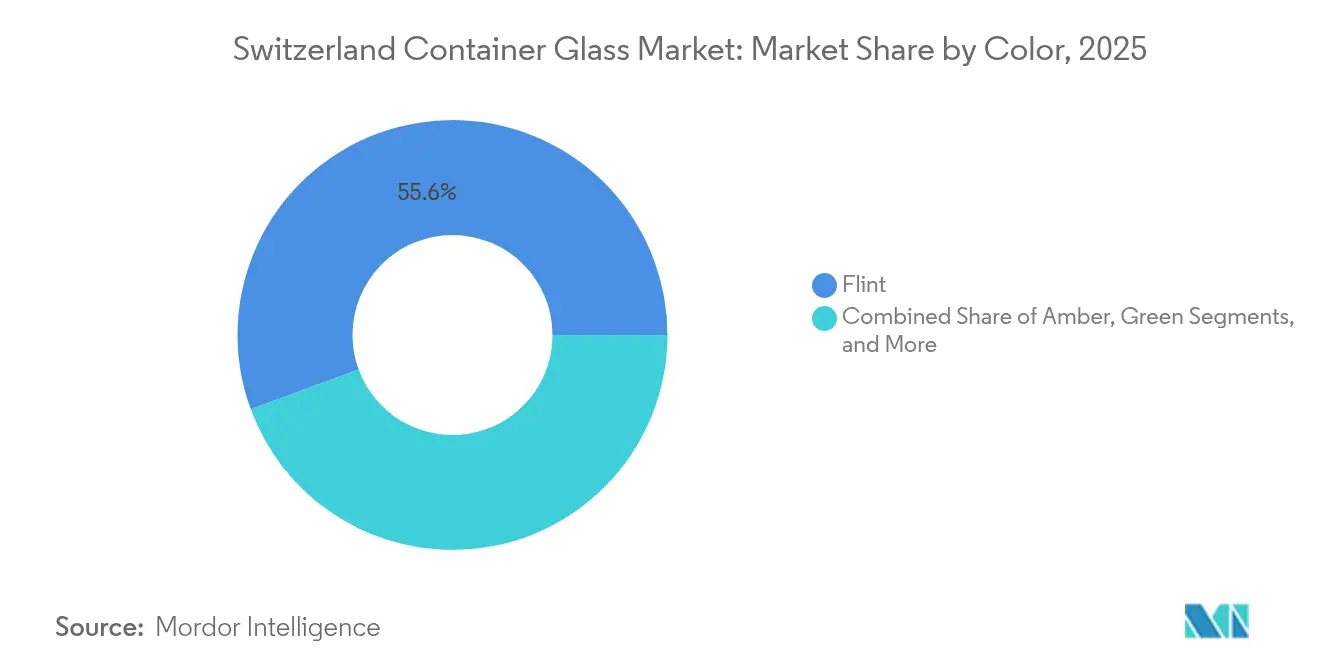
Flint glass dominated 2025 shipments with a 55.62% share of the Switzerland container glass market size, a testament to its broad acceptance across beverages, foods, and OTC drugs. Unobstructed product visibility enhances point-of-sale appeal, while advances in UV inhibitors protect light-sensitive liquids, extending the relevance of flint.
Amber, however, is the clear momentum story, advancing at a 4.98% CAGR through 2031. Pharmaceutical buyers specify amber for UV shielding to maintain biologic potency, pulling incremental tonnage into high-margin batches. Craft brewers and distillers leverage amber’s heritage aesthetics to differentiate SKUs on crowded shelves, further expanding demand. Green retains a niche in wine and sparkling beverages, promoting appellation tradition despite slower growth. Niche hues, such as cobalt and matte black, target luxury cosmetics, albeit at low volumes that nevertheless elevate average unit revenue. Color complexity enhances switching costs, reinforcing incumbent positions and stabilizing profit pools inside the Switzerland container glass market.
Geography Analysis
Domestic consumption centers on Zurich, Basel, and Geneva, where population density is aligned with the presence of beverage, pharmaceutical, and luxury cosmetics plants. Basel’s pharmaceutical corridor requires stringent glass specifications, attracting specialized converters skilled in GMP documentation and lot traceability. Zurich’s beverage bottlers favor returnable loops that leverage Switzerland’s dense reverse-logistics grid, preserving cullet quality and minimizing kiln contaminants. Geneva’s high-end food exporters, ranging from artisanal preserves to boutique spirits, specify flint and custom tints that augment brand storytelling.
Import-export dynamics shape supply security. While Vetropack’s St-Prex closure trimmed local capacity, nearby French Alsace furnaces and Northern Italian plants bridge commodity shortfalls, aided by duty-free intra-EFTA trade. Swiss producers reciprocate by shipping premium amber and pharmaceutical formats into the DACH region, exploiting quality and sustainability differentials over mass-scale rivals. Currency movements inject volatility; a stronger franc dampens export volume but bolsters purchasing power for cullet, gas contracts, and capital equipment, cushioning domestic margins. Policy frameworks at national and EU levels harmonize recycling and compositional targets, streamlining cross-border certification. Switzerland’s alignment eases administrative load for multinational brand owners, encouraging them to anchor specialty runs domestically. Consequently, the Swiss container glass market positions itself as a premium, highly compliant node within Europe’s broader container glass value chain.
Regulatory Landscape
Switzerland regulates container glass through the Federal Office for the Environment (FOEN/BAFU) under a take-back, reporting, and recycling-financing framework. The Ordinance on Beverage Containers sets a minimum recycling rate of 75% for glass beverage containers, while producers and importers of non-refillable beverage containers must report annual quantities to FOEN, tightening oversight of packaging placed on the market.
A new Packaging Ordinance (Verpackungsverordnung, VerpV) adopted on 24 June 2026 consolidates packaging standards, take-back obligations, and the financing of glass recycling. In practice, the prepaid disposal fee system administered by VetroSwiss (operated by ATAG Wirtschaftsorganisationen AG) underpins compliance and funding flows, with a cited fee range of CHF 0.02 to CHF 0.06 that supports collection and downstream recycling operations.
Value Chain Analysis
The Swiss container glass value chain begins with raw materials (silica sand, soda, and lime) and high-energy furnace-based production, then moves to downstream decoration and packaging components, before distribution to beverage, food, cosmetics, and pharmaceutical fillers. On the production side, the market is anchored by a limited domestic manufacturing base, led by Vetropack, alongside cross-border supply from European container glass groups for commodity formats.
Reverse logistics is structurally important in Switzerland because cullet availability and quality affect furnace economics. Collection is mainly organized through municipal bring systems and kerbside programs, while recycling financing is routed via a prepaid disposal fee collected by VetroSwiss and used to support waste glass collectors, transporters, and processing centers. Industry coordination also involves specialized recyclers and processors represented by bodies such as the Vereinigung Schweizer Glasverwerter, helping keep cullet sorted and remelt-ready within the domestic supply chain.
Competitive Landscape
The Swiss container glass industry features mid-level consolidation, with the top five suppliers accounting for an estimated 72% of combined tonnage. Vetropack remains the sole large-scale domestic producer following the closure of St-Prex, yet it competes with imports from Verallia, O-I Glass, and Ardagh for mainstream beverage contracts. Market share battles are increasingly hinging on service depth, regulatory dossiers, rapid color changeovers, and technical troubleshooting, rather than sheer furnace throughput.
Strategic moves illustrate the shift toward value-added niches. Vetropack invested in Echovai's lightweight bottles, which can withstand 70 wash cycles, meeting circular economy mandates and reducing carrier fuel consumption. O-I’s Fit To Win program achieved USD 61 million in cost savings in Q1 2025, freeing up capital for specialty line upgrades in Northern Italy, a key supply source for Swiss customers. Gerresheimer’s guidance reset demonstrates the cyclical nature of pharma vials, prompting Swiss buyers to seek dual sourcing and just-in-time shipment agreements.
Competitive differentiation also emerges through energy transition strategies. Vetropack contracts 100% renewable electricity, lowering Scope 2 emissions and providing carbon-label advantages to ESG-conscious clients. Verallia pilots hybrid furnaces that integrate bio-gas in Burgundy, knowledge that could spill into Swiss operations via technical partnerships. These developments raise competitive thresholds and solidify the Switzerland container glass market’s reputation as a technologically sophisticated, sustainability-oriented arena.
Switzerland Container Glass Industry Leaders
Ardagh Group S.A.
O-I Glass, Inc.
Saverglass Group
Vetropack Holding SA
Berlin Packaging LLC
- *Disclaimer: Major Players sorted in no particular order


Market Opportunities and Future Outlook
Lightweighting and reuse-compatible designs are practical white spaces for Swiss container glass, especially for beverage formats where returnable loops and transport efficiency feed directly into total packaging cost. Vetropack commissioned a new production line for lightweight glass bottles at its Poeklarn site in 2026, and in June 2026 it launched a 350-gram Rhinewine bottle positioned as a lightweight benchmark while supporting a reusable bottle scheme, reflecting a shift from throughput-led supply to performance- and circular-ready SKUs.
Cullet quality and processing capacity also remain an operating lever for competitiveness, given Switzerland's high collection intensity and the need for stable furnace feed. Vetropack Straza announced an EUR 30-35 million investment in a new waste glass processing plant in Croatia in May to June 2026, strengthening regional cullet processing capability within the group's supply network serving Central Europe. Separately, earlier adoption of European Sustainability Reporting Standards (ESRS) by major suppliers is tightening measurement of energy and material efficiency, creating commercial headroom for suppliers that can specify recycled input, emissions improvements, and reuse durability.
Recent Industry Developments
- June 2026: Vetropack Group launches Europe’s lightest Rhinewine bottle and supports new reusable bottle scheme. The release expands Vetropack’s premium beverage glass offerings with a lightweight design. It strengthens circular-economy initiatives and could yield efficiency gains across the packaging portfolio.
- June 2026: Vetropack launches a 350-gram Rhinewine bottle, described as the lightest of its kind in Europe, following production testing in February 2026. The product adds a leading weight reduction for high-end beverages. The move reinforces Vetropack’s market position in lightweight, sustainable packaging.
- May 2026: Ardagh Group S.A. launches Clearly Ardagh transformation initiative with plans to raise capex to 9% of revenues in 2026. The program targets cost efficiency and capital allocation across the European container glass platform. It supports competitive resilience and accelerates modernization of operations.


Research Methodology Framework and Report Scope
Market Definition and Coverage
This market covers the demand for container glass in Switzerland, counted as finished glass packaging used to store and protect products through filling, distribution, and consumption, and tracked in volume terms (kilotons) across the study period.
Scope exclusions: Excluded items include flat glass, automotive glass, tableware, labware, and fiberglass.
Segmentation Overview
- By End-user
- Beverages
- Alcoholic
- Beer
- Wine
- Spirits
- Other Alcoholic Beverages (Cider and Other Fermented Drinks)
- Non-Alcoholic
- Juices
- Carbonated Drinks (CSDs)
- Dairy Product Based Drinks
- Other Non-Alcoholic Beverages
- Alcoholic
- Food (Jam, Jelly, Marmalades, Honey, Sausages and Condiments, Oil, Pickles)
- Cosmetics and Personal Care
- Pharmaceuticals (excluding Vials and Ampoules)
- Perfumery
- Beverages
- By Color
- Green
- Amber
- Flint
- Other Colors
Data Sources, Market Sizing, and Validation
Desk Research
Desk research helped set the Switzerland packaging context and link the model to public indicators that can be checked again later. We mainly relied on official and non-paywalled sources such as the Swiss Federal Statistical Office for industrial context, the Swiss Federal Office for the Environment for recycling and waste flows, and UN Comtrade for trade patterns linked to glass container categories.
In parallel, we reviewed sources such as Eurostat, where cross-country packaging series helped sanity-check directionally. We also used association materials connected to glass collection and recycling, plus peer-reviewed materials and packaging papers describing lightweighting and cullet use trends. Company annual reports, investor presentations, and reputable press were used to understand plant events, furnace rebuild cycles, and demand shifts by end use. Where needed, paid subscriptions focused on shipment-level imports and exports, and a patent database were used to validate the timing of capacity and technology changes. These examples are not exhaustive, and other sources were also reviewed for data collection, validation, and clarification.
Primary Interviews and Surveys
We use interviews and surveys with glass producers, packaging buyers, distributors, and recycling stakeholders in Switzerland. Their feedback tests demand, trade flows, ASP movement, capacity changes, and gaps in public data. Analysts reconcile responses with desk inputs and re-contact respondents when a major assumption does not align.
Distribution of primary research fieldwork respondents
| Company type | Respondent position |
|---|---|
| Top tier: 30% | CXOs: 15% |
| Mid tier: 50% | Functional/Unit leaders: 30% |
| Smaller Players: 20% | Managers: 55% |
Market-Sizing & Forecasting
Sizing was built using a mix of top-down and bottom-up checks, keeping the core model simple and auditable. On the top-down side, we reconstructed the demand pool by mapping Switzerland end-use consumption signals and packaging intensity, which were then translated into container glass volume requirements and aligned with the study period definitions.
To keep the model grounded, inputs included indicators such as beverage and food packaging mix, refillable and returnable bottle penetration, cullet availability and recycling rates, typical lightweighting progression by bottle type, and the timing of furnace maintenance or shutdown events that can tighten supply. Each variable was used to explain volume changes year to year, rather than forcing growth to match one headline trend. Where data gaps existed, especially around application splits, we used primary estimates and then constrained them so totals still matched the broader demand pool.
For forecasting, scenario analysis was applied around a base case. Near-term adjustments were guided by expert consensus on energy cost pressure, recycled content targets, and substitution risks from other packaging materials. Selective bottom-up approximations were used as a cross-check, such as sampled container weights by format multiplied by implied unit demand, plus channel checks with fillers and recyclers to verify whether the trend lines looked realistic.
Data Validation & Update Cycle
Validation was handled through step-by-step checks before the numbers were finalized. We compared model outputs against independent signals like import and export direction, recycling and cullet flow cues, and visible supply events, then investigated variances that did not fit the drivers. Assumptions were re-checked with follow-up calls when responses conflicted or when a key indicator moved unexpectedly.
Before sign-off, the model went through multiple analyst reviews, with outliers flagged and recalculated to confirm arithmetic and logic consistency. The report is refreshed on an annual cycle, with interim updates made when material events occur, such as a major capacity change or regulation shift. Right before delivery, a final pass is completed so clients receive the latest updated view.
Mordor Intelligence's Switzerland Container Glass Market Size Compared With Other Published Estimates
Published market numbers for Switzerland container glass often do not line up because the scope and the measurement unit are not consistent, and because some sources mix manufacturing revenue with consumption volumes. Differences also show up when authors use different base years, apply different currency conversions, or rely on broad packaging ratios that were not tested with local participants.
Excluded items like flat glass, automotive glass, and fiberglass are sometimes bundled into a wider Swiss glass products total, and those items sit outside Mordor Intelligence's scope for this container glass market sizing.
Benchmark comparison
| Source | Market Size | Gaps in Research Methodology |
|---|---|---|
| Mordor Intelligence | USD 241.25 M (2025) | |
| Industry Data Platform A | USD 228.30 M (2024) | Built from trade-code value proxies for glass containers, which can miss domestic production sold locally and can be sensitive to price swings, re-exports, and inventory effects. |
| Regional Consultancy B | USD 500.00 M (2024) | Likely reflects a broader glass products or glass packaging value pool in Switzerland, which can pull in non-container categories and mix value-based revenue with volume consumption measures. |
Looking across the table, the smaller gap is largely explained by trade versus total consumption coverage, while the larger gap comes from mixing in adjacent glass categories and a different unit basis. By keeping assumptions tied to visible demand signals and by re-checking key drivers like returnable share and lightweighting pace through field inputs, the final market size stays traceable to repeatable steps.


Key Questions Answered in the Report
How large is the Switzerland container glass market in 2026?
The Switzerland container glass market size is 250.81 kilotons in 2026, projected to climb to 304.56 kilotons by 2031 at a 3.96% CAGR.
What end-user segment is expanding the fastest in Swiss glass packaging?
Pharmaceuticals lead growth at a 5.46% CAGR to 2031 thanks to biologics expansion and stricter drug-containment regulations.
Which color segment shows the highest growth?
Amber glass grows at 4.98% CAGR, driven primarily by pharmaceutical and premium beverage applications.
Why did Vetropack shut its St-Prex plant?
The closure aligns with a consolidation strategy aimed at cutting energy costs and concentrating production in more efficient facilities.
How does Switzerland sustain a 97% glass recycling rate?
A nationwide Extended Producer Responsibility framework managed by VetroSwiss ensures widespread collection, high-quality cullet streams and consumer participation.
What limits rapid capacity expansion for Swiss glass producers?
High energy and labor costs, capital-intensive furnace rebuilds and glass fragility in long-distance logistics all constrain swift scaling.
Page last updated on:


 Your data is secure and never sold or shared.


