
Market Overview
| Study Period | 2020 - 2031 |
|---|---|
| Forecast Data Period | 2026 - 2031 |
| Base Year Market Size (2025) | USD 14.83 Billion |
| Market Size (2026) | USD 15.67 Billion |
| Market Size (2031) | USD 20.63 Billion |
| Growth Rate (2026 - 2031) | 5.64 % |
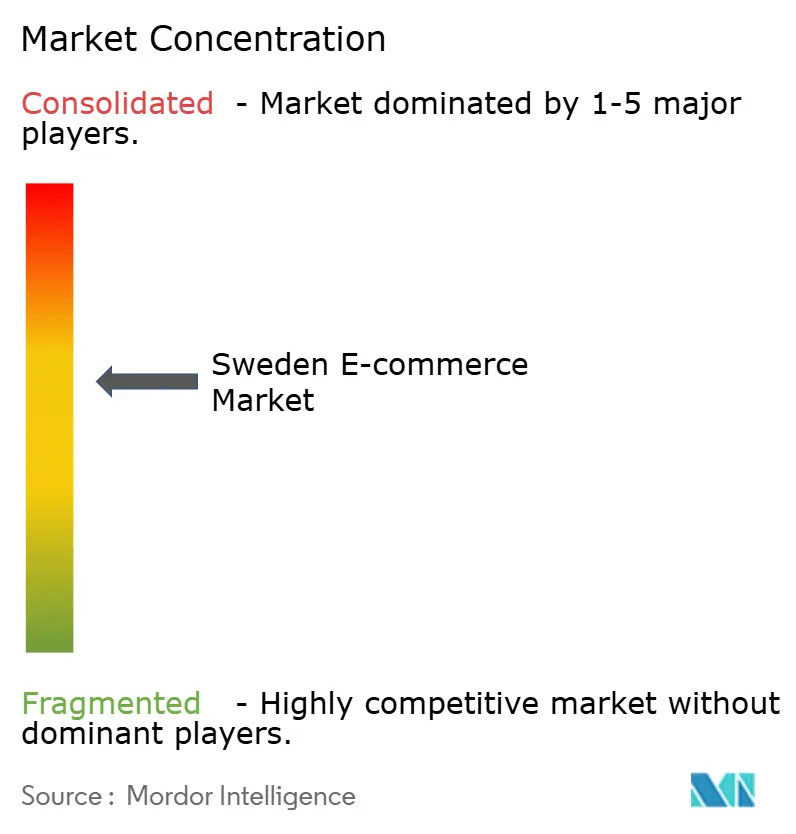
| Market Concentration | Medium |
Major Players *Disclaimer: Major Players sorted in no particular order Image © Mordor Intelligence. Reuse requires attribution under CC BY 4.0. | |
Sweden E-commerce Market Analysis by Mordor Intelligence
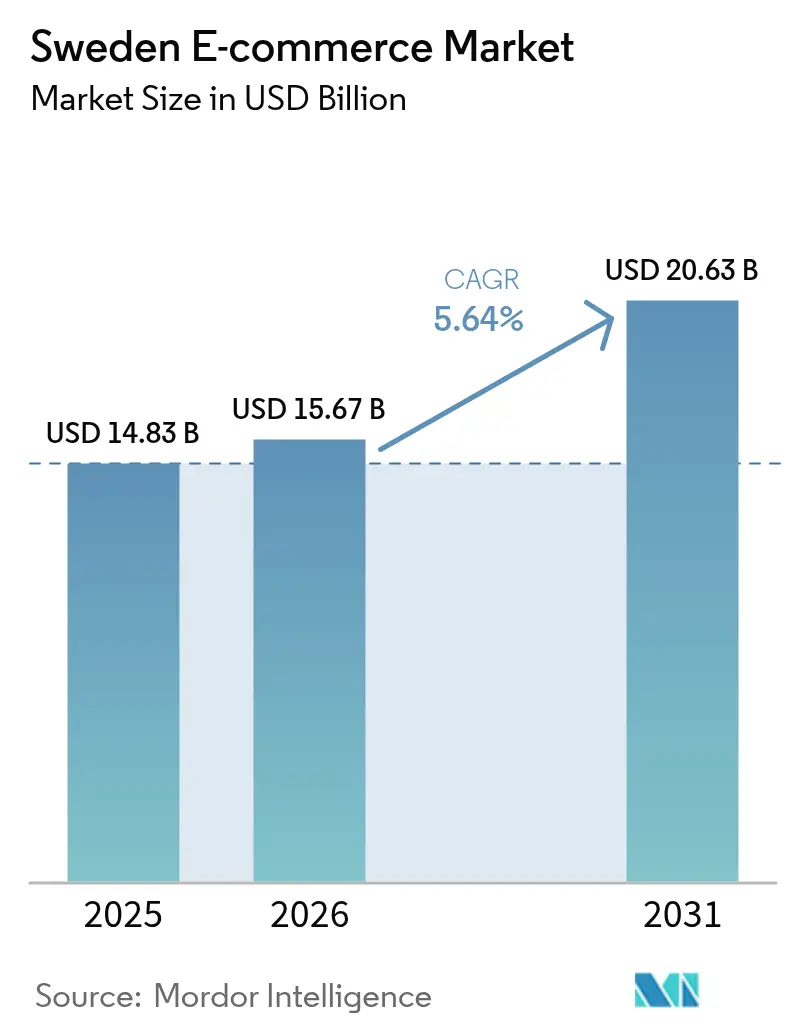
The Sweden e-commerce market size was valued at USD 14.83 billion in 2025 and estimated to grow from USD 15.67 billion in 2026 to reach USD 20.63 billion by 2031, at a CAGR of 5.64% during the forecast period (2026-2031). This sustained growth reflects the country’s near-universal broadband connectivity, a sophisticated logistics network, and a population that routinely prioritizes digital-first shopping. Mobile devices dominate browsing and checkout, and card-less payments such as Swish now set the benchmark for friction-free transactions. Real-time cross-border settlement via the TARGET Instant Payment Settlement (TIPS) rail reinforces national platforms’ competitiveness across the wider Nordic region. Regulatory support for responsible Buy-Now-Pay-Later (BNPL) lending is broadening average order values, while retailer marketplace roll-outs are lifting customer lifetime value and lowering inventory risk. At the same time, rising penalties for GDPR breaches and last-mile congestion in heritage urban zones temper profit margins and spur investment in sustainable delivery innovations.
Key Report Takeaways
- By business model, B2C accounted for 70.35% of Sweden e-commerce market share in 2025, while C2C is projected to expand at a 8.89% CAGR through 2031.
- By device type, smartphones captured 58.40% Sweden e-commerce market share in 2025 and will record the fastest 7.95% CAGR to 2031.
- By payment method, traditional cards held 47.25% share of Sweden e-commerce market size in 2025, whereas BNPL is advancing at a 6.81% CAGR.
- By B2C product category, consumer electronics led with 25.65% revenue share in 2025; food and beverages is forecast to grow at an 8.04% CAGR to 2031.
Note: Market size and forecast figures in this report are generated using Mordor Intelligence’s proprietary estimation framework, updated with the latest available data and insights as of 2026.
Market Trends and Insights
Drivers Impact Analysis of Sweden E-commerce Market*
| Driver | (~) % Impact on CAGR Forecast | Geographic Relevance | Impact Timeline |
|---|---|---|---|
| Card-less Mobile Payments (Swish) Surpassing Card Transactions in Urban Sweden | +1.2% | Stockholm, Gothenburg, Malmö urban centers | Short term (≤ 2 years) |
| Logistics-as-a-Service Networks Enabling Same-Evening Delivery in Greater Stockholm & Gothenburg | +0.8% | Stockholm metropolitan area, Gothenburg region | Medium term (2-4 years) |
| BNPL Regulation Driving Consumer Shift Toward Invoice-Based Check-outs | +0.6% | National, with higher adoption in urban areas | Medium term (2-4 years) |
| H&M, Ikea & Other Flagship Retailers' Rapid Marketplace Roll-outs Elevating Average Basket Size | +0.9% | National, with spillover to Nordic region | Long term (≥ 4 years) |
| EU Digital Product Passport Mandate Accelerating Re-commerce Platforms' Adoption | +0.4% | EU-wide, early implementation in Sweden | Long term (≥ 4 years) |
| Source: Mordor Intelligence | |||
Card-less Mobile Payments (Swish) Surpassing Card Transactions in Urban Sweden
Swish serves 7 million users, or close to 70% of residents, and now processes more urban e-commerce checkouts than cards.[1] Merchants integrating Swish report conversion gains of 15-20% because shoppers avoid manual card entry. Transaction fees are around 60% lower than card rails, allowing competitive pricing strategies that resonate with price-sensitive buyers. Since February 2024 Sweden’s access to the eurozone TIPS network delivers instant cross-border settlement in SEK, which lowers FX friction for Nordic shoppers and further raises merchant adoption.[2] Local SMEs that previously balked at card fees can now participate online with minimal overhead, driving incremental digital sales.
Logistics-as-a-Service Networks Enabling Same-Evening Delivery
Velove’s cargo-bike hubs in Stockholm and Gothenburg fulfill more than 1 million orders with 95% on-time performance, eliminating roughly 40 diesel vans from city streets each day.[3] The model reduces CO₂ emissions and avoids parking fines in restricted heritage zones, giving merchants a dual cost-and-sustainability dividend. Instabee, formed through the Budbee–Instabox merger, spans 40 million Nordic consumers and offers evening delivery on items ordered before 3 p.m., setting new benchmarks for speed. Same-evening fulfillment now acts as a strategic differentiator in fashion and electronics, elevating customer expectations across categories.
BNPL Regulation Driving Consumer Shift Toward Invoice-Based Check-outs
Sweden’s Financial Supervisory Authority imposes strict disclosure rules that cap late fees and mandate affordability checks. Klarna reported a profitable 2024 after absorbing USD 50 million in fines and re-engineering its credit scoring engine. Consumers retain flexible installment options for higher-value baskets, while default rates remain below many EU peers. The resurrection of digital invoices dovetails with Sweden’s historic comfort with post-delivery payments, keeping approval rates high. Retailers report order-value uplifts in furniture and electronics categories as risk-weighted credit limits expand responsibly.
H&M, IKEA & Other Flagship Retailers’ Rapid Marketplace Roll-outs
H&M generated USD 7 billion online, or 30% of total revenue, and now hosts third-party brands to extend assortment without inventory risk. Average basket size and frequency both climbed once complementary accessories appeared alongside core apparel lines. IKEA has earmarked USD 2.2 billion for omnichannel upgrades, including 900 pick-up points and circular-economy programs that align with national sustainability preferences. Marketplace functionality leverages existing trust in heritage retailers, speeds onboarding for niche labels, and raises Sweden e-commerce market visibility for cross-border shoppers.
Restraints Impact Analysis of Sweden E-commerce Market*
| Restraint | (~) % Impact on CAGR Forecast | Geographic Relevance | Impact Timeline |
|---|---|---|---|
| Escalating Pick-up-Point Congestion in Urban Hubs Raising Last-Mile Costs | -0.7% | Stockholm, Gothenburg city centers | Short term (≤ 2 years) |
| Stricter GDPR Fines Limiting Third-Party Data for Personalisation Engines | -0.5% | National, with EU-wide implications | Medium term (2-4 years) |
| Parcel Locker Licensing Bottlenecks in Heritage City Zones | -0.4% | National | Short term (≤2 years) |
| Source: Mordor Intelligence | |||
Escalating Pick-up-Point Congestion in Urban Hubs Raising Last-Mile Costs
PostNord plans to expand from 3,800 to 4,500 lockers, yet heritage zoning slows approvals, especially in Stockholm’s Gamla Stan where vehicle access has been cut by 50%. Couriers reroute to satellite micro-hubs and cargo bikes, but unit economics worsen as average parcel-drop density falls. Operators report 15-20% cost inflation on the final mile, prompting some merchants to raise delivery fees or enforce minimum-basket thresholds. Customer satisfaction risks erosion if fees climb faster than perceived service gains.
Stricter GDPR Fines Limiting Third-Party Data for Personalisation Engines
The Swedish Authority for Privacy Protection fined Klarna USD 733,000 for insufficient data disclosures and added a USD 50 million penalty later in 2024. Retailers now privilege first-party behavioural data, but smaller sellers lack the onsite traffic to achieve meaningful scale. Algorithmic recommendation accuracy suffers when external data feeds are pared back, nudging marketing spend toward broader contextual advertising. Larger platforms with deep loyalty programs widen their competitive moat under this compliance regime.
*Our forecasts treat driver/restraint impacts as directional, not additive. The impact forecasts reflect baseline growth, mix effects, and variable interactions.
Sweden E-commerce Market Segment Analysis
By Business Model:
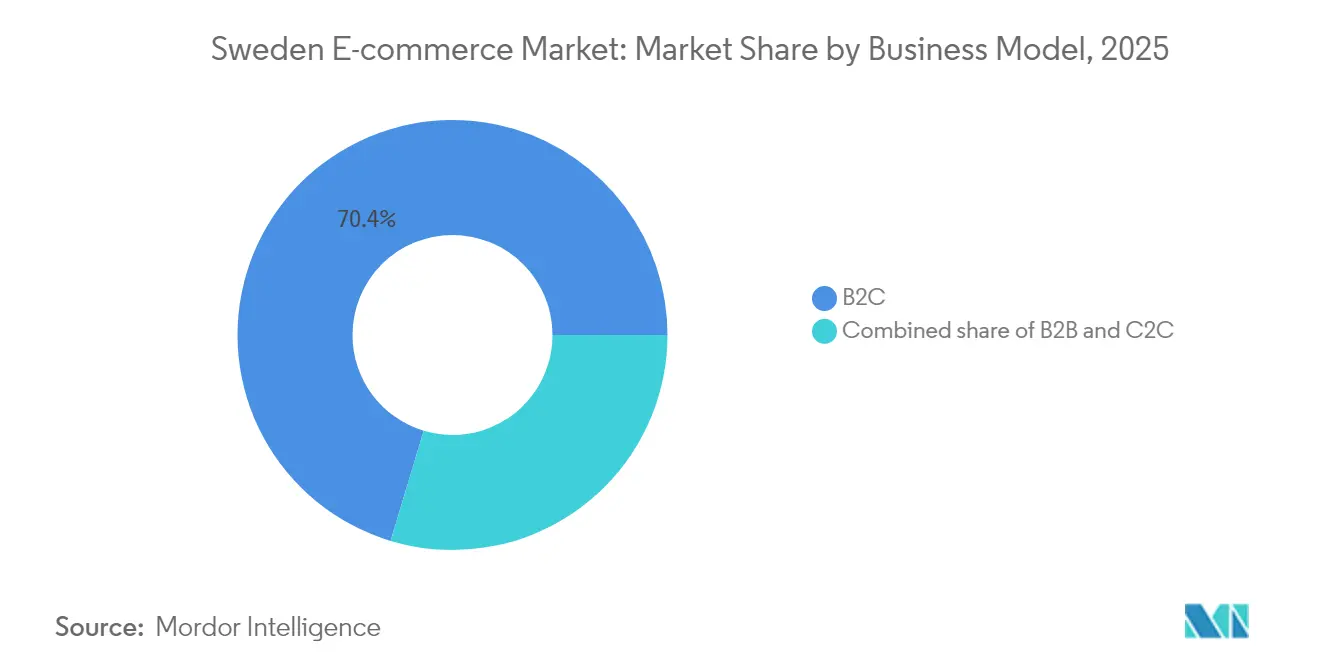
Platform Innovation Reinforces B2C LeadershipB2C routes generated 70.35% of Sweden e-commerce market revenue in 2025, supported by established omnichannel giants and born-digital specialists. The segment benefits from nationwide trust in regulated payment rails and robust consumer-protection frameworks that encourage repeat purchases. Marketplace extensions by H&M and IKEA illustrate how incumbents widen assortment while diluting inventory risk. These roll-outs push average order values higher, extend session duration, and enhance cross-sell efficacy across fashion, homeware, and lifestyle goods. C2C activity, expanding at 8.89% CAGR, capitalises on rising demand for sustainable consumption and transparent provenance. Platforms integrate Swish for instant settlement and leverage national ID verification, fostering secure peer-to-peer exchanges that in turn bolster overall Sweden e-commerce market liquidity.
The B2B corridor remains smaller but undergoes rapid digitisation as procurement managers prioritise efficiency. Enterprises migrate from fax-based ordering to cloud marketplaces that streamline approval workflows and automate invoice reconciliation. Standardised e-invoicing and compatibility with enterprise resource planning suites reduce error rates and accelerate payment cycles. Over time this modernisation diminishes channel fragmentation and incrementally raises Sweden e-commerce market size through corporate accounts.

By Device Type:
Mobile-First Experiences Set the StandardSmartphones captured 58.40% Sweden e-commerce market share in 2025 and will post the fastest 7.95% CAGR through 2031. Superior 5G coverage and large-screen adoption foster convenient browsing, while biometric authentication curtails checkout friction. Progressive web apps and mini-programs compress page-load times and reduce data consumption, a boon for commuters shopping during transit. Retailers deploy augmented-reality fitting and real-time stock look-ups that deepen engagement and raise conversion probabilities. Desktop retains relevance for configurable products and enterprise buyers that demand advanced filtering and data export. Tablet traffic sees modest growth as households use shared screens for group purchasing decisions, especially in furniture and travel.
Emergent interfaces such as smart speakers and connected car dashboards open fresh touchpoints. Voice ordering of grocery staples ties into predictive replenishment engines that learn consumption patterns. Early movers embed voice commerce capabilities to secure customer mindshare before competitors flood the space, further expanding Sweden e-commerce market penetration into daily routines.
By Payment Method:
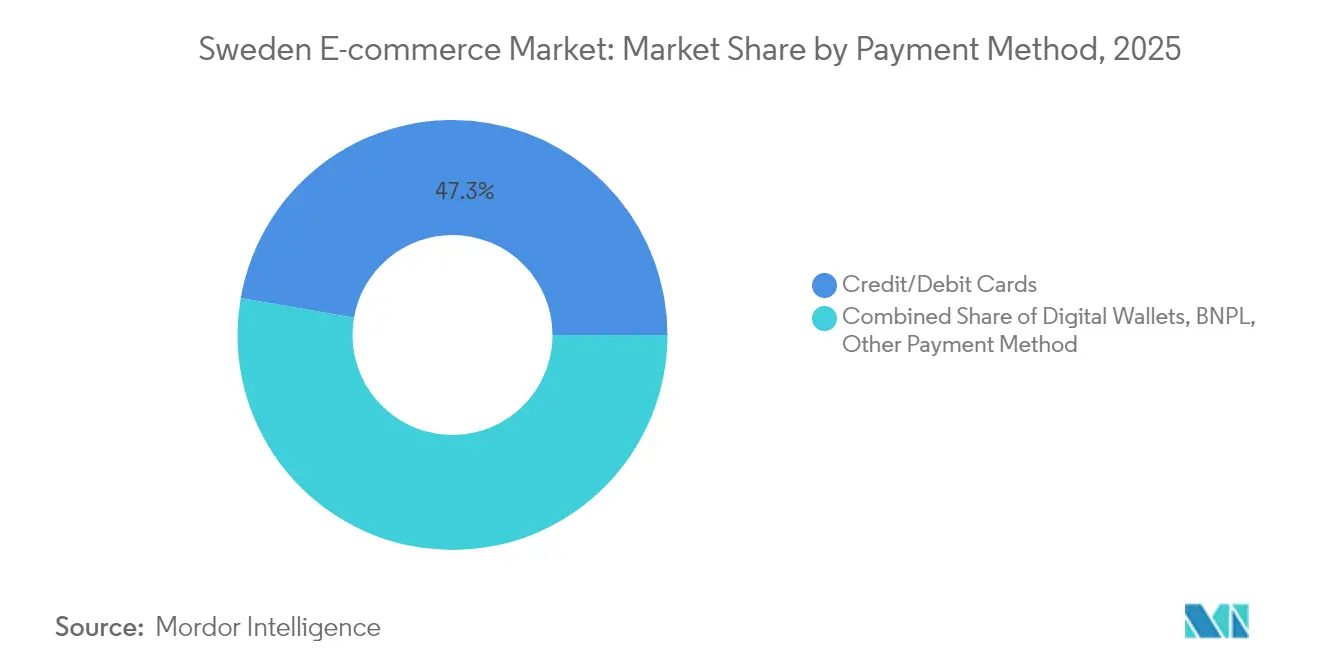
Transaction Diversity Fuels Conversion GainsCards still represent 47.25% share of Sweden e-commerce market size in 2025, anchored by mature interchange frameworks and widespread consumer familiarity. Yet Swish and other digital wallets entice younger cohorts with single-tap authentication, accelerating checkout by removing credential entry. BNPL advances at 6.81% CAGR as regulatory clarity safeguards borrower repayment capacity while preserving flexibility for high-ticket items. Integrations with digital ID systems trim onboarding friction, enabling near-instant credit lines that mirror card-based simplicity. Bank-direct transfers over the TIPS rail cut processing fees and provide guaranteed settlement, improving merchant cash flow compared with traditional card rails.
Cryptocurrency remains niche yet gains traction in specific tech-savvy communities that value decentralisation. Merchants accepting crypto often convert proceeds immediately to fiat, hedging volatility while courting new customer segments. Payment choice abundance reduces cart abandonment and lifts overall Sweden e-commerce market conversion rates.
By B2C Product Category:
Electronics Maturity Meets Food VelocityConsumer electronics maintained the leading 25.65% revenue share in 2025, reflecting Sweden’s early-adopter culture and frequent hardware upgrade cycles. Bundling of extended warranties and subscription software elevates lifetime value on each device sale. Intense price-comparison behaviour keeps margins tight, so retailers differentiate through rapid fulfilment and premium support. Food and beverages exhibit the fastest 8.04% CAGR as same-day fulfilment and temperature-controlled last-mile options dissipate prior freshness concerns. MatHem’s partnership with Clas Ohlson signals ecosystem convergence that marries grocery with home-improvement cross-promotions.
Apparel and beauty categories embrace virtual try-on features and generous return windows that closely replicate in-store evaluation. Circular-fashion momentum propels resale marketplaces, offering brands a stake in second-life monetisation. Subscription boxes proliferate in beauty and specialty foods, locking in predictable revenue and data-rich feedback loops that feed continuous assortment tuning within the Sweden e-commerce market.
Geography Analysis
Greater Stockholm and Gothenburg together account for about 60% of national online orders, a function of population density, high disposable income, and dense parcel-locker networks. Stockholm benefits from multiple urban consolidation centres that shorten stem-miles and enable cargo-bike penetration on narrow medieval streets, trimming emissions by 73% when paired with micro-terminals. Gothenburg leverages port infrastructure to support import-to-consumer flows that compress lead times on international goods and elevate cross-border turnover within the Sweden e-commerce market.
Malmö capitalises on Øresund Bridge proximity, encouraging Danish shoppers to exploit price variations and favourable SEK exchange dynamics. Rural municipalities experience accelerating adoption as 5G coverage blankets sparsely populated areas. Nevertheless, elevated delivery surcharges persist outside major conurbations, challenging profit margins on low-value baskets. Some merchants experiment with community locker clusters in village centres to consolidate drop density and lower cost per parcel.
Internationally, Sweden’s membership of the EU single market and participation in TIPS facilitate friction-less cross-border trade. Nordic logistics alliances coordinate line-haul routes and share micro-fulfilment infrastructure, mitigating duplicate capital expenditure. Swedish sellers increasingly list on pan-European marketplaces, extending customer reach while preserving domestic fulfilment control. This outward orientation further enlarges Sweden e-commerce market size as local inventory addresses regional demand.
Regulatory Landscape
Sweden e-commerce operates under EU-aligned platform and consumer rules, with national implementation strengthening enforcement. Lag (2024:954), effective from December 2024, adds complementary provisions to the EU Digital Services Act (DSA), expanding supervisory tools over intermediary services and online platforms alongside EU obligations.
Core commerce and consumer-protection requirements continue to shape merchant operations. The Electronic Commerce Act (Lag 2002:562) sets identity and price transparency duties, while Konsumentkoplag (2022:260) governs consumer rights. Distance-selling rules, including a 14-day right of withdrawal for online purchases, reinforce return and refund processes. The Swedish Post and Telecom Authority (PTS) provides ongoing oversight and reporting related to safer digital services, including its DSA-related reporting activity in 2026.
Value Chain Analysis
The value chain spans brand owners and merchants (direct-to-consumer and marketplace sellers), commerce enablement layers (storefront platforms and payments such as cards, Swish, and BNPL), and fulfillment (warehousing, parcel networks, pickup points, and last-mile delivery). Cross-border flows are supported by import channels through major logistics nodes such as Gothenburg and Stockholm, while order management and real-time tracking are increasingly embedded across warehousing and transport to support high service-level expectations.
Fulfillment and 3PL capacity remain central differentiators as retailers shift inventory risk through marketplace models and seek faster delivery promises. PostNord TPL operates large-scale warehousing for e-commerce, including a 50,000 square meter Nordic central warehouse operation in Brunna for Zalando, which illustrates the importance of consolidated distribution for serving Sweden and wider Nordic demand. Logistics providers also push deeper integration, including control-tower approaches to coordinate transport and inventory end-to-end, while urban pickup-point congestion and locker licensing constraints in heritage zones add cost and complexity to last-mile execution.
Competitive Landscape
The market shows moderate concentration: the five largest platforms capture slightly under 60% of total Gross Merchandise Value, leaving room for agile specialists. H&M and IKEA exemplify omnichannel synergy by steering in-store traffic toward digital exclusives, thereby smoothing inventory turnover and deepening data capture. Amazon Sweden intensifies price transparency and accelerates two-day delivery benchmarks, pushing domestic players to enhance last-mile capabilities. Meanwhile, regional champions such as CDON pivot to third-party marketplace models that monetise site traffic without significant inventory risk.
Strategic M&A continues to reshape competitive lines. Axfood’s SEK 1.7 billion (USD 153 million) acquisition of City Gross expands fresh-food assortments and unlocks supply-chain synergies that lower per-parcel pick-rates. Clas Ohlson’s USD 26 million stake in MatHem brings home-improvement SKUs onto grocery delivery vans, creating one-stop convenience for household errands. Technology partnerships also flourish: Voyado’s SEK 3.5 billion (USD 0.37 billion) valuation round secures funds for AI-based loyalty modules that bolster repeat conversion metrics for fashion and lifestyle retailers.
Emerging disruptors differentiate on sustainability and hyper-local curation. Velove’s zero-emission deliveries attract eco-conscious brands seeking to align logistics with corporate responsibility targets. Nelly Group sustains niche apparel leadership through influencer collaboration pipelines that shorten trend cycles. Competitive intensity is therefore defined by agility in fulfilment, data-driven merchandising, and responsible consumer engagement frameworks across the Sweden e-commerce market.
Sweden E-commerce Industry Leaders
-
Elgiganten
-
Webhallen Sverige AB
-
Zalando SE
-
Apotea AB
-
NetOnNet
- *Disclaimer: Major Players sorted in no particular order
Sweden E-commerce Market Companies Covered in this Report
- NetOnNet
- Elgiganten
- Webhallen Sverige AB
- Zalando SE
- Apotea AB
- Adlibris AB
- H and M Hennes and Mauritz AB
- Amazon Sweden (Amazon.se)
- IKEA Retail AB
- Coop Sverige AB
- CDON AB
- Boozt AB
- Dustin Group AB
- MatHem i Sverige AB
- Clas Ohlson AB
- Lyko Group AB
- Gymgrossisten Nordic AB
- Jollyroom AB
- Stadium AB
- Kronans Apotek AB
Market Opportunities and Future Outlook
Opportunities are emerging where Sweden combines high digital maturity with active programs that reduce friction in cross-border and back-office commerce. The European Commission's Digital Decade 2026 country report highlights Sweden's robust connectivity base and calls out enterprise AI adoption as an area for acceleration, creating whitespace for retailers and enablers that can operationalize AI in search, service, merchandising, and fraud controls without weakening consumer trust.
Trade and documentation digitalization also creates room for efficiency gains in cross-border e-commerce operations. In December 2025, ICC Sweden and the Stockholm Centre for Commercial Law submitted a legislative proposal to enable digital trade documents under Swedish law aligned with the MLETR standard, and Sweden has supported EU-level digital trade rules, including the EU-South Korea digital trade agreement concluded in March 2025. On the demand and logistics side, industry reporting in 2025 pointed to strong e-commerce growth and a shift toward circular commerce, including a reported 50% rise in second-hand parcel shipments, supporting opportunities for recommerce platforms, authentication, and product-information tooling as EU Digital Product Passport preparations move toward the 2027 enforcement timeline referenced in the market context.
Recent Industry Developments in Sweden E-commerce Market
- July 2026: Apotea reported Q2 2026 revenue of SEK 2,025.9 million, reflecting 10.9% organic growth. The update signaled continued scaling in high-frequency categories where delivery reliability and assortment breadth drive repeat purchasing, keeping competitive pressure elevated for other online-first retailers.
- April 2026: Apotea launched its beauty and health assortment in Norway, supplied from its logistics center in Varberg. The move broadened addressable demand beyond Sweden while improving utilization of automated fulfillment capacity, strengthening the economics of fast delivery in pharmacy-led and adjacent categories.
- July 2025: NetOnNet launched a new communication platform, "Inte som alla andra," as part of its retail-sector development strategy. The repositioning reinforced price-and-value messaging in consumer electronics e-commerce, a category where intense comparison shopping pushes retailers to differentiate beyond product assortment.
Sweden E-commerce Market Report Scope and Research Methodology
Market Definition and Coverage
For this report, the Sweden e-commerce market is defined as the value of physical goods bought online by Swedish residents, completed through websites or apps, including domestic and cross-border orders.
Scope exclusions: Pure digital content, online gambling, and B2B procurement suites are excluded from this market sizing.
Segments Covered in This Report
- By Business Model
- B2C
- B2B
- C2C
- By Device Type
- Smartphone / Mobile
- Desktop and Laptop
- Other Device Types
- By Payment Method
- Credit / Debit Cards
- Digital Wallets
- BNPL
- Other Payment Method
- By B2C Product Category
- Beauty and Personal Care
- Consumer Electronics
- Fashion and Apparel
- Food and Beverages
- Furniture and Home
- Toys, DIY and Media
- Other Product Categories
Data Sources, Market Sizing, and Validation
Desk Research
Desk research built the starting structure for the Sweden market and helped us set realistic guardrails on what is in scope and what is not. We relied on public Sweden retail and digital-trade indicators, including Statistics Sweden (SCB) retail and household spending releases, Swedish Customs trade statistics for goods flows, and official EU sources on cross-border e-commerce rules and consumer protections. We also used the PostNord E-barometern annual reporting as a practical cross-check for Swedish online retail direction, especially around what many local stakeholders treat as e-commerce in everyday reporting.
To connect market value to business reality, we reviewed company filings, annual reports, investor presentations, and credible press coverage to understand category emphasis and promotional cycles that can change online demand. In parallel, we used paid databases for company financials and intelligence, plus a patent database to track innovation activity around payments and fulfillment that can influence conversion and delivery expectations. The sources listed here are illustrative, and many other public datasets and documents were also consulted for data collection, validation, and clarification during the work.
Primary Interviews and Surveys
Primary work was used to verify the size logic and to stress-test assumptions that desk sources do not spell out clearly, such as how cross-border baskets get counted and how returns and cancellations affect recognized value. We spoke with online retailers, marketplaces, payment and logistics stakeholders, and category specialists across Sweden so the model could be checked against actual selling patterns and shopper behavior, then refined where gaps appeared.
Distribution of primary research fieldwork respondents
| Company type | Respondent position |
|---|---|
| Top tier: 34% | CXOs: 19% |
| Mid tier: 44% | Functional/Unit leaders: 28% |
| Smaller Players: 22% | Managers: 53% |
Market-Sizing & Forecasting
Sizing starts from a top-down rebuild of Sweden online goods spending, where retail value signals and category splits are translated into an addressable online demand pool, then adjusted for cross-border buying that still lands with Swedish consumers. We sanity-check totals through selective bottom-up approximations, such as sampled category GMV logic using average order values and purchase frequency, plus channel checks across large and mid-size sellers. We adjust only when the checks repeatedly point in the same direction.
A few inputs mattered more than others in this market model, and they were kept simple so they can be reviewed step by step. We relied on indicators like Sweden retail spending direction, online share progression by category, cross-border order mix, return rates in high-return categories like apparel, and payment mix changes that influence checkout conversion. Where interviews flagged data gaps, we used conservative ranges and applied them consistently across categories. The final number was moved only when multiple sources supported the change.
For forecasting, we used scenario analysis anchored on a short set of drivers that experts can agree on, then smoothed the year-to-year path to avoid overstating one-off swings. The forward view was stress-tested against expected household spending conditions, category rebalancing, and delivery capacity and cost trends, followed by a final pass to ensure the implied growth rates stay plausible for Sweden.
Data Validation & Update Cycle
Validation is handled through repeated cross-checks, not a single step at the end. Our team compares modeled totals against independent signals, such as reported e-commerce net sales proxies, retail trade direction, and cross-border activity cues, then investigates spikes that do not match what stakeholders are seeing on the ground. When a variance looks structural, the related assumption is revisited, and if needed, respondents are re-contacted to confirm whether the shift is temporary or lasting.
Before sign-off, the model and inputs go through a multi-step review so calculation errors and inconsistent definitions get caught early. Reports are refreshed annually, and interim updates are made when material events shift demand, pricing, or fulfillment conditions. Right before delivery, an analyst performs a fresh scan and updates key assumptions so the view reflects the latest available information.
Mordor Intelligence's Sweden Ecommerce Market Size Compared With Other Published Estimates
It is common to see different market sizes for Sweden e-commerce because publishers do not count the same things in the same way, even when the report titles look similar. The biggest differences usually come from what is treated as e-commerce (goods only versus goods plus services), whether B2B activity is included, and how cross-border orders are handled in the final value.
Some public write-ups also mix in digital services, ticketing, or broader online transaction value, which can push totals up even if the shopping reality for physical goods is unchanged. In our work, the key gap driver is scope: some estimates broaden the market to include multiple commerce types and service-heavy categories, then express the result as a single e-commerce number. Mordor Intelligence limits the count to online purchases of physical goods by Swedish residents (including domestic and cross-border), and it also keeps pure digital content and gambling outside the total. That narrows the figure, while keeping it tied to a repeatable demand pool.
Benchmark comparison
| Source | Market Size | Gaps in Research Methodology |
|---|---|---|
| Mordor Intelligence | USD 14.83 B (2025) | |
| Trade Journal A | USD 17.18 B (2025) | Often presented as e-commerce revenue without clearly stating inclusions like services, VAT treatment, or how cross-border sales are assigned, which can inflate or shift the total versus a goods-only consumer scope. |
| Industry Bulletin B | USD 13.49 B (2022) | Uses an older base year and a broader commerce framing that can mix B2B and other transaction types, and it may not align inflation and currency conversion timing to Sweden consumer goods demand in the same way. |
The spread in published values becomes easier to explain once you line up the scope and the year being quoted, then check what is actually being counted. A disciplined approach that separates physical goods from adjacent digital and service spend, and that treats cross-border consistently, gives decision-makers a number that can be replicated and updated as conditions change.
Key Questions Answered in the Report
What is the current size of the Sweden e-commerce market?
The Sweden e-commerce market is worth USD 15.67 billion in 2026 and is on track to reach USD 20.63 billion by 2031.
Which segment holds the largest Sweden e-commerce market share?
B2C sales dominate with 70.35% of market revenue in 2025, reflecting strong consumer trust in direct-to-consumer platforms.
How fast is mobile shopping growing in Sweden?
Smartphones command 58.40% of transactions and are set to grow at 7.95% CAGR through 2031 as 5G coverage and biometric checkout become ubiquitous.
Why are BNPL services popular in Sweden?
BNPL combines flexible instalments with strict regulatory oversight that keeps default rates low, helping the payment option expand at a 6.81% CAGR in high-ticket categories.
How are logistics providers tackling last-mile congestion?
Operators deploy cargo-bike micro-hubs and expand locker networks, reducing emissions and sidestepping vehicle restrictions in historic city centres.
What impact will the EU Digital Product Passport have on Swedish e-commerce?
Mandatory product passports will boost resale confidence and data transparency, accelerating the growth of re-commerce platforms ahead of the 2027 enforcement deadline.