Sweden Data Center Market Size and Share
Market Overview
| Study Period | 2019 - 2030 |
|---|---|
| Base Year For Estimation | 2024 |
| Forecast Data Period | 2025 - 2030 |
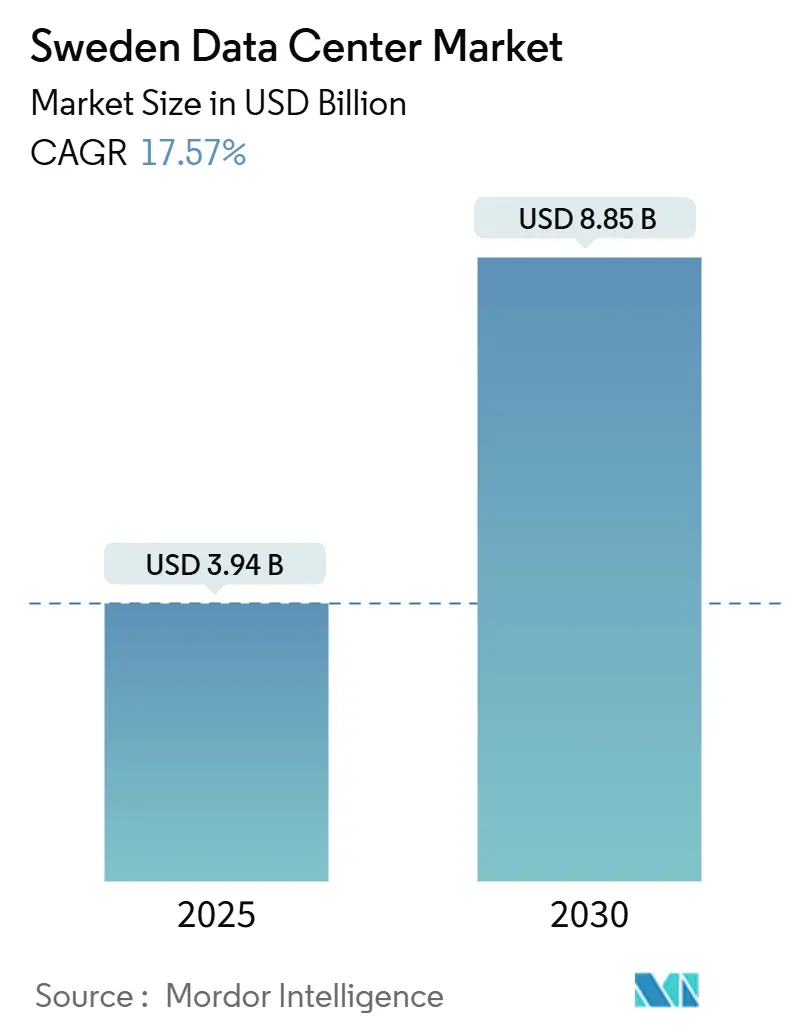
| Market Size (2025) | USD 3.94 Billion |
| Market Size (2030) | USD 8.85 Billion |
| Growth Rate (2025 - 2030) | 17.57% CAGR |
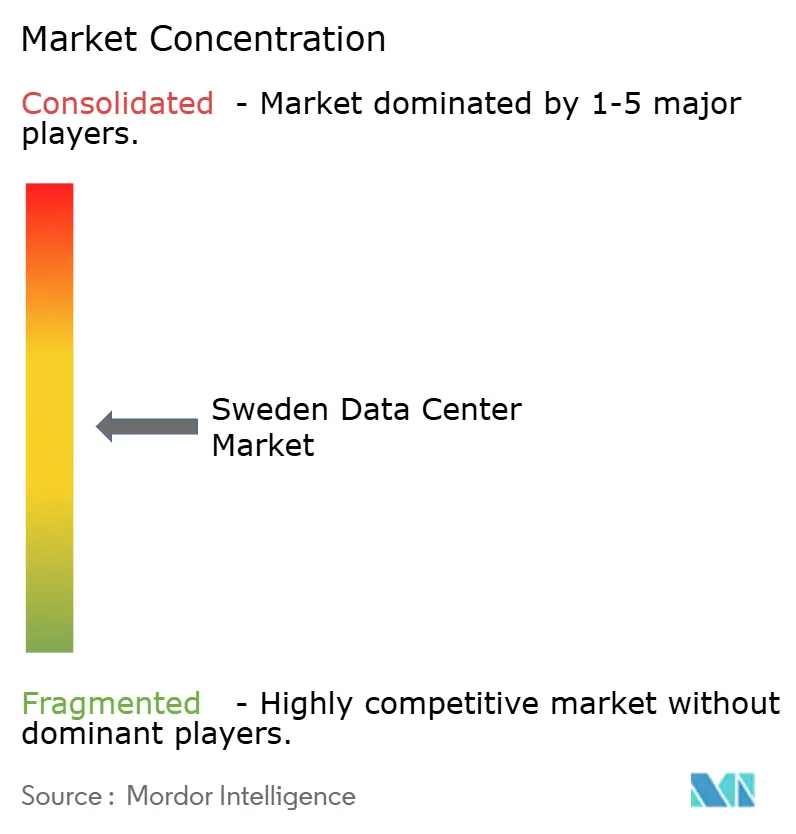
| Market Concentration | Medium |
Major Players
*Disclaimer: Major Players sorted in no particular order Image © Mordor Intelligence. Reuse requires attribution under CC BY 4.0. |
|
Sweden Data Center Market Analysis by Mordor Intelligence
The Sweden Data Center Market size is estimated at USD 3.94 billion in 2025, and is expected to reach USD 8.85 billion by 2030, at a CAGR of 17.57% during the forecast period (2025-2030). In terms of installed base, the market is expected to grow from 0.95 thousand megawatt in 2025 to 1.57 thousand megawatt by 2030, at a CAGR of 10.56% during the forecast period (2025-2030). The market segment shares and estimates are calculated and reported in terms of MW. The Swedish data center market benefits from low-carbon power priced 60-90% below that of leading European hubs, a 97% electricity tax rebate, and cumulative hyperscale capital expenditures already exceeding USD 10 billion.[1]Bloomberg News, “Nordic Data Center Boom Fueled by Low Prices, Empty Land and Cool Weather,” bloomberg.com Dense open-access fiber in Stockholm, heat-recovery monetization through district heating links, and sovereign AI funding of SEK 2.5 billion annually until 2029 further accelerate new-build economics. Rapid diversification of workload into AI training, digital banking, and industrial IoT sustains double-digit demand; however, north-south grid bottlenecks and protracted environmental approvals temper the otherwise robust growth outlook.[2]Reuters, “Sweden’s Power Demand Could Rise 150% by 2045 Due to Data Centres,” reuters.com
Key Report Takeaways
- By data center size, massive facilities led with a 46.48% share of the Swedish data center market in 2024, while large facilities are forecasted to expand at a 7.10% CAGR through 2030.
- By tier type, Tier 4 installations accounted for 61.14% of the Swedish data center market size in 2024 and are projected to advance at an 8.30% CAGR through 2030.
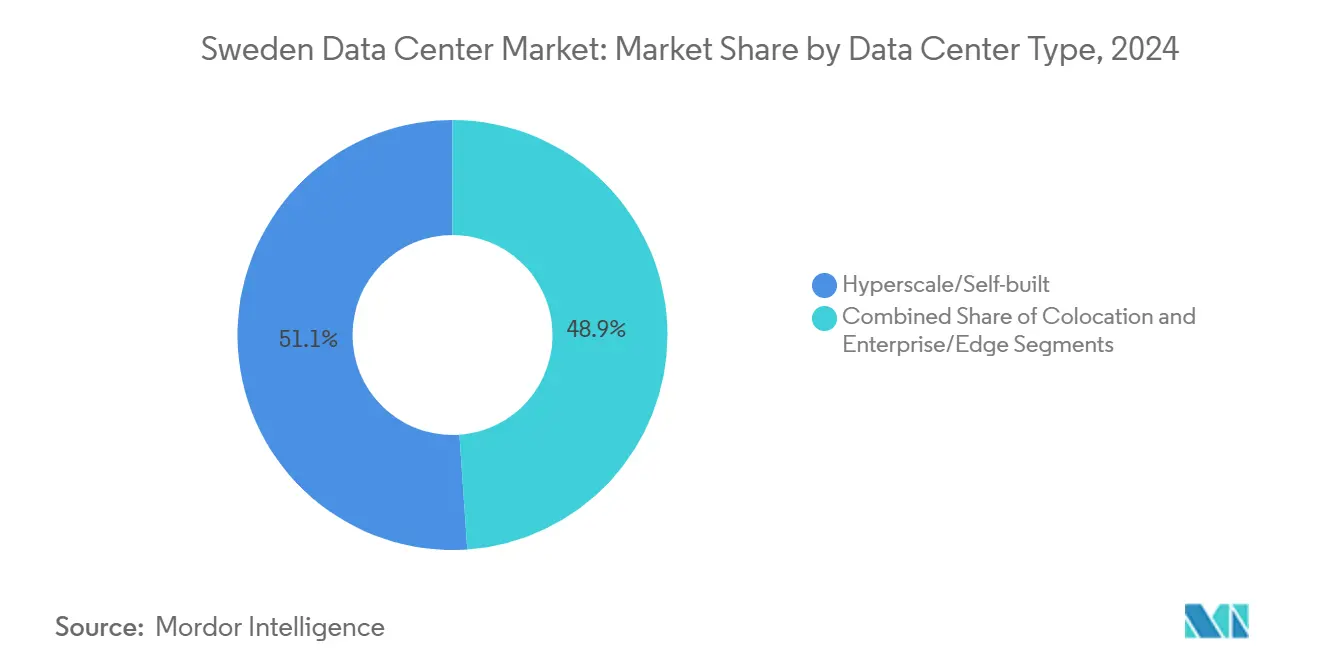
- By data center type, hyperscale/self-built sites accounted for a 51.10% share of the Swedish data center market size in 2024, and this segment continues to be the fastest grower at a 6.25% CAGR.
- By end user, IT and telecom captured a 55.74% revenue share of the Swedish data center market in 2024; BFSI is projected to post the highest CAGR of 9.18% between 2025 and 2030.
- By hotspot, Stockholm represented 36.47% of the Sweden data center market share in 2024, whereas the Rest of Sweden locations are expected to expand at a 11.22% CAGR through 2030.
Sweden Data Center Market Trends and Insights
Drivers Impact Analysis
| Driver | (~) % Impact on CAGR Forecast | Geographic Relevance | Impact Timeline |
|---|---|---|---|
| Abundant renewable energy and 97% electricity-tax rebate | +2.8% | National, strongest in the north | Long term (≥ 4 years) |
| Hyperscale capex surge from Brookfield, AWS, Microsoft, Meta, Evroc | +2.2% | Stockholm and secondary markets | Medium term (2-4 years) |
| Dense open-access fiber backbone (Stokab) | +1.5% | Stockholm metro | Short term (≤ 2 years) |
| Government incentives and fast permitting for heat-reuse projects | +1.3% | Urban centers with district heating | Medium term (2-4 years) |
| Heat-recovery monetization | +0.9% | Major municipal systems | Long term (≥ 4 years) |
| Emergence of sovereign AI cloud providers | +1.1% | National | Long term (≥ 4 years) |
| Source: Mordor Intelligence | |||
Abundant Renewable Energy and 97% Electricity-Tax Rebate
Sweden’s hydro-nuclear mix delivers power costs that undercut continental averages by as much as 90%, enabling operators to secure electricity contracts that significantly lower the total cost of ownership. A statutory 97% tax rebate effectively reduces levies to EUR 0.005/kWh, almost eliminating fiscal drag and allowing hyperscale budgets to reallocate savings to accelerated capacity build-outs. Microsoft earmarked SEK 33.7 billion for cloud and AI build-outs after modeling multi-year savings under the incentive scheme. Utilities Vattenfall and Fortum have reserved grid headroom and pre-permitted roughly 15 sites, signaling institutional coordination that supports the Sweden data center market. Coupled with near-zero carbon intensity, these economics fulfill rising ESG criteria for AI training loads.
Hyperscale Capex Surge
Capital expenditure from Brookfield, AWS, Microsoft, Meta, and Evroc already tops USD 10 billion, redefining capacity pipelines and supply-chain clustering across the Sweden data center market. Brookfield alone plans a 750 MW campus in Strängnäs, the largest Nordic project to date, with a decade-long roll-out that secures local construction and MEP trades. Microsoft’s investments complement AWS availability zones in Västerås, Eskilstuna, and Katrineholm, implementing distributed redundancy that underpins low-latency consumer services. Meta’s Arctic facilities demonstrate that free-cooling designs can reduce PUE to below 1.1, even during AI peak loads, thereby validating climate-based efficiency models. Sovereign provider Evroc expands domestic options for regulated workloads, ensuring competitive tension that keeps pricing disciplined.
Government Incentives and Heat-Reuse Fast-Track
Policy makers bundle district-heating integration with expedited permits, trimming six to twelve months from standard environmental assessments for projects that guarantee thermal-energy offtake. Operators that route condenser hot water into municipal grids can earn revenue capable of offsetting up to 25% of annual cooling spend. EcoDataCenter’s Borlänge campus, financed with EUR 600 million, was green-lit under this regime and structured its PPA to reward both renewable sourcing and heat sales. The Swedish Energy Agency provides engineering guidance to international builders unfamiliar with local district heating, helping them de-risk design choices. The result is a virtuous cycle: municipal utilities gain decarbonized heat, while data centers monetize what was previously waste.
Emergence of Sovereign AI Cloud Providers
Domestic AI futures funding of SEK 2.5 billion a year through 2029 underwrites compute pools that comply with Swedish security statutes and forthcoming EU AI Act provisions. A cross-industry consortium featuring AstraZeneca, Ericsson, Saab, SEB, and Wallenberg Investments selected NVIDIA DGX SuperPODs to form Sweden’s largest enterprise AI cluster. These deployments demand Tier 4 resiliency, air-gapped zones, and on-premises sovereign key management, stimulating specialized build standards. Sovereign capacity reduces reliance on extra-regional cloud hubs, ensuring data residency for critical sectors and expanding the addressable demand for the Swedish data center market.
Restraints Impact Analysis
| Restraints | (~) % Impact on CAGR Forecast | Geographic Relevance | Impact Timeline |
|---|---|---|---|
| North-south grid congestion | -1.8% | National; acute in SE3-SE4 zones | Long term (≥ 4 years) |
| Lengthy grid-connection and environmental permits | -1.2% | All regions | Medium term (2-4 years) |
| Military veto slowing offshore-wind rollout | -0.7% | Coastal generation zones | Long term (≥ 4 years) |
| Escalating ransomware and cyber-attacks | -0.5% | Global; Nordic targets rising | Short term (≤ 2 years) |
| Source: Mordor Intelligence | |||
North–South Grid Congestion
Demand for power is expected to increase by 150% by 2045, yet the existing 400 kV backbone struggles to transport surplus hydroelectricity from the north to load pockets in Stockholm and southern industrial belts. Svenska kraftnät’s SEK 100 billion reinforcement plan will not be completed before 2035, leaving 5-8 year queue times for new grid connections. Operators pivot to northern localities, such as Luleå or Boden, to bypass constraints, but must absorb higher network-backhaul costs and recruit from outside established labor pools. The delay risks pushing portions of hyperscale expansion to neighboring Finland or Denmark unless interim flexible-generation assets and demand-side management progress quickly.
Lengthy Grid-Connection and Environmental Permits
Large facilities face approval windows of 18-36 months, encompassing assessments of noise, water use, biodiversity, and visual impact.[3]DLA Piper, “New Data Centre Sustainability Reporting Obligations,” dlapiper.com EU Delegated Regulation 2024/1364 introduces 24 new sustainability KPIs for sites exceeding 500 kW, thereby increasing documentation and third-party verification requirements. Municipal variances create uncertainty, with some local boards granting heat-recovery projects fast-track status while others require multiple rounds of public consultation. These variables force developers to secure additional sites as hedges, inflating land-bank costs and complicating capital expenditure phasing across the Swedish data center market.
Segment Analysis
By Data Center Size: Market Diversifies Beyond Mega-Scale
Massive data centers captured 46.48% of the Swedish data center market share in 2024, as hyperscale clouds exploited economies of scale for AI training clusters. In value terms, the segment is equivalent to USD 1.84 billion and is expected to grow at a 5.2% annual rate through 2030. Large facilities are poised to eclipse that growth, advancing at a 7.10% CAGR as enterprises, fintechs, and content providers adopt distributed topologies that strike a balance between latency and cost. The Sweden data center market size for large sites is expected to exceed USD 2 billion by 2030, indicating an operator preference for 20-40 MW blocks that can be replicated regionally without overloading local grid nodes.
Mid-scale installations cater to regulated industries seeking dedicated halls within multi-tenant campuses, while small and edge builds serve smart factories and 5G micro-cell backhaul. Mega campuses exceeding 100 MW remain essential for GPU clusters, but face longer permitting lead times, prompting some builders to stage capacity in 25 MW increments. EcoDataCenter’s Borlänge project exemplifies the hybrid model: a 150 MW plan divided into three phases, each accompanied by heat sales agreements that ensure municipal offtake. These dynamics confirm that right-sizing across geography is becoming the dominant planning logic inside the Sweden data center market.

Note: Segment shares of all individual segments available upon report purchase
By Tier Type: Premium Uptime Retains Pricing Power
Tier 4 remains the cornerstone of mission-critical hosting, accounting for 61.14% of market revenue, and is expected to post an 8.30% CAGR by 2030. Financial exchanges, sovereign AI nodes, and telecom core networks rely on concurrently maintainable architectures, justifying capital outlays that are 15-20% higher than those for Tier 3 builds. As workloads migrate to containerized micro-services, even short outages threaten cascading failures across distributed clusters, reinforcing the Tier 4 value proposition in the Sweden data center industry.
Tier 3 supports mainstream enterprise lift-and-shift migrations, particularly for archival or compliance storage that can tolerate short maintenance windows. Tier 2 and Tier 1 continue to decline in share, limited to development labs or regional caching nodes. The Sweden data center market size differential between Tier 4 and lower tiers narrows as efficient modular UPS and lithium-ion battery systems cut incremental capex premiums. However, SLA expectations for AI inference platforms keep Tier 4 as the de facto standard for new hyperscale halls, ensuring revenues track above overall market averages.
By Data Center Type: Hyperscale Commands Spend; Colocation Gains Flexibility
Hyperscale/self-built facilities delivered 51.10% of Sweden's data center market revenue in 2024, and that share will remain steady as clouds internalize massive GPU demand. Capex plans tabled by Microsoft and AWS alone translate into an additional 300 MW of committed IT load by 2030. Colocation wholesale suites benefit from enterprises carving out sovereign zones within larger campuses, resulting in a 6.5% annual growth rate for utilized colocation racks. Retail colocation is experiencing a renaissance driven by fintech start-ups leveraging the interconnectivity density within Stockholm’s Stokab grid.
Edge and enterprise data centers aim to achieve latency targets of under 5 ms for high-frequency trading and AR/VR content streams. The Sweden data center market size for enterprise sites, although smaller, advances at a rate of 4.8% annually as remote work and security regulations keep certain workloads behind dedicated firewalls. Combined, these trends reinforce a balanced ecosystem where hyperscale anchors capacity while service-provider colocation supplies flexibility to mid-market tenants.
Note: Segment shares of all individual segments available upon report purchase
By End User: BFSI Trajectory Outpaces Technology Core
IT and telecom organizations retained 55.74% revenue in 2024, reflecting Sweden’s long-standing strengths in network equipment and digital services. Nevertheless, BFSI workloads are accelerating at a 9.18% CAGR, driven by real-time payment rails, algorithmic trading, and RegTech reporting that require ultra-low latency and sovereign data residency. The Sweden data center market size allocated to BFSI will top USD 1.3 billion by 2030, underpinned by joint AI compute pools funded by the Wallenberg-led consortium.
Media and entertainment expand with cloud post-production pipelines, while manufacturing embraces industrial IoT, creating pockets of edge demand in brownfield plants. Government cloud migration accelerates under Sweden’s Digitalization Strategy 2025-2030, channeling sensitive workloads into domestic sovereign environments. Telecom retains share via 5G core virtualization, but growth moderates as network densification plateaus.
Geography Analysis
Stockholm dominated the Swedish data center market with a 36.47% share, thanks to its unmatched carrier density, two internet exchange points, and proximity to financial users. Yet capacity growth tilts to Rest of Sweden at an 11.22% CAGR as developers chase low-cost hydro, cheaper land, and pre-zoned industrial parks. Luleå, Boden, and Västerbotten host new builds advertised at sub-1.1 PUE benchmarks owing to ambient temperatures that enable free cooling most of the year. Stockholm remains Sweden’s primary data center nucleus, hosting 115+ carriers, two IXPs, and the majority of financial trading engines that demand sub-millisecond round-trip times. Its share of the Sweden data center market size reached USD 1.44 billion in 2024 and will edge toward USD 2.2 billion by 2030, even as expansion space inside the city core becomes scarce. Inter-campus fiber routes from Stokab keep intra-metro latency below 0.2 ms, a key requirement for high-frequency trading desks and multi-cloud interconnection nodes.
Northern Sweden increasingly serves hyperscale mega halls that crave cheap renewable power and free cooling. Meta’s Luleå site, operational since 2013, validated Arctic designs and paved the way for the atNorth and EcoDataCenter projects now emerging in Boden and Östersund. Developers quote power prices under EUR 0.03/kWh after tax rebates, enabling lower all-in costs than those in Frankfurt or Amsterdam, even after accounting for long-haul fiber. Grid upgrades under Svenska kraftnät’s “North to South” program will add 3 GW of transfer capacity by 2032, partially easing connection queue constraints that today slow some northern expansions.
Central and southern provinces, notably Strängnäs, Västerås, and Katrineholm, form an intermediate ring favored by AWS and Brookfield for availability-zone diversity while maintaining metro latency under 10 ms to Stockholm. These locales offer brownfield industrial plots, existing 130 kV substations, and municipal eagerness to repurpose waste heat for residential grids. As a result, the Rest of Sweden segment of the Swedish data center market is expected to more than double from USD 2.5 billion in 2025 to USD 5.6 billion in 2030, providing geographic redundancy that aligns with EU-level resilience guidelines.
Competitive Landscape
Global cloud incumbents and regional sustainability specialists shape a moderately concentrated arena. Microsoft, AWS, Meta, and Digital Realty collectively controlled just over 45% of the installed IT load in 2024, leveraging their balance-sheet strength to pre-purchase grid capacity and secure long-term PPAs.[4]Bloomberg News, “Brookfield to Build 750 MW Swedish Data Center Hub,” bloomberg.com Brookfield’s entry amplifies capital intensity, with a USD 10 billion multi-phase campus that will eventually equal the combined footprint of Sweden’s next three largest operators. Local champion EcoDataCenter differentiates through 100% renewable sourcing and heat-recovery monetization, underpinning EUR 600 million of fresh financing in early 2025.
Strategic moves highlight defense of scale and sustainability. Microsoft signed a 10-year PPA with Vattenfall for hydro-backed guarantees of origin and completed AI-optimized hall retrofits that raise rack power densities to 70 kW. AWS deployed modular “snow” containers at Eskilstuna to accelerate capacity while full builds progress, demonstrating flexible staging that keeps ahead of demand spikes. atNorth scaled its Stockholm site by 11 MW, focusing on HPC leasing for media-rendering firms.
Competition now extends to sovereign AI compliance. The Wallenberg consortium’s NVIDIA DGX rollout offers enterprises a regulated alternative to U.S. clouds, prompting hyperscalers to emphasize sovereign-key escrow and local-only data planes. Colocation providers respond by bundling audit-ready compliance reporting tied to EU sustainability KPIs, carving out service niches. Collectively, these tactics stabilize pricing while preserving sufficient differentiation to sustain investment flows into the Swedish data center market.
Sweden Data Center Industry Leaders
-
Microsoft Corporation
-
Amazon Web Services, Inc.
-
EcoDataCenter
-
Meta Platforms, Inc.
-
Bahnhof AB
- *Disclaimer: Major Players sorted in no particular order
Recent Industry Developments
- September 2025: Brookfield is committed to a 750 MW campus in Strängnäs with total spend approaching USD 10 billion.
- May 2025: A consortium of AstraZeneca, Ericsson, Saab, SEB, and Wallenberg Investments partnered with NVIDIA to deploy two DGX SuperPODs, forming Sweden’s largest enterprise AI system.
- February 2025: The Swedish government endorsed the AI Commission’s roadmap, allotting SEK 2.5 billion per year until 2029 for national AI compute capacity.
- January 2025: EcoDataCenter secured EUR 600 million in financing to build its Borlänge mega campus, scheduled to open in Q4 2025.
Sweden Data Center Market Report Scope
Stockholm are covered as segments by Hotspot. Large, Massive, Medium, Mega, Small are covered as segments by Data Center Size. Tier 1 and 2, Tier 3, Tier 4 are covered as segments by Tier Type. Non-Utilized, Utilized are covered as segments by Absorption.| Large |
| Massive |
| Medium |
| Mega |
| Small |
| Tier 1 and 2 |
| Tier 3 |
| Tier 4 |
| Hyperscale / Self-built | ||
| Enterprise / Edge | ||
| Colocation | Non-Utilised | |
| Utilised | Retail Colocation | |
| Wholesale Colocation | ||
| BFSI |
| IT and ITES |
| E-Commerce |
| Government |
| Manufacturing |
| Media and Entertainment |
| Telecom |
| Other End Users |
| Stockholm |
| Rest of Sweden |
| By Data Center Size | Large | ||
| Massive | |||
| Medium | |||
| Mega | |||
| Small | |||
| By Tier Type | Tier 1 and 2 | ||
| Tier 3 | |||
| Tier 4 | |||
| By Data Center Type | Hyperscale / Self-built | ||
| Enterprise / Edge | |||
| Colocation | Non-Utilised | ||
| Utilised | Retail Colocation | ||
| Wholesale Colocation | |||
| By End User | BFSI | ||
| IT and ITES | |||
| E-Commerce | |||
| Government | |||
| Manufacturing | |||
| Media and Entertainment | |||
| Telecom | |||
| Other End Users | |||
| By Hotspot | Stockholm | ||
| Rest of Sweden | |||
Market Definition
- IT LOAD CAPACITY - The IT load capacity or installed capacity, refers to the amount of energy consumed by servers and network equipments placed in a rack installed. It is measured in megawatt (MW).
- ABSORPTION RATE - It denotes the extend to which the data center capacity has been leased out. For instance, a 100 MW DC has leased out 75 MW, then absorption rate would be 75%. It is also referred as utilization rate and leased-out capacity.
- RAISED FLOOR SPACE - It is an elevated space build over the floor. This gap between the original floor and the elevated floor is used to accommodate wiring, cooling, and other data center equipment. This arrangement assist in having proper wiring and cooling infrastructure. It is measured in square feet (ft^2).
- DATA CENTER SIZE - Data Center Size is segmented based on the raised floor space allocated to the data center facilities. Mega DC - # of Racks must be more than 9000 or RFS (raised floor space) must be more than 225001 Sq. ft; Massive DC - # of Racks must be in between 9000 and 3001 or RFS must be in between 225000 Sq. ft and 75001 Sq. ft; Large DC - # of Racks must be in between 3000 and 801 or RFS must be in between 75000 Sq. ft and 20001 Sq. ft; Medium DC # of Racks must be in between 800 and 201 or RFS must be in between 20000 Sq. ft and 5001 Sq. ft; Small DC - # of Racks must be less than 200 or RFS must be less than 5000 Sq. ft.
- TIER TYPE - According to Uptime Institute the data centers are classified into four tiers based on the proficiencies of redundant equipment of the data center infrastructure. In this segment the data center are segmented as Tier 1,Tier 2, Tier 3 and Tier 4.
- COLOCATION TYPE - The segment is segregated into 3 categories namely Retail, Wholesale and Hyperscale Colocation service. The categorization is done based on the amount of IT load leased out to potential customers. Retail colocation service has leased capacity less than 250 kW; Wholesale colocation services has leased capacity between 251 kW and 4 MW and Hyperscale colocation services has leased capacity more than 4 MW.
- END CONSUMERS - The Data Center Market operates on a B2B basis. BFSI, Government, Cloud Operators, Media and Entertainment, E-Commerce, Telecom and Manufacturing are the major end-consumers in the market studied. The scope only includes colocation service operators catering to the increasing digitalization of the end-user industries.
| Keyword | Definition |
|---|---|
| Rack Unit | Generally referred as U or RU, it is the unit of measurement for the server unit housed in the racks in the data center. 1U is equal to 1.75 inches. |
| Rack Density | It defines the amount of power consumed by the equipment and server housed in a rack. It is measured in kilowatt (kW). This factor plays a critical role in data center design and, cooling and power planning. |
| IT Load Capacity | The IT load capacity or installed capacity, refers to the amount of energy consumed by servers and network equipment placed in a rack installed. It is measured in megawatt (MW). |
| Absorption Rate | It denotes how much of the data center capacity has been leased out. For instance, if a 100 MW DC has leased out 75 MW, then the absorption rate would be 75%. It is also referred to as utilization rate and leased-out capacity. |
| Raised Floor Space | It is an elevated space built over the floor. This gap between the original floor and the elevated floor is used to accommodate wiring, cooling, and other data center equipment. This arrangement assists in having proper wiring and cooling infrastructure. It is measured in square feet/meter. |
| Computer Room Air Conditioner (CRAC) | It is a device used to monitor and maintain the temperature, air circulation, and humidity inside the server room in the data center. |
| Aisle | It is the open space between the rows of racks. This open space is critical for maintaining the optimal temperature (20-25 °C) in the server room. There are primarily two aisles inside the server room, a hot aisle and a cold aisle. |
| Cold Aisle | It is the aisle wherein the front of the rack faces the aisle. Here, chilled air is directed into the aisle so that it can enter the front of the racks and maintain the temperature. |
| Hot Aisle | It is the aisle where the back of the racks faces the aisle. Here, the heat dissipated from the equipment’s in the rack is directed to the outlet vent of the CRAC. |
| Critical Load | It includes the servers and other computer equipment whose uptime is critical for data center operation. |
| Power Usage Effectiveness (PUE) | It is a metric which defines the efficiency of a data center. It is calculated by: (𝑇𝑜𝑡𝑎𝑙 𝐷𝑎𝑡𝑎 𝐶𝑒𝑛𝑡𝑒𝑟 𝐸𝑛𝑒𝑟𝑔𝑦 𝐶𝑜𝑛𝑠𝑢𝑚𝑝𝑡𝑖𝑜𝑛)/(𝑇𝑜𝑡𝑎𝑙 𝐼𝑇 𝐸𝑞𝑢𝑖𝑝𝑚𝑒𝑛𝑡 𝐸𝑛𝑒𝑟𝑔𝑦 𝐶𝑜𝑛𝑠𝑢𝑚𝑝𝑡𝑖𝑜𝑛). Further, a data center with a PUE of 1.2-1.5 is considered highly efficient, whereas, a data center with a PUE >2 is considered highly inefficient. |
| Redundancy | It is defined as a system design wherein additional component (UPS, generators, CRAC) is added so that in case of power outage, equipment failure, the IT equipment should not be affected. |
| Uninterruptible Power Supply (UPS) | It is a device that is connected in series with the utility power supply, storing energy in batteries such that the supply from UPS is continuous to IT equipment even during utility power is snapped. The UPS primarily supports the IT equipment only. |
| Generators | Just like UPS, generators are placed in the data center to ensure an uninterrupted power supply, avoiding downtime. Data center facilities have diesel generators and commonly, 48-hour diesel is stored in the facility to prevent disruption. |
| N | It denotes the tools and equipment required for a data center to function at full load. Only "N" indicates that there is no backup to the equipment in the event of any failure. |
| N+1 | Referred to as 'Need plus one', it denotes the additional equipment setup available to avoid downtime in case of failure. A data center is considered N+1 when there is one additional unit for every 4 components. For instance, if a data center has 4 UPS systems, then for to achieve N+1, an additional UPS system would be required. |
| 2N | It refers to fully redundant design wherein two independent power distribution system is deployed. Therefore, in the event of a complete failure of one distribution system, the other system will still supply power to the data center. |
| In-Row Cooling | It is the cooling design system installed between racks in a row where it draws warm air from the hot aisle and supplies cool air to the cold aisle, thereby maintaining the temperature. |
| Tier 1 | Tier classification determines the preparedness of a data center facility to sustain data center operation. A data center is classified as Tier 1 data center when it has a non-redundant (N) power component (UPS, generators), cooling components, and power distribution system (from utility power grids). The Tier 1 data center has an uptime of 99.67% and an annual downtime of <28.8 hours. |
| Tier 2 | A data center is classified as Tier 2 data center when it has a redundant power and cooling components (N+1) and a single non-redundant distribution system. Redundant components include extra generators, UPS, chillers, heat rejection equipment, and fuel tanks. The Tier 2 data center has an uptime of 99.74% and an annual downtime of <22 hours. |
| Tier 3 | A data center having redundant power and cooling components and multiple power distribution systems is referred to as a Tier 3 data center. The facility is resistant to planned (facility maintenance) and unplanned (power outage, cooling failure) disruption. The Tier 3 data center has an uptime of 99.98% and an annual downtime of <1.6 hours. |
| Tier 4 | It is the most tolerant type of data center. A Tier 4 data center has multiple, independent redundant power and cooling components and multiple power distribution paths. All IT equipment are dual powered, making them fault tolerant in case of any disruption, thereby ensuring interrupted operation. The Tier 4 data center has an uptime of 99.74% and an annual downtime of <26.3 minutes. |
| Small Data Center | Data center that has floor space area of ≤ 5,000 Sq. ft or the number of racks that can be installed is ≤ 200 is classified as a small data center. |
| Medium Data Center | Data center which has floor space area between 5,001-20,000 Sq. ft, or the number of racks that can be installed is between 201-800, is classified as a medium data center. |
| Large Data Center | Data center which has floor space area between 20,001-75,000 Sq. ft, or the number of racks that can be installed is between 801-3,000, is classified as a large data center. |
| Massive Data Center | Data center which has floor space area between 75,001-225,000 Sq. ft, or the number of racks that can be installed is between 3001-9,000, is classified as a massive data center. |
| Mega Data Center | Data center that has a floor space area of ≥ 225,001 Sq. ft or the number of racks that can be installed is ≥ 9001 is classified as a mega data center. |
| Retail Colocation | It refers to those customers who have a capacity requirement of 250 kW or less. These services are majorly opted by small and medium enterprises (SMEs). |
| Wholesale Colocation | It refers to those customers who have a capacity requirement between 250 kW to 4 MW. These services are majorly opted by medium to large enterprises. |
| Hyperscale Colocation | It refers to those customers who have a capacity requirement greater than 4 MW. The hyperscale demand primarily originates from large-scale cloud players, IT companies, BFSI, and OTT players (like Netflix, Hulu, and HBO+). |
| Mobile Data Speed | It is the mobile internet speed a user experiences via their smartphones. This speed is primarily dependent on the carrier technology being used in the smartphone. The carrier technologies available in the market are 2G, 3G, 4G, and 5G, where 2G provides the slowest speed while 5G is the fastest. |
| Fiber Connectivity Network | It is a network of optical fiber cables deployed across the country, connecting rural and urban regions with high-speed internet connection. It is measured in kilometer (km). |
| Data Traffic per Smartphone | It is a measure of average data consumption by a smartphone user in a month. It is measured in gigabyte (GB). |
| Broadband Data Speed | It is the internet speed that is supplied over the fixed cable connection. Commonly, copper cable and optic fiber cable are used in both residential and commercial use. Here, optic cable fiber provides faster internet speed than copper cable. |
| Submarine Cable | A submarine cable is a fiber optic cable laid down at two or more landing points. Through this cable, communication and internet connectivity between countries across the globe is established. These cables can transmit 100-200 terabits per second (Tbps) from one point to another. |
| Carbon Footprint | It is the measure of carbon dioxide generated during the regular operation of a data center. Since, coal, and oil & gas are the primary source of power generation, consumption of this power contributes to carbon emissions. Data center operators are incorporating renewable energy sources to curb the carbon footprint emerging in their facilities. |
Research Methodology
Mordor Intelligence follows a four-step methodology in all our reports.
- Step-1: Identify Key Variables: In order to build a robust forecasting methodology, the variables and factors identified in Step-1 are tested against available historical market numbers. Through an iterative process, the variables required for market forecast are set and the model is built on the basis of these variables.
- Step-2: Build a Market Model: Market-size estimations for the forecast years are in nominal terms. Inflation is not a part of the pricing, and the average selling price (ASP) is kept constant throughout the forecast period for each country.
- Step-3: Validate and Finalize: In this important step, all market numbers, variables and analyst calls are validated through an extensive network of primary research experts from the market studied. The respondents are selected across levels and functions to generate a holistic picture of the market studied.
- Step-4: Research Outputs: Syndicated Reports, Custom Consulting Assignments, Databases & Subscription Platforms


