
Sustainable Packaging Market Size and Share
Market Overview
| Study Period | 2020 - 2031 |
|---|---|
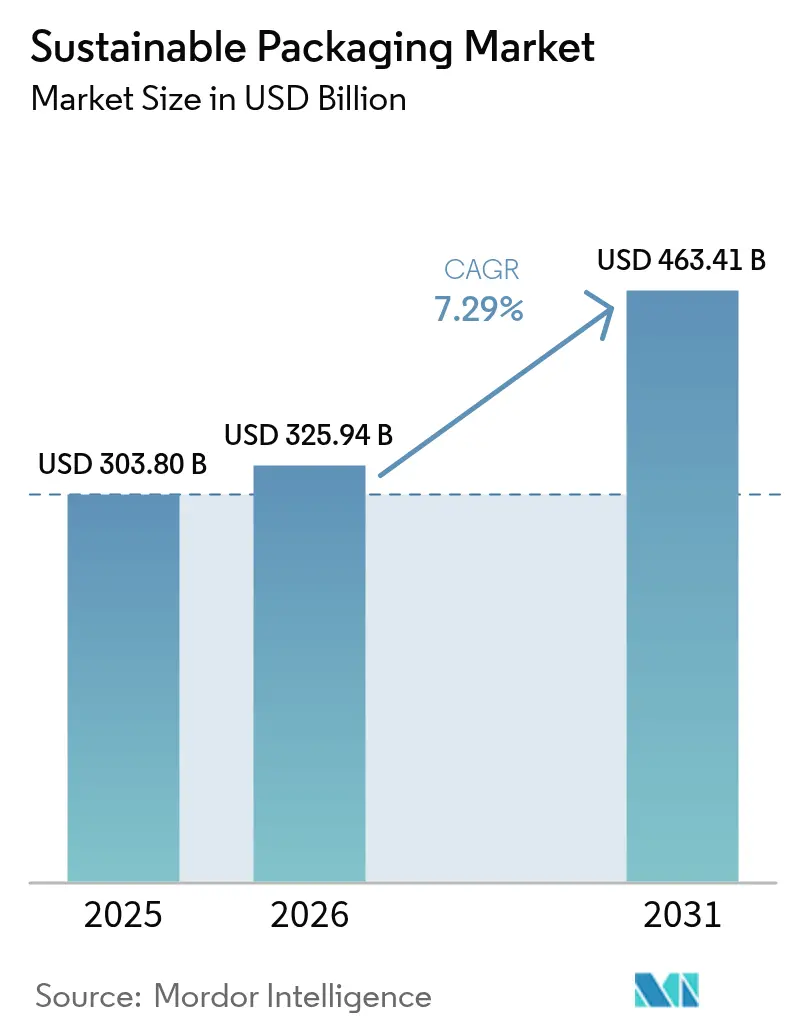
| Market Size (2026) | USD 325.94 Billion |
| Market Size (2031) | USD 463.41 Billion |
| Growth Rate (2026 - 2031) | 7.29 % |
| Fastest Growing Market | Asia Pacific |
| Largest Market | Europe |
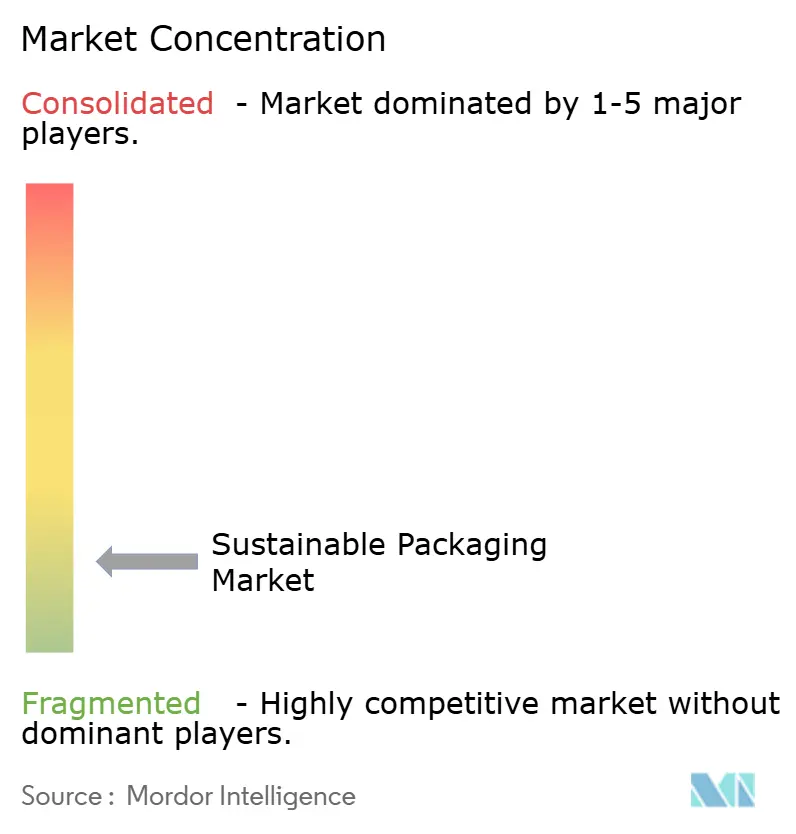
| Market Concentration | Low |
Major Players *Disclaimer: Major Players sorted in no particular order Image © Mordor Intelligence. Reuse requires attribution under CC BY 4.0. | |
Sustainable Packaging Market Analysis by Mordor Intelligence
The sustainable packaging market size was valued at USD 303.80 billion in 2025 and estimated to grow from USD 325.94 billion in 2026 to reach USD 463.41 billion by 2031, at a CAGR of 7.29% during the forecast period (2026-2031). Momentum is anchored in converging Extended Producer Responsibility (EPR) regulations that now span 63 countries, eliminating regulatory arbitrage and unlocking cross-border scale efficiencies. Brand commitments to minimum recycled-content thresholds, rapid progress in chemical recycling technologies, and rising e-commerce volumes that demand packaging right-sizing are accelerating capital deployment toward circular solutions. Venture funding into mycelium and seaweed-based substrates, coupled with AI-enabled sortation that improves material yields, is narrowing the cost gap between recycled and virgin feedstocks. Simultaneously, strategic mergers—such as the Amcor–Berry Global tie-up—are consolidating research and development resources to speed commercialization of next-generation formats.
Key Report Takeaways
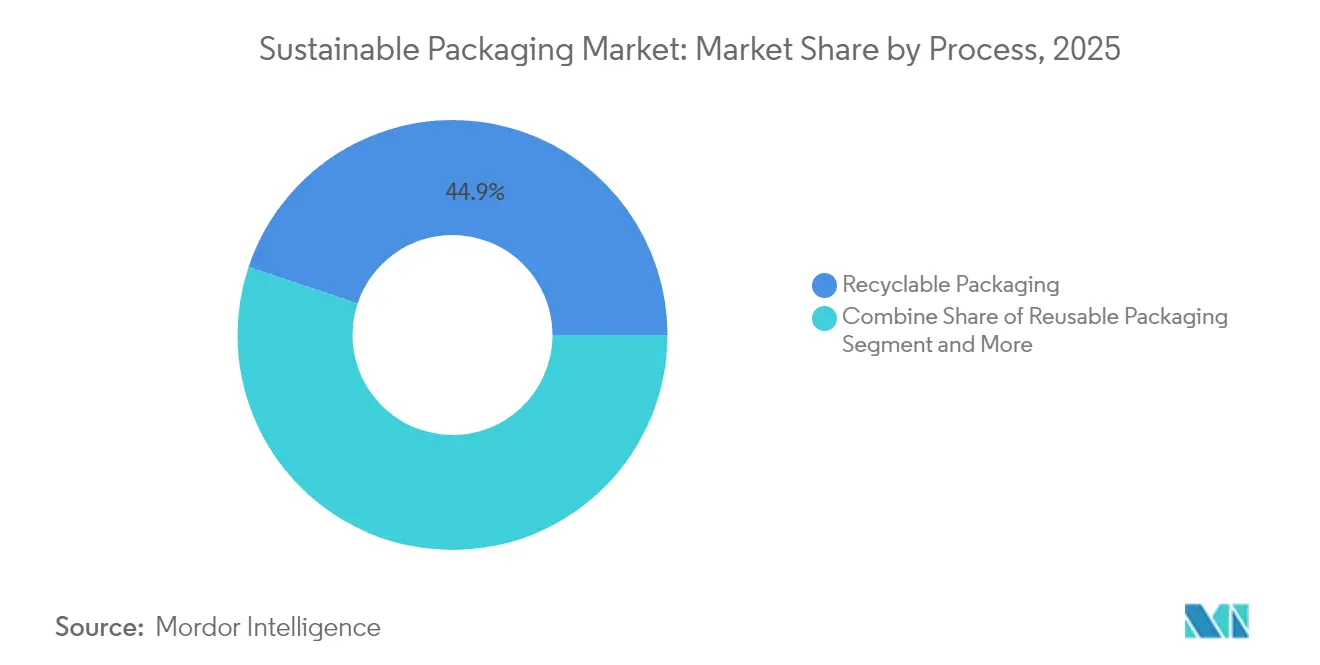
- By process, recyclable solutions maintained a 44.88% revenue share in 2025, while compostable and biodegradable formats are expanding at a 12.32% CAGR to 2031.
- By material, paper and paperboard led with 39.96% of the sustainable packaging market share in 2025; plant-based materials are forecast to grow at 11.21% CAGR through 2031.
- By packaging format, rigid solutions held 54.64% share in 2025, whereas flexible packaging is projected to advance at 8.32% CAGR through 2031.
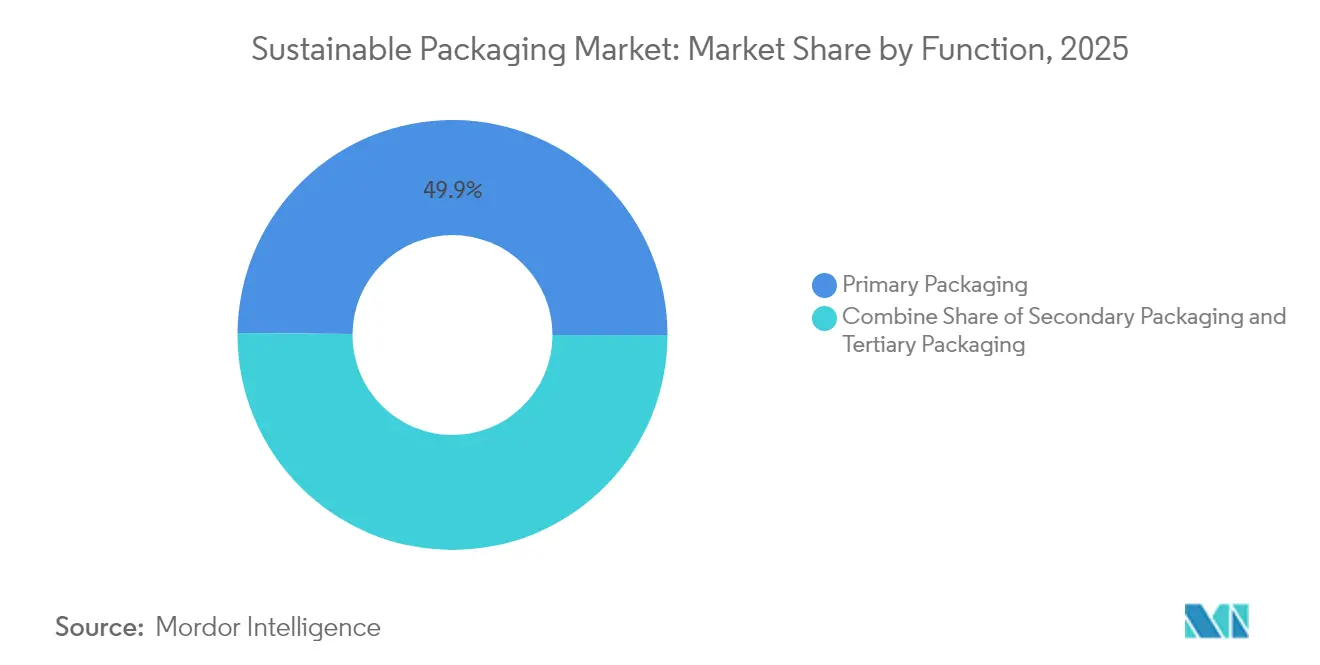
- By function, primary formats captured 49.85% of the sustainable packaging market size in 2025, while secondary packaging is growing fastest at 9.39% CAGR to 2031.
- By end user, food and beverage accounted for 37.78% of the sustainable packaging market size in 2025, yet e-commerce and retail are accelerating at a 12.63% CAGR toward 2031.
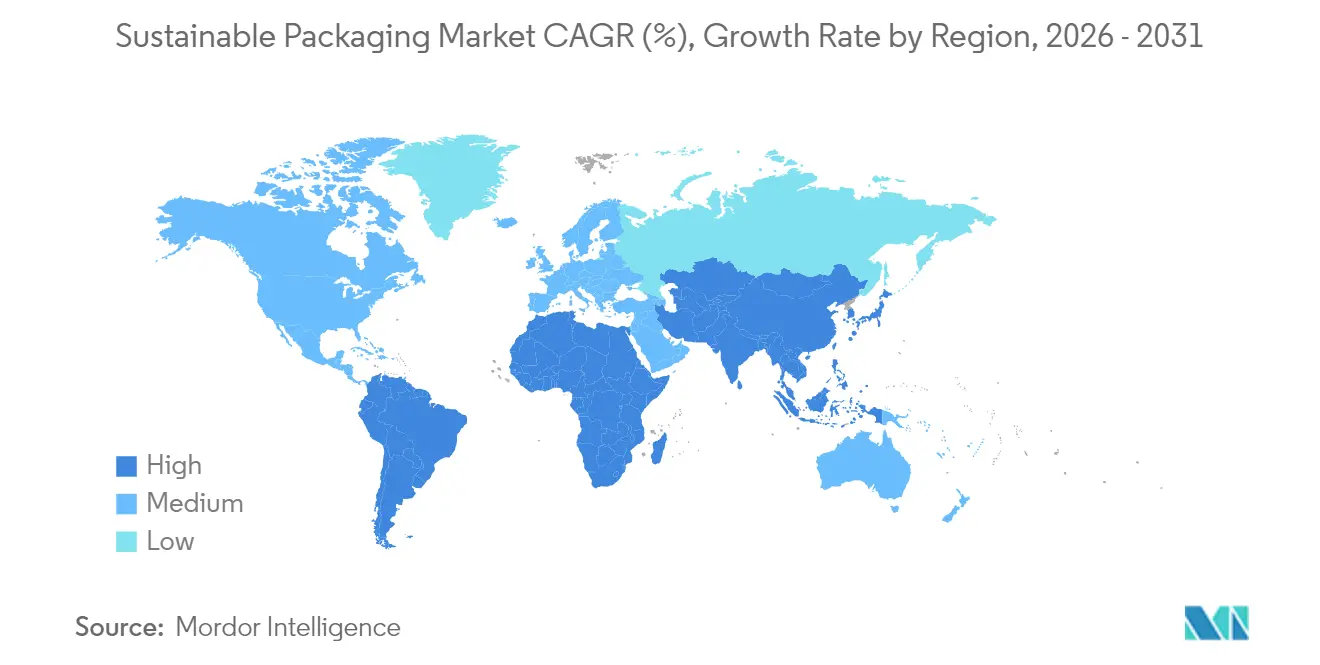
- By geography, Europe led with 34.18% market share in 2025; Asia-Pacific is expected to post the highest 11.05% CAGR through 2031.
Note: Market size and forecast figures in this report are generated using Mordor Intelligence’s proprietary estimation framework, updated with the latest available data and insights as of 2026.
Market Trends and Insights
Drivers Impact Analysis of Sustainable Packaging Market*
| Driver | (~) % Impact on CAGR Forecast | Geographic Relevance | Impact Timeline |
|---|---|---|---|
| EPR laws surge in OECD and BRICS markets | +1.8% | Global, early rollout in EU & North America | Medium term (2-4 years) |
| Brand pledges for ≥25% PCR content | +1.2% | North America & EU | Short term (≤ 2 years) |
| Retail take-back & reuse pilots | +0.9% | North America, EU, expanding to APAC | Medium term (2-4 years) |
| AI-enabled sortation boosts recycling yields | +0.7% | Developed markets worldwide | Long term (≥ 4 years) |
| Food-grade chemical recycling for polyolefins | +0.6% | North America & EU | Long term (≥ 4 years) |
| Mycelium & seaweed packaging innovation | +0.4% | EU & North America | Long term (≥ 4 years) |
| Source: Mordor Intelligence | |||


Extended Producer-Responsibility Laws Create Compliance Convergence
Converging EPR mandates in 63 jurisdictions are dismantling regulatory fragmentation. The European Union’s Packaging and Packaging Waste Regulation, effective February 2025, sets 30% recycled-content targets for PET food packaging and bans PFAS, prompting similar frameworks across OECD and BRICS economies. [1]O’Keeffe, Hazel, “The New EU Packaging and Packaging Waste Regulation – Highlights and Challenges Ahead,” PackagingLaw.com, packaginglaw.com New Kenyan statutes mirror EU fee structures, while Oregon and Colorado require brand-funded Producer Responsibility Organizations from July 2025. Harmonized timelines let global brands deploy single-design solutions at scale, lowering compliance costs and accelerating adoption across the sustainable packaging market.
Brand Commitments Drive PCR Content Standardization Beyond Regulatory Minimums
Major consumer-goods firms now exceed legislation by pledging 25–50% post-consumer recycled (PCR) content portfolio-wide by 2030. Unilever’s 2025 goal for all packaging to be recyclable, reusable, or compostable and Amcor’s supply of 1,000 tons of recycled plastic for Cadbury wrappers exemplify voluntary targets setting de facto industry baselines. Standardized PCR measurement toolkits from the U.S. Plastics Pact streamline verification, catalyzing procurement clarity and fueling growth in the sustainable packaging market.
E-commerce Logistics Pilots Scale Reusable Packaging Systems
Amazon replaced 95% of North American plastic air pillows with curbside-recyclable paper and Walmart eliminated 2,000 tons of single-use plastic mailers, illustrating how shipping-volume leverage translates sustainability into lower unit costs. Retail take-back schemes integrate reverse logistics, giving rise to reusable packaging pools that circulate across e-commerce networks. Machine-learning-driven right-sizing further curtails material consumption, underpinning double-digit expansion of the sustainable packaging market.
AI-Enhanced Sortation Technologies Improve Recycling Economics
Machine-vision systems paired with NIR spectroscopy in European and U.S. materials-recovery facilities lift plastic identification accuracy and unlock 12 material streams, as seen at Sweden’s Site Zero and Ohio’s AMP ONE plants. California’s statute mandating 65% recycling of single-use packaging by 2032 incentivizes adoption, cutting contamination costs and narrowing price spreads between virgin and recycled resins. Higher yields widen PCR availability and reinforce the sustainable packaging market growth trajectory.
Restraints Impact Analysis of Sustainable Packaging Market*
| Restraint | (~) % Impact on CAGR Forecast | Geographic Relevance | Impact Timeline |
|---|---|---|---|
| Limited supply of food-grade PCR resins | -1.4% | North America & EU | Short term (≤ 2 years) |
| Inflation-driven cost premiums vs. virgin feedstocks | -0.8% | Global | Medium term (2-4 years) |
| Fragmented composting infrastructure | -0.6% | North America & APAC | Medium term (2-4 years) |
| Greenwashing litigation risk | -0.4% | Developed markets | Short term (≤ 2 years) |
| Source: Mordor Intelligence | |||
PCR Resin Supply Constraints Create Strategic Bottlenecks
Brand pledges now outstrip supply of clear, food-grade PCR. Declining milk volumes shrink the natural HDPE stream, inflating premiums and forcing import reliance that undercuts domestic reclaimers. This imbalance threatens timely fulfillment of regulatory quotas, slowing mass-market expansion of the sustainable packaging market.
Cost Premium Persistence Challenges Mass-Market Adoption
Recycled and bio-based substrates still trade at premiums to virgin polymers because of additional collection and processing costs, exacerbated by energy-price inflation.[2]Ecoplashk, “What is Post Consumer Resin (PCR) Plastic?” ecoplashk.com Volatile PCR prices complicate long-term procurement contracts, particularly for low-margin applications, tempering uptake within the sustainable packaging industry.
*Our forecasts treat driver/restraint impacts as directional, not additive. The impact forecasts reflect baseline growth, mix effects, and variable interactions.
Sustainable Packaging Market Segment Analysis
By Process:
Compostable Solutions Gain Momentum Amid Infrastructure GapsRecyclable formats retained a 44.88% share in 2025, yet compostable and biodegradable offerings are growing at a 12.32% CAGR, reflecting investor faith in biomaterials such as B’Zeos’ seaweed films. The sustainable packaging market size for compostables is riding demand from food-service and personal-care brands seeking solutions free from microplastic fragmentation. However, only 30% of U.S. municipalities have access to industrial composting sites, curbing near-term penetration. In response, the U.S. COMPOST Act proposes USD 2 billion in grants to expand capacity, which would directly lift diversion rates and long-run growth prospects.
Consumer confusion over end-of-life handling still triggers contamination in organic-waste streams, calling for clearer labeling and public-education campaigns. Anaerobic digestion has emerged as an alternate pathway, generating biogas revenue that improves project economics and partially offsets infrastructure shortfalls. With policy and processing gaps gradually closing, compostable formats are set to capture an expanding slice of the sustainable packaging market.


By Material Type:
Plant-Based Innovation Challenges Traditional DominancePaper and paperboard represented 39.96% of 2025 revenue owing to mature recycling systems and consumer trust. Plant-based substrates, however, are advancing at 11.21% CAGR, propelled by Stora Enso’s dry-forming fiber lines that cut water use by 75% and energy by 30%, boosting circularity credentials. The sustainable packaging market share of polyolefins is expected to contract gradually as PFAS bans and recycled-content rules intensify.
Advanced recycling breakthroughs, including Berkeley’s 260 °C vaporization process that converts polyethylene into feedstock with 98% recovery, enable food-grade loops and mitigate downcycling. Mycelium foams and wood-based PET replacements are expanding addressable use cases beyond niche segments, signaling a broader materials transition within the sustainable packaging market.
By Packaging Format:
Flexible Solutions Drive Efficiency GainsRigid structures held 54.64% of 2025 revenue. Yet flexible formats, posting an 8.32% CAGR, are eroding that lead as mono-material pouches and films combine barrier performance with recyclability. Amcor’s recyclable retort pouch eliminates aluminum layers and cuts lifecycle carbon by up to 60%. Such innovations reduce weight and emissions, amplifying total cost-of-ownership advantages.Huhtamaki’s 2024 launch of three mono-material solutions indicates accelerating pipeline depth. Meanwhile, rigid glass and metal remain entrenched in premium or refill channels where infinite recyclability and consumer perception of quality prevail. Overall, format substitution trends continue to shape the sustainable packaging market trajectory toward lighter, lower-carbon footprints.
By Function:
Secondary Packaging Emerges as Growth DriverPrimary packaging generated 49.85% of 2025 turnover. Secondary formats, expanding at 9.39% CAGR, are benefiting from e-commerce volume that rewards right-sized cartons and cushioning alternatives. Amazon’s algorithmic box-sizing slashed corrugate use and eliminated 95% of plastic pillows, lifting efficiency and reinforcing demand within the sustainable packaging market.
Vacuum bag maker Moda, acquired by Amcor, deploys AI to meter film length precisely, trimming waste during poultry and cheese packing operations. Regulatory focus on transport-packaging emissions further drives investment toward lighter yet robust secondary and tertiary solutions.
By End User:
E-commerce Transformation Accelerates AdoptionFood and beverage retained 37.78% of 2025 revenue but faces the fastest competitive encroachment from online retail, advancing 12.63% CAGR. The sustainable packaging market size for e-commerce formats benefits from high order volumes, enabling payback on machinery upgrades like paper mailer automation and reusable tote trials.
Luxury cosmetics house Estée Lauder reports 71% of packaging already meets “5 R” criteria and targets 100% by 2025, illustrating premium-segment pull through circular innovations. Pharmaceutical adoption of wood-based PET further diversifies the sustainable packaging industry customer base.
Geography Analysis
Europe Sustainable Packaging Market
Europe’s 34.18% revenue share in 2025 reflects its first-mover regulatory stance that has birthed mature recycling infrastructure and eco-design norms. EPR fee modulation by circularity performance incentivizes high-recycled-content packaging, reinforcing supplier innovation cycles. Harmonized deposit-return schemes streamline collection, making Europe the reference market for both advanced recycling pilots and bio-based material commercialization. Multinational brand headquarters located in the region further amplify demand density, ensuring the sustainable packaging market continues to test and scale breakthroughs locally.
APAC Sustainable Packaging Market
Asia-Pacific is on track for the fastest 11.05% CAGR thanks to tightening rules in Japan, South Korea, Australia, and pilot EPR frameworks in China and India. Japan’s recycled-plastic mandate effective 2024 and its positive list for food-contact recycled resins entering force in June 2025 unlock high-margin applications and spur domestic resin reprocessing investments. China’s evolving supervision policy for recycled plastics coupled with strong e-commerce growth accelerates volume uptake. Vietnam’s paper-packaging sector, projected at USD 3.5 billion by 2026, exemplifies regional expansion anchored in export-oriented manufacturing.
The Americas, MEA and Oceania Sustainable Packaging Market
North America benefits from state-level EPR adoption and aggressive voluntary commitments by consumer-goods leaders. Oregon, Colorado, and California programs fund curbside upgrades, boosting PCR feedstock availability and narrowing cost spreads. Greenwashing litigation—exemplified by Australia’s recent Clorox action—raises disclosure rigor, bolstering consumer trust and driving transparent supply chains. Middle East & Africa and South America remain nascent but show rapid policy convergence, opening white-space opportunities for early technology entrants as infrastructure scales.

Regulatory Landscape
Extended Producer Responsibility (EPR) and packaging design rules are converging across major markets, with the EU acting as a key reference point. Regulation (EU) 2025/40 on packaging and packaging waste entered into force on 11 February 2025 and applies from 12 August 2026, replacing the legacy directive-style framework with a directly applicable rulebook across Member States. The PPWR anchors enforceable requirements around recyclability and reusability (including packaging minimisation), sets recycled content targets for plastic packaging, and introduces recyclability performance grading milestones through 2038, increasing compliance pressure on multi-material formats and low-yield designs.
Outside the EU, producer responsibility obligations are tightening through updated national instruments and implementation guidance. In the United Kingdom, the Producer Responsibility Obligations (Packaging and Packaging Waste) (Amendment) Regulations 2025 came into force on 1 January 2026 under the Environment Act 2021, expanding producer obligations and reinforcing data, reporting, and funding expectations. Standard-setting and calculation methodologies are becoming a formal part of compliance planning in Europe, with the European Commission mandated (by 12 February 2026) to request an EU-wide standard on home compostability and (by 12 February 2027) to prepare harmonised standards for packaging minimisation calculations and to define minimum rotation numbers for reusable packaging. This sequence will shape how compostables and reuse systems are specified and audited.
Competitive Landscape
Innovation and Sustainability Drive Future Success
Success in the sustainable packaging market increasingly depends on companies' ability to innovate while maintaining cost competitiveness and meeting stringent environmental standards. Market leaders are investing heavily in developing new materials and technologies that can replace traditional packaging solutions while maintaining or improving functionality. Companies are also focusing on building strong relationships with end-users through collaborative development projects and customized solutions. The ability to scale up sustainable solutions while maintaining price competitiveness remains crucial, as does the capacity to adapt to evolving regulatory requirements and changing consumer preferences.
For new entrants and smaller players, success lies in identifying and exploiting specific market niches where they can offer unique value propositions. This includes developing specialized sustainable packaging solutions for specific industries or applications, or focusing on particular geographical markets where they can build a strong local presence. Companies must also carefully navigate the increasing regulatory pressure around packaging sustainability and recycling requirements, which can create both challenges and opportunities. The risk of substitution from alternative packaging solutions remains a constant consideration, driving the need for continuous innovation and improvement in sustainable packaging offerings. Building strong relationships with key stakeholders across the value chain, from raw material suppliers to end-users, is becoming increasingly important for long-term success in the market. Eco-friendly packaging companies and green packaging companies are at the forefront of these efforts, continuously innovating to meet consumer and regulatory demands.
Sustainable Packaging Industry Leaders
Amcor plc
Smurfit WestRock
Sonoco Products Company
Sealed Air Corporation
Mondi plc
- *Disclaimer: Major Players sorted in no particular order
Sustainable Packaging Market Companies Covered in this Report
- Amcor plc
- Smurfit WestRock Company
- Tetra Pak International SA
- Sonoco Products Company
- Sealed Air Corporation
- Mondi plc
- Huhtamaki Oyj
- BASF SE
- Ardagh Group SA
- Ball Corporation
- Crown Holdings Inc.
- Genpak LLC
- International Paper Company
- Stora Enso Oyj
- Graphic Packaging Holding Co.
- Uflex Ltd.
- Novolex Holdings Inc.
- Ecovative LLC

Market Opportunities and Future Outlook
Implementation-driven redesign cycles are creating opportunities in packaging formats that can meet tightening recyclability and minimisation tests while still delivering barrier and machine-compatibility requirements. The EU PPWR (Regulation (EU) 2025/40) applies from 12 August 2026 and includes packaging minimisation and harmonised labeling provisions, lifting demand for simpler material structures and verified end-of-life pathways. In practice, this is pointing toward mono-material flexible packs with higher PCR integration, paper-based barrier substitutions, and fiber-based trays that can run on existing sealing and forming equipment, reinforced by brand-led PCR thresholds and e-commerce right-sizing programs already being rolled out.
Capacity build-outs and technology scale-ups are also concentrating around fiber-based packaging and higher-performance paperboard, supporting substitution demand in foodservice, retail, and secondary packaging. In the United States, Genera completed a USD 340 million molded fiber packaging expansion in Vonore, Tennessee (over 30,000 tons annual capacity), and Sappi North America completed its USD 500 million Project Elevate at Somerset Mill (adding 520,000 short tons of SBS paperboard capacity), expanding supply for premium paper-based packaging applications. Alongside this, commercialization pathways are emerging for replacing mixed-material barriers, including Tetra Pak's April 2026 launch of a 1-litre aseptic carton with a paper-based barrier (90% renewable content) and Amcor's evaluation work with Kelpi on seaweed-based barrier coatings, while PCR supply constraints keep food-grade recycling partnerships and local resin upgrading investments central to procurement and product qualification decisions.
Recent Industry Developments in Sustainable Packaging Market
- July 2026: PureCycle Technologies and Mitsui & Co. announced a strategic partnership with RM TOHCELLO to bring recycled polypropylene into flexible packaging applications in Japan. The collaboration targets food and consumer packaging use cases that need consistent recycled feedstock quality, reinforcing supply-side readiness for recycled-content commitments.
- January 2025: Amcor and Berry Global announced an all-stock merger intended to create a larger global consumer-packaging platform and consolidate R&D resources around sustainability priorities. The tie-up increased scale in flexible and rigid packaging, supporting faster commercialization of recyclable and recycled-content structures across brand portfolios.
- November 2024: B Zeos raised EUR 5 million to scale seaweed-based compostable films and partnered with Nestle on pilot applications. The funding and pilot activity advanced non-fossil barrier and film concepts beyond lab-stage development, expanding the set of viable substrates for compostable and bio-based packaging formats.


Sustainable Packaging Market Report Scope and Research Methodology
Market Definition and Coverage
For this study, the sustainable packaging market covers packaging solutions sold to end users that are designed to reduce environmental impact through recyclable, reusable, compostable, or recycled content based designs, across major packaging materials and formats.
Scope exclusions: This sizing excludes non packaging sustainability services and most one off consulting projects that do not result in packaging materials or finished packaging revenue.
Segments Covered in This Report
- By Process
- Reusable Packaging
- Recyclable Packaging
- Compostable / Biodegradable Packaging
- Edible Packaging
- By Material Type
- Paper and Paperboard
- Plastics
- Glass
- Metal (Aluminum, Steel)
- Plant-based Materials (Bagasse, Mushroom, etc.)
- By Packaging Format
- Rigid
- Flexible
- By Function
- Primary Packaging
- Secondary Packaging
- Tertiary / Transport Packaging
- By End User
- Food and Beverage
- Pharmaceutical and Healthcare
- Cosmetics and Personal Care
- E-commerce and Retail
- Consumer Electronics
- Other End User
- By Geography
- North America
- United States
- Canada
- Mexico
- Europe
- Germany
- United Kingdom
- France
- Italy
- Spain
- Russia
- Rest of Europe
- Asia-Pacific
- China
- India
- Japan
- South Korea
- Australia and New Zealand
- Rest of Asia-Pacific
- Middle East and Africa
- Middle East
- United Arab Emirates
- Saudi Arabia
- Turkey
- Rest of Middle East
- Africa
- South Africa
- Nigeria
- Egypt
- Rest of Africa
- Middle East
- South America
- Brazil
- Argentina
- Rest of South America
- North America
Data Sources, Market Sizing, and Validation
Desk Research
Desk research was used to build the first layer of the market model and to align definitions that sound similar but can be counted differently. We reviewed public packaging and waste statistics, policy signals, and demand indicators, then translated them into measurable inputs that can be checked year to year.
Typical references included source types such as US EPA materials and recycling statistics, Eurostat packaging waste series, UN Comtrade trade flows for key packaging materials, and World Bank macro indicators to normalize demand across regions. We also used peer reviewed journals and patent databases to understand adoption direction for compostable and recyclable structures, followed by company filings, investor decks, and industry association updates to validate capacity additions and product positioning. Paid databases for company financials, news and financials, and shipment level import export views were used selectively to cross check revenue ranges and trade movements. These examples are not exhaustive, and other public sources were also used to collect data, validate assumptions, and clarify gaps.
Primary Interviews and Surveys
Primary work focused on packaging converters, raw material suppliers, brand owners, and channel participants that influence specification choices and price moves. We used interviews and structured surveys to test what buyers count as sustainable in real purchasing decisions, then confirmed volume shifts, price premiums, and substitution patterns across APAC, EMEA, and the Americas.
Distribution of primary research fieldwork respondents
| Company type | Respondent position | Region |
|---|---|---|
| Top tier: 26% | CXOs: 21% | APAC: 42% |
| Mid tier: 53% | Functional/Unit leaders: 34% | EMEA: 31% |
| Smaller Players: 21% | Managers: 45% | Americas: 27% |
Market-Sizing & Forecasting
Sizing starts with a top down build where packaging demand is reconstructed from end use consumption signals and packaging intensity, then filtered through the share that meets common sustainability criteria (recyclable, reusable, compostable, or recycled content). That model is stress tested using selective bottom up checks such as sampled price per kg or per unit times estimated volumes for key materials, plus channel feedback on mix shifts, before totals are adjusted.
To keep the model practical, we leaned on variables that can be tracked consistently, such as packaged food and beverage output trends, retail and e-commerce shipment growth, regulation driven material substitution rates, recycled resin and fiber availability, and observed price premium ranges for sustainable formats versus conventional options. When data is missing for smaller countries, we bridge gaps using proxy indicators like per capita packaging consumption, import reliance patterns, and similar market peer groups, then we recheck the implied volumes against capacity and trade direction.
Forecasting used scenario analysis supported by expert views, because policy timing, recycled feedstock constraints, and brand commitments can move the adoption curve faster or slower. Assumptions for volume growth and pricing were kept separate so inflation effects do not get confused with real adoption gains.
Data Validation & Update Cycle
Outputs are validated through multiple checks, including year over year variance review, cross verification against independent signals like packaging waste generation and recycling rates, and consistency checks between value growth and volume growth. When an anomaly shows up, the model is reopened, the driver is isolated (volume, mix, or price), and follow up calls are triggered with the most relevant respondent group.
Before sign off, the work goes through stepwise analyst reviews so that definitions, units, and currency treatment stay consistent across regions. Reports are refreshed annually, and interim updates are made when material events occur, such as regulation changes, major capacity additions, or sharp recycled feedstock price swings. Right before delivery, we do a final pass to ensure the latest public data points and market signals are reflected.
Mordor Intelligence's Sustainable Packaging Market Estimate Compared With Other Published Estimates
Published market values for sustainable packaging can differ even when the topic looks the same, because firms do not always use the same sustainability tests, price treatment, or timing for currency conversion. Differences also show up when one estimate follows a single base year snapshot, while another blends multiple years of inputs and then reports one rounded number.
In this study, the refresh cadence and currency timing are controlled tightly. Price logic is checked against observed recycled fiber and resin movements before finalizing the value series, which is why the 2026 figure reported by Mordor Intelligence can land above or below other public numbers depending on their update month and whether they smooth ASP changes across years.
Benchmark comparison
| Source | Market Size | Gaps in Research Methodology |
|---|---|---|
| Mordor Intelligence | USD 325.94 B (2026) | |
| Global Consultancy A | USD 272.93 B (2023) | Uses an earlier base year and may carry forward mix shares without fully revalidating the sustainable qualification filters each year, which can understate later value when sustainable adoption and pricing premiums rise. |
| Industry Research Group B | USD 314.23 B (2025) | Places the reference point in 2025 and applies a longer dated growth path, where the way price premiums are escalated and converted to USD can shift the reported value even if underlying volumes are similar. |
Overall, the spread is mostly explained by timing choices and how pricing and sustainability qualification are updated, not by a completely different demand pool. By keeping assumptions tied to observable inputs like packaged goods demand, recycled feedstock availability, and policy led substitution pace, the estimate stays traceable and repeatable from one refresh to the next.


Key Questions Answered in the Report
What is the current size of the sustainable packaging market?
The sustainable packaging market size is valued at USD 325.94 billion in 2026 and is projected to reach USD 463.41 billion by 2031.
Which region leads in market share today?
Europe holds the largest regional share at 34.18% thanks to early adoption of circular-economy regulations.
What segment is growing fastest by process?
Compostable and biodegradable packaging is expanding at a 12.32% CAGR through 2031, outpacing other process categories.
Why does flexible packaging gain traction?
Mono-material pouches cut material weight and improve recyclability, driving an 8.32% CAGR that exceeds rigid-format growth.
How are EPR laws influencing market growth?
Harmonized EPR frameworks across 63 countries standardize compliance requirements, enabling brands to scale a single package design globally and adding an estimated 1.8 percentage points to forecast CAGR.
What are the main bottlenecks hindering faster adoption?
Limited supplies of food-grade PCR resins and persistent cost premiums over virgin plastics remain key constraints, dampening near-term expansion.
Page last updated on:


 Your data is secure and never sold or shared.


