
Surveillance Radar Market Size and Share
Market Overview
| Study Period | 2020 - 2031 |
|---|---|
| Market Size (2026) | USD 14.04 Billion |
| Market Size (2031) | USD 22.9 Billion |
| Growth Rate (2026 - 2031) | 10.29% CAGR |
| Fastest Growing Market | Asia Pacific |
| Largest Market | North America |
| Market Concentration | Medium |
Major Players *Disclaimer: Major Players sorted in no particular order Image © Mordor Intelligence. Reuse requires attribution under CC BY 4.0. | |
Surveillance Radar Market Analysis by Mordor Intelligence
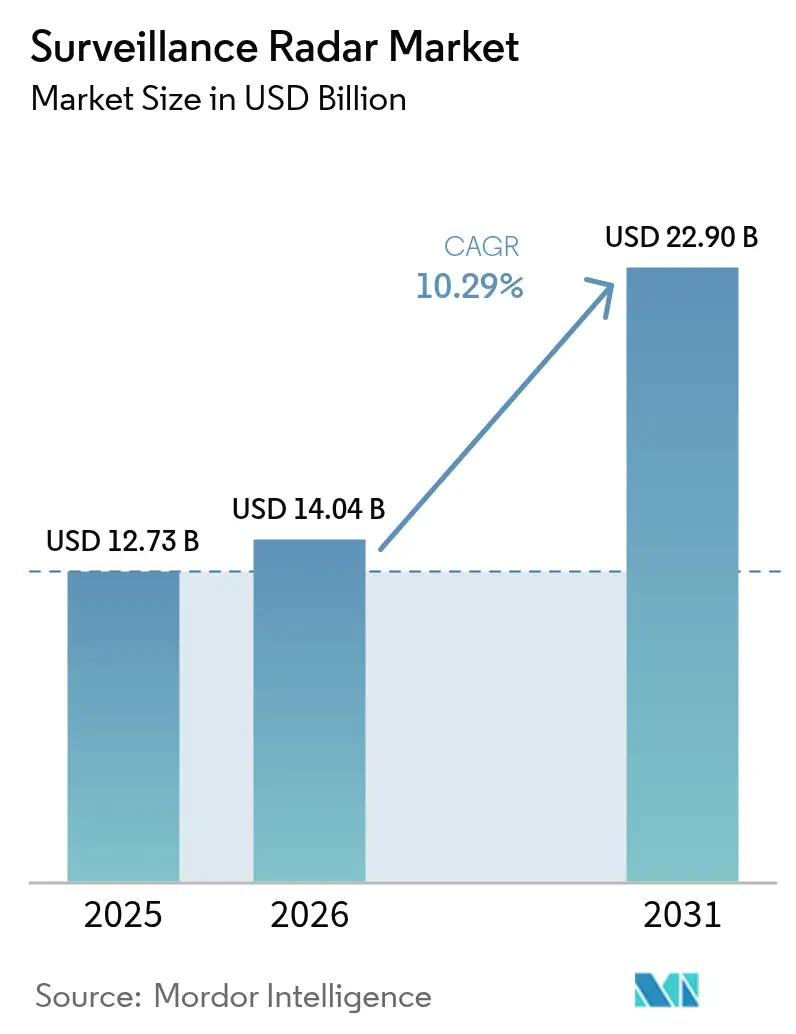
Surveillance radar market size in 2026 is estimated at USD 14.04 billion, growing from 2025 value of USD 12.73 billion with 2031 projections showing USD 22.9 billion, growing at 10.29% CAGR over 2026-2031. Heightened defense-modernization programs, rising border-security imperatives, and rapid progress in active electronically scanned array (AESA) technology are the primary forces behind this expansion. Nations are retiring legacy mechanically steered radars in favor of software-defined architectures that adapt to new threat signatures within milliseconds. Adopting AI-enabled autonomous target-recognition systems reduces operator workload and supports multi-domain operations. At the same time, gallium-nitride semiconductors are improving power density, range, and reliability while lowering size, weight, and cooling penalties.
Key Report Takeaways
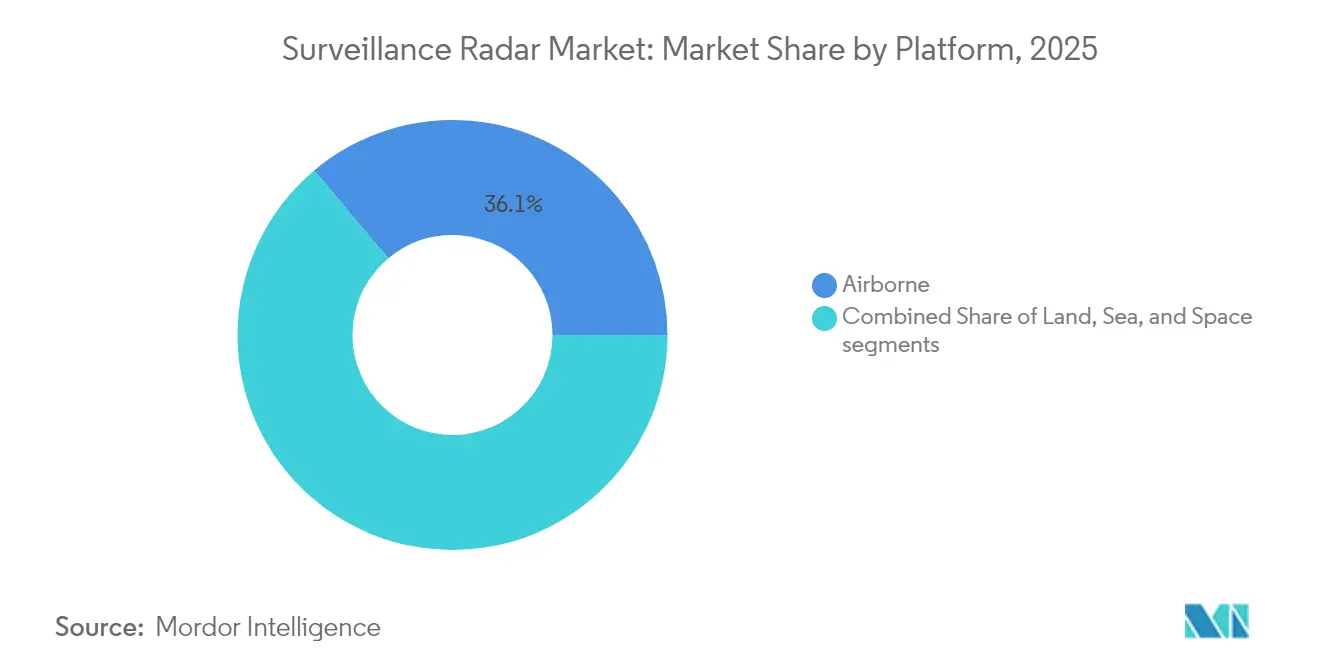
- By platform, airborne systems led with 36.12% revenue share in 2025; space-based platforms are forecasted to expand at a 9.47% CAGR to 2031.
- By component, antennas represented the largest 24.08% share in 2025, whereas digital-signal processors are projected to grow fastest at an 8.22% CAGR.
- By application, military uses controlled 68.95% of the surveillance radar market share in 2025, while commercial uses are set to grow at an 8.58% CAGR through 2031.
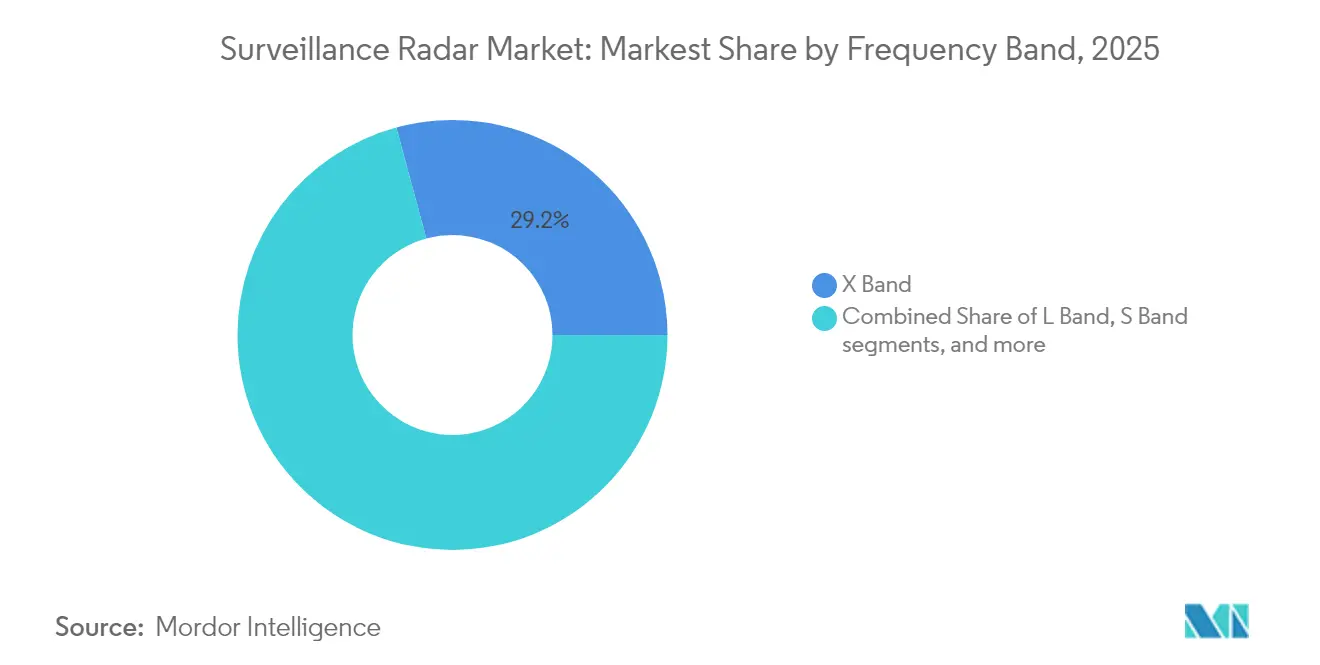
- By frequency band, X-band held 29.21% of the surveillance radar market size in 2025, whereas Ku/K-band systems are projected to rise at a 10.38% CAGR between 2026 and 2031.
- By range, long-range radars held a 41.88% share of the surveillance radar market in 2025; short-range units are poised for the fastest 8.63% CAGR.
- By radar dimension, 2-D systems dominated with a 46.10% share in 2025, while 4-D systems are set to expand at a 7.56% CAGR through 2031.
- By geography, North America commanded 35.12% revenue share in 2025, while Asia-Pacific is anticipated to register the highest 7.41% CAGR to 2031.
Note: Market size and forecast figures in this report are generated using Mordor Intelligence’s proprietary estimation framework, updated with the latest available data and insights as of 2026.
Global Surveillance Radar Market Trends and Insights
Drivers Impact Analysis*
| Driver | % Impact on CAGR Forecast | Geographic Relevance | Impact Timeline |
|---|---|---|---|
| Escalating defense budgets and fleet modernization | +2.8% | North America and Europe | Medium term (2-4 years) |
| Heightened border-security surveillance needs | +2.1% | APAC and Middle East | Short term (≤2 years) |
| Rapid adoption of AESA-based systems | +1.9% | North America and EU; expanding into APAC | Medium term (2-4 years) |
| AI-enabled autonomous target recognition | +1.4% | North America and EU; spill-over to APAC | Long term (≥4 years) |
| Proliferation of multi-static and passive radar networks | +1.2% | Europe and North America; selective APAC adoption | Long term (≥4 years) |
| UTM-grade lightweight radars for commercial drones | +1.0% | Global, early uptake in North America and Europe | Medium term (2-4 years) |
| Source: Mordor Intelligence | |||
Escalating Defense Budgets and Fleet Modernization
NATO allies have pledged to lift defense outlays toward 5% of GDP by 2035, a sizeable jump from the 2% guideline in 2024.[1]Euronews Staff, “NATO Allies Aim for 5 Percent of GDP on Defence by 2035,” euronews.com This expenditure shift unlocks multi-billion-dollar radar recapitalization programs, such as the US Air Force’s USD 472 million procurement of 19 TPY-4 systems scheduled for operational acceptance in 2028. Collective procurement—exemplified by Europe’s order of 1,000 Patriot GEM-T missiles—pools national budgets while harmonizing radar-integration requirements across the alliance. Capability-based planning models keep radar line items insulated even when total force-structure budgets fluctuate. As multi-domain doctrine matures, commanders prioritize resilient sensing architecture, securing steady allocations for next-generation radar.
Heightened Border-Security Surveillance Needs
Territorial disputes, migration flows, and narco-trafficking spur radar deployments outside conventional military theaters. Canada’s USD 48.4 million Polar Over-the-Horizon Radar contract safeguards Arctic approaches and complements broader NORAD modernization.[2]ATCO Ltd., “Polar Over-the-Horizon Radar Contract Awarded,” atco.com The Netherlands’ drone-detection radar donation to Ukraine underscores the fast crossover of civil surveillance technologies into active conflict zones. China’s counter-stealth installations on South China Sea reefs demonstrate how radar assets cement de facto borders. Operators now demand low-altitude cover, unmanned integration, and rapid cueing for interdiction forces, keeping near-term demand buoyant.
Rapid Adoption of AESA-Based Systems
Gallium-nitride AESA arrays deliver 360-degree coverage, jam-resilience, and software-defined mission re-role. Raytheon’s LTAMDS proves the concept and enters serial production with Milestone C approval in April 2025. Turkey’s integration of ASELSAN’s MURAD onto Bayraktar Akıncı unmanned aircraft validates AESA scalability for compact platforms.[3]Army Recognition, “USAF Contracts 19 TPY-4 Radars,” armyrecognition.com Northrop Grumman’s G/ATOR replaces five legacy sensors with a single AESA air-ground-maritime solution, cutting life-cycle costs and logistics tails. Modular architectures allow incremental software drops that insert new waveforms without redesigning hardware, translating into sustained update revenue streams.
AI-Enabled Autonomous Target Recognition
The data rate of modern radars reaches terabytes per sortie, overwhelming human analysts. Raytheon’s Cognitive Algorithm Deployment System embeds machine-learning classifiers that rank threats aboard F-16 processing chains with sub-second latency. Russia’s AI-enabled Nebo-SV mobile radar reportedly tracks objects at 600 km range and re-vectors anti-air assets autonomously. Predictive maintenance algorithms also reduce unscheduled downtime, extending mean time between failures and trimming ownership costs. Edge computing shifts processing to the sensor, lessening bandwidth loads on contested tactical networks and elevating tempo in joint all-domain operations.
Restraints Impact Analysis*
| Restraint | % Impact on CAGR Forecast | Geographic Relevance | Impact Timeline |
|---|---|---|---|
| High acquisition and lifecycle costs | -1.8% | Global, acute in emerging markets | Short term (≤2 years) |
| Spectrum congestion and regulatory limits | -1.2% | North America and Europe | Medium term (2-4 years) |
| Cyber-EW vulnerability of networked radars | -0.9% | NATO allies | Long term (≥4 years) |
| GaN semiconductor supply bottlenecks | -0.7% | Western manufacturers | Medium term (2-4 years) |
| Source: Mordor Intelligence | |||
High Acquisition and Lifecycle Costs
Raytheon’s LTAMDS has a unit price approaching USD 130 million, a threshold that strains even top-tier defense budgets.[4]Defense-Express Analysts, “LTAMDS Cost Analysis,” defense-express.com Over a 25-year service life, support, training, and periodic tech refreshes can triple the original purchase outlay. Smaller states pursue cost-sharing frameworks—Europe’s pooled Patriot buy being a prime example—to secure premium capability without a standalone capital burden. Modular open-systems architectures that insert commercial off-the-shelf components are gaining approval but must still have clear, stringent military qualifications, tempering the near-term impact on affordability.
Spectrum Congestion and Regulatory Limits
Civil 5G rollouts occupy mid-band frequencies long used by air-defense radars, forcing operators upward into Ka-band and beyond, where signal attenuation worsens. Lengthy national certification cycles—nine months for the US Air Force in 2024—delay the fielding of new systems. Automotive radar and small-UAV sensors exacerbate mutual interference, compelling the adoption of adaptive waveforms and cognitive sensing that hike development complexity. International harmonization lags, raising long-term uncertainty for multinational exercises and coalition operations.
*Our forecasts treat driver/restraint impacts as directional, not additive. The impact forecasts reflect baseline growth, mix effects, and variable interactions.
Segment Analysis
By Platform: Space Systems Drive Innovation
Space-based radars form the quickest-rising branch, sustaining a 9.47% CAGR on the back of the Deep Space Advanced Radar Capability program’s USD 200 million trilateral buildout. In value terms, the segment will add more than USD 2 billion to the surveillance radar market by 2031. Airborne platforms retained dominance with a 36.12% share in 2025, supported by General Atomics’ EagleEye integration, doubling Gray Eagle endurance while enhancing synthetic-aperture resolution. Land-based mobile radars deliver expeditionary flexibility for Army maneuver forces, whereas sea-based arrays integrate with combat-management suites to extend weapons engagement zones.
Platform priorities shift toward persistent, globally accessible surveillance unobstructed by geography or over-flight rights. China’s geosynchronous SAR satellite covers almost one-third of Earth’s surface continuously, exemplifying the strategic premium on orbital assets. Commercial constellations from Iceye and Capella Space inject fresh capacity, furnishing near-real-time tasking feeds for public and private customers. Concurrently, manned and unmanned airborne assets merge roles as modular radar pods migrate across airframes. The result is a multi-layered sensing architecture where cross-cueing between orbital, airborne, and ground sensors becomes routine, amplifying overall mission resilience.


By Component: Digital Signal Processors Lead Innovation
Digital-signal processors (DSPs) constitute the fastest-growing component class with an 8.22% CAGR, mirroring the AI workload rising within modern sensors. Antennas, at 24.08% share in 2025, represent the single largest cost driver in the surveillance radar market. Advancements in gallium-nitride front-ends offer a 5- 10x power-density uplift over gallium-arsenide predecessors, trimming cooling mass while boosting detection range. Transmit-receive modules now integrate analog-to-digital conversion on-chip, shrinking the RF path and simplifying calibration.
The surveillance radar market benefits from component miniaturization that enables insertion into attritable unmanned systems. MIT Lincoln Laboratory’s wideband selective-propagation project shows millimeter-wave radars executing long-range communication and precision sensing on one board. Power-amplifier breakthroughs cut thermal load, easing platform-level integration. Multi-mission designs that combine radar, electronic support, and satcom functions within a common aperture emerge as primary choices for procurement, bolstering recurring revenue for DSP and RF-chain suppliers.
By Application: Commercial Segments Accelerate
Military programs generated 68.95% of 2025 revenue; however, civilian uptake is pacing at an 8.58% CAGR as air-traffic authorities, energy firms, and smart-city consortia exploit radar for safety and efficiency gains. Germany’s air navigation service and HENSOLDT aim to certify passive radar for civil aviation by 2026, highlighting regulatory momentum. Drone-detection grids proliferate around airports, oil refineries, and sports venues, creating a high-volume, low-unit-cost sub-segment.
Beyond transportation, hydrometeorology agencies deploy C-band Doppler arrays for severe weather forecasting, while power utilities integrate medium-range radars to protect high-voltage corridors against low-flying aircraft. The FAA’s waiver for beyond-visual-line-of-sight drones equipped with onboard radar establishes a template that other civil aviation regulators are replicating. Consequently, commercial innovators enter the surveillance radar market armed with agile-development cultures and venture financing, challenging defense primes to realign their go-to-market strategies.
By Frequency Band: Ku/K Band Technologies Surge
The Ku/K-band slice is projected to add more than USD 4 billion to the surveillance radar market size by 2031, expanding at a 10.38% CAGR. Its finer beamwidth yields sub-meter resolution, a coveted attribute for counter-stealth missions and anomaly-detection imaging. X-band, by contrast, preserves its lead with 29.21% share because of entrenched naval and air-defense inventories.
Frequency agility is a hallmark of current procurement, with new builds sporting multi-band feed networks capable of hopping from S-band to Ku-band in a single pulse pattern. The surveillance radar market increasingly rewards vendors that deliver single-aperture solutions spanning wide frequency spectra, thereby shrinking topside footprint on congested superstructures. At the extreme, W-band concepts under test promise micro-Doppler signatures that can discern rotor blade counts or human gait, enabling ultra-fine classification for special-operations forces.
By Range: Short Range Systems Expand Rapidly
Systems under 50 km register the fastest 8.63% CAGR, driven by dense-urban drone monitoring, border fences, and campus-security skins. Meanwhile, strategic sensors above 200 km retained 41.88% market share in 2025, sustained by early-warning missions and ballistic-missile-defense programs such as the Pentagon’s Long Range Discrimination Radar, which demonstrated detection past 2,000 km in recent trials.
Urban-air-mobility corridors require radar that can de-conflict passenger e-VTOL craft at altitudes below 500 ft. Quick-install mast kits, powered by solar arrays, appeal to municipalities seeking mobile perimeter coverage for high-profile events. Conversely, medium-range fire-control radars bridge the gap for ground-based air-defense batteries, offering both area coverage and precision-cue hand-off to missile launchers. The surveillance radar market thus spans a spectrum where range is not an end but a tunable parameter matched to mission and terrain.
By Radar Dimension: 4-D Systems Enable Precision
Three-dimensional sets remain the workhorse, but 4-D radars—adding Doppler velocity to azimuth, elevation, and range—are scaling at a 7.56% CAGR. Improved micro-motion tracking lowers false alarms against birds and drones, saving interceptor missiles for genuine threats. Research published in MDPI’s Remote Sensing proved millimeter-wavelength, 4-D Doppler arrays tracking low-observable supersonic objects with high fidelity.
Demand is strongest among integrated air-and-missile-defense networks pursuing shoot-look-shoot engagement loops. Fusion with EO/IR sensors yields composite tracks that populate common operational pictures for joint command centers. Vendors able to field upgrade kits that elevate legacy 2-D units to 3-D or 4-D capability will capture retrofit budgets abundant among mid-tier economies.
Geography Analysis
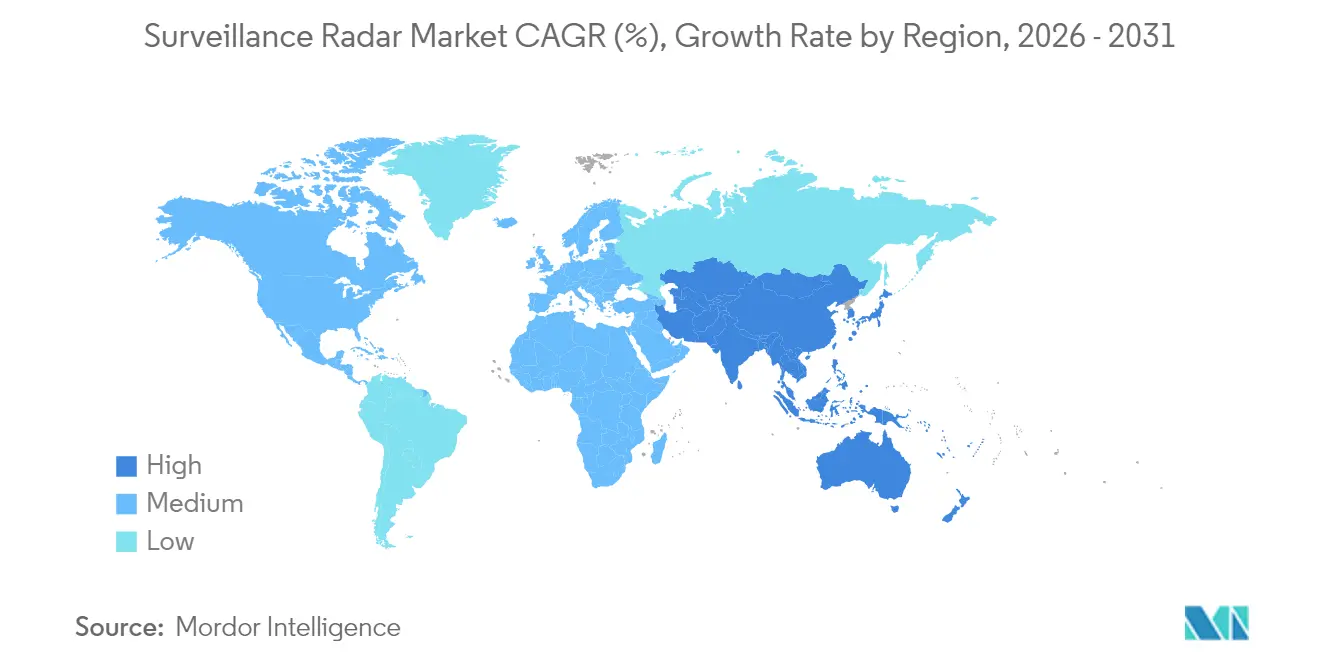
North America controlled 35.12% of 2025 turnover, and the region’s comprehensive NORAD modernization, plus the USD 175 billion Golden Dome missile-defense roadmap, preserves a sizable portion of future awards. Canada’s parallel USD 40 billion plan prioritizes over-the-horizon surveillance extending across the increasingly accessible Arctic routes. US congressional appropriations continue authorizing multi-year radar contracts, giving primes planning visibility through at least 2030.
Asia-Pacific is on track for a region-leading 7.41% CAGR as maritime flashpoints catalyze sovereign investments. China’s near-light-speed radar research hints at a paradigm shift in undersea monitoring, while Japan’s supply of coastal radars to the Philippines amplifies allied deterrence. India accelerates coastal surveillance buildouts and collaborates with Israel on joint AESA development to offset regional power asymmetry.
European momentum stems from NATO’s call for 5% GDP defense spending and funding vehicles such as the European Defence Fund. The EISNET consortium’s 23-partner effort to standardize air-missile-defense protocols is typical, driving bulk orders that spread R&D costs. Baltic procurement—Estonia’s GM400α and Latvia’s IRIS-T-based solution—reflects the bloc’s quick uptake of interoperable systems. Meanwhile, Middle East operators like the UAE localize production through joint ventures (EDGE-Indra) to secure supply chains and build indigenous capability. Africa shows selective demand where resource-rich states guard offshore installations, often financed via energy receipts or foreign military grants.

Regulatory Landscape
Surveillance radars used in or alongside civil air traffic management face overlapping requirements across spectrum access, safety assurance, and surveillance performance. In Europe, EASA rules for ATM/ANS equipment (including surveillance) use mechanisms such as Declarations of Design Compliance under the EU ATM/ANS framework, while ETSI harmonised standards (including the EN 303 363 and EN 303 364 series) set the basis for radio equipment compliance for surveillance-related radar use in shared spectrum environments.
In the United States, the FAA acts as a key demand-side regulator and program owner for certification and commissioning practices tied to surveillance infrastructure. A major reference point is the FAA Radar System Replacement (RSR) Qualified System List program, including a December 2025 contract awarded to Indra Air Traffic with a ceiling of USD 385.67 million to modernize up to 612 radar systems, aligned with the FAA Facility Replacement and Radar Modernization (FRRM) effort and operational guidance for radar procedures and acceptance.
Value Chain Analysis
The surveillance radar value chain starts with compound-semiconductor materials and RF components (GaN/GaAs devices, GaN-on-SiC wafers, and high-power amplifiers), then moves into AESA subassemblies such as transmit/receive (T/R) modules, thermal solutions, and antenna panels. System integrators combine these with digital-signal processors, embedded software, cybersecurity hardening, and mission integration for land, sea, air, and space platforms. Calibration, qualification testing, and secure manufacturing practices are critical gating steps, especially for networked radars operating in contested EW environments.
Downstream, primes and specialist houses deliver full systems to defense ministries, air navigation service providers, and critical infrastructure operators through direct contracts and government acquisition vehicles. Sustainment, spares, and software updates make up a sizable portion of lifecycle value. Bottlenecks tend to concentrate in T/R module fabrication and the gallium supply chain, a key input for GaN, which supports backward integration and allied-sourcing strategies among vendors such as RTX, Lockheed Martin, Thales, Leonardo, and Saab. Recent large defense and naval radar orders and modernization programs also pull through demand for test equipment, field support, and upgrade kits that extend legacy sensor fleets with open-architecture processing.
Competitive Landscape
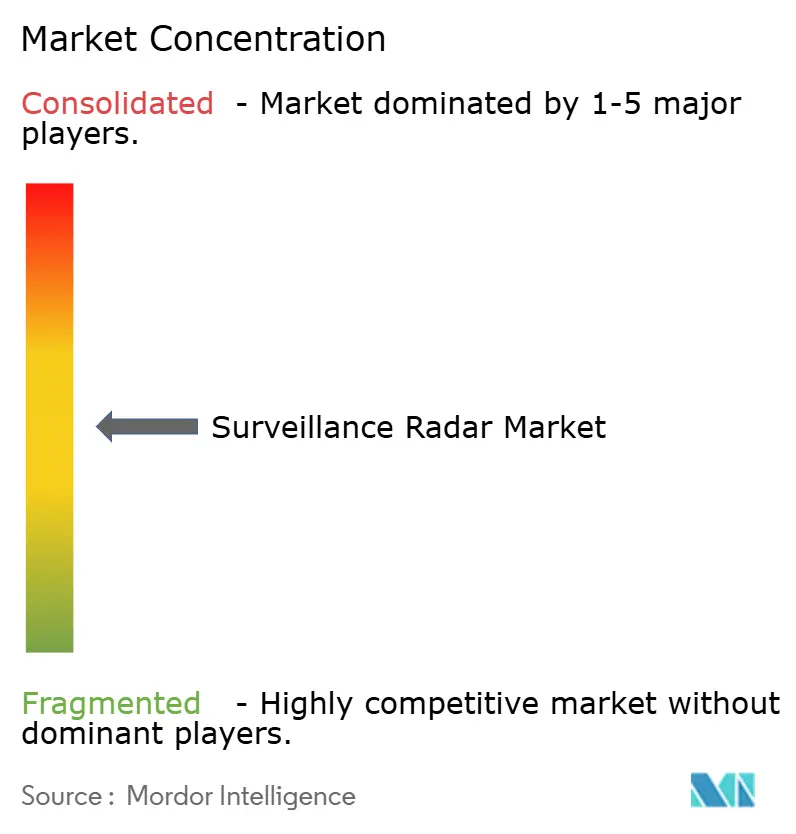
The surveillance radar market is moderately consolidated. Heavyweights—RTX Corporation, Lockheed Martin Corporation, Northrop Grumman Corporation, Thales Group—hold entrenched positions through vertical control of transmitter-receiver modules, gallium-nitride wafer supply, and algorithm stacks. They invest in organic GaN fabrication lines and proprietary AI libraries to buffer against supply shocks and commoditization. Strategic teaming remains central: RTX and Kongsberg’s GhostEye collaboration extends a 30-year NASAMS partnership with 360-degree GaN coverage.
New entrants exploit software-defined architectures to bypass hardware fill rates. Anduril’s 2025 acquisition of Numerica’s Spyglass radar vaults the company from counter-UAS niche to mid-tier tactical-air-defense supplier, leveraging AI to compress kill-chain timelines. Rheinmetall’s 60% stake in ICEYE’s SAR satellite venture positions the German conglomerate as a cross-domain provider, bundling orbital imaging with land-based effectors. Such moves reshape competitive contours by marrying cloud-processed data services with traditional sensor hardware.
Primes respond through open mission-systems standards that invite external app development while locking customer data rights. Intellectual property protection around AI inference engines becomes the new battleground, with boutique analytics firms commanding high acquisition premiums. Talent scarcity in radar-signal processing amplifies this trend, prompting incumbents to set up university partnerships and in-house academies for next-generation engineer pipelines.
Surveillance Radar Industry Leaders
Lockheed Martin Corporation
HENSOLDT AG
RTX Corporation
Saab AB
Thales Group
- *Disclaimer: Major Players sorted in no particular order

Market Opportunities and Future Outlook
National airspace modernization and defense sensor network upgrades are creating practical whitespace for vendors that can deliver open-architecture, software-defined surveillance radars with certification-ready compliance packages. In civil infrastructure, the FAA Radar System Replacement (RSR) effort and related FRRM activity provide a sustained pipeline for replacing aging surveillance assets and consolidating configuration types. That environment favors suppliers with proven commissioning processes, defined cybersecurity postures, and long-term support capacity. EUROCAE also published ED-288 in June 2026, a technology-agnostic technical standard for Independent Non-Cooperative Surveillance (INCS) systems, which supports broader integration of non-cooperative sensing into air traffic service infrastructure without requiring a single hardware approach.
Defense procurement momentum points to near-term opportunities in scaling GaN-based AESA production, retrofit and upgrade packages, and multi-mission radars that reduce the number of sensors required per platform. Evidence includes the US Navy award to RTX (Raytheon) in June 2026 for the SPY-6 radar family, and the US Army award to Lockheed Martin in July 2026 for Sentinel A4 production and engineering services through 2031, both of which tie demand to T/R modules, digital processing, and sustainment services. Manufacturing capacity expansion, including Raytheons investment in its Andover, Massachusetts radar production footprint, shifts competition toward suppliers that can secure semiconductor inputs, automate module assembly, and meet delivery schedules under multi-year government contracts.
Recent Industry Developments
- July 2026: The US Army awarded Lockheed Martin a potential USD 2.999 billion contract for Sentinel A4 radar production and engineering services through June 29, 2031. The award reinforces multi-year demand for networked surveillance radars optimized for air defense and counter-UAS missions, supporting supplier capacity planning for AESA hardware, digital processing, and sustainment.
- December 2025: The FAA awarded Indra Air Traffic a contract with a ceiling of up to USD 385.67 million for the Radar System Replacement (RSR) Qualified System List program to modernize up to 612 radar systems. The replacement cycle extends over multiple years and favors vendors that can standardize configurations while meeting FAA commissioning and operational requirements.
- April 2024: Saab received an order for Giraffe 4A radars for the US Air Forces in Europe. The procurement expands the installed base for mobile air surveillance in a NATO operating environment, increasing follow-on opportunities tied to integration, training, spares, and software-driven capability updates.


Research Methodology Framework and Report Scope
Market Definition and Coverage
This market covers spending on surveillance radar systems used to detect, track, and provide early warning across air, land, and maritime domains, including associated embedded software and standard initial spares that ship with new systems.
Scope exclusions: weather radar used mainly for forecasting and fire control radars used directly for weapon guidance are not counted.
Segmentation Overview
- By Platform
- Airborne
- Land
- Sea
- Space
- By Component
- Antennas
- Transmitters
- Duplexers
- Digital Signal Processors
- Other Components
- By Application
- Commercial
- Military
- By Frequency Band
- VHF and UHF
- L Band
- S Band
- C Band
- X Band
- Ku/K Band
- Ka-Band and Above
- By Range
- Short-Range (Less than 50 km)
- Medium-Range (50–200 km)
- Long-Range (Greater than 200 km)
- By Radar Dimension
- 2-D
- 3-D
- 4-D
- By Geography
- North America
- United States
- Canada
- Europe
- United Kingdom
- Germany
- France
- Russia
- Rest of Europe
- Asia-Pacific
- China
- Japan
- India
- South Korea
- Rest of Asia-Pacific
- South America
- Brazil
- Rest of South America
- Middle East and Africa
- Middle East
- United Arab Emirates
- Saudi Arabia
- Rest of Middle East
- Africa
- Egypt
- Rest of Africa
- Middle East
- North America
Data Sources, Market Sizing, and Validation
Desk Research
Desk work starts with building a clear fact base on defense and security demand, procurement cycles, and radar adoption. We mainly lean on public sources such as defense budget documents, national audit and oversight reports, and defense procurement portals that publish tender and award notices.
To ground the demand pool, we also use sources such as NATO and other multilateral defense releases, SIPRI military expenditure datasets, and UN Comtrade trade statistics for radar related equipment categories. For air and maritime surveillance context, references such as ICAO material, national civil aviation authority publications, and coast guard or maritime authority program updates are used. Company annual reports, investor presentations, association websites, and reputable defense press are then used to connect programs to likely radar classes and delivery timing. Where needed, paid subscriptions for company financials and intelligence, global contracts and tenders, and patent databases are used to cross check active programs and supplier activity. These sources are illustrative, and other public references were also used for data collection, validation, and clarification.
Primary Interviews and Surveys
Primary work is used to test assumptions that desk signals cannot fully confirm, especially around procurement timing, replacement cycles, and how systems are priced when options, integration, and training are bundled. We speak with a mix of radar OEM staff, subsystem suppliers, system integrators, and defense and homeland security buyers across APAC, EMEA, and the Americas, so regional program differences are captured and then reconciled in one model.
Distribution of primary research fieldwork respondents
| Company type | Respondent position | Region |
|---|---|---|
| Top tier: 35% | CXOs: 12% | APAC: 49% |
| Mid tier: 51% | Functional/Unit leaders: 41% | EMEA: 30% |
| Smaller Players: 14% | Managers: 47% | Americas: 21% |
Market-Sizing & Forecasting
Sizing is built using a top-down and bottom-up approach, where defense and security procurement totals are reconstructed into radar addressable demand pools by platform and mission need, and then filtered through adoption and refresh patterns for surveillance functions. Once the demand pool is shaped, we corroborate it with selective bottom-up checks, such as sampling programs and estimating unit volumes times average selling prices, followed by channel checks on typical spares and support attach rates.
Inputs that matter in this market include active airspace surveillance modernization programs, coastal and border monitoring rollouts, platform mix shifts (ground, naval, airborne), typical range class splits, and the pace of AESA and digital beamforming adoption that changes unit pricing over time. We also track cues like defense budget growth, procurement lead times, and installed base replacement cycles so the model does not create unrealistic step changes. Forecasts lean on scenario analysis, where program schedules and budget signals are translated into timing bands and then aligned with expert views on delivery slippage and currency impacts. When bottom-up visibility is incomplete for smaller programs, conservative coverage ratios are applied based on historical awards and then rechecked through follow-up calls.
Data Validation & Update Cycle
Outputs are validated by checking whether implied unit counts and pricing line up with known procurement patterns, public award values, and realistic fielding schedules. Any large variance by region or platform triggers a deeper review, where assumptions are tested again with extra program notes and additional re-contacts with interviewees when needed.
Before sign-off, the model goes through analyst cross-checks for math consistency, year over year swings, and currency conversion timing so the series stays comparable. The report is refreshed annually, and interim updates are made when material events occur, such as major budget changes or large radar program awards. Right before delivery, a final pass is completed so clients receive the most recent view.
Mordor Intelligence's Surveillance Radar Market Size Compared With Other Published Estimates
Published values for surveillance radar can look different even when the titles sound similar, and this usually comes from what each study counts as a radar sale and how programs are timed across years. We keep the sizing steps traceable to procurement and deployment signals, and then verify those signals with industry participants.
The biggest gap drivers tend to be scope and timing, where some estimates fold in adjacent radar categories, broader service revenue, or home security devices that are not procured like defense grade surveillance systems. Differences also show up when one model anchors to an earlier base year with fixed pricing, while another updates ASP progression using technology shifts and contract award patterns, and then applies currency conversion at different points in the year.
Benchmark comparison
| Source | Market Size | Gaps in Research Methodology |
|---|---|---|
| Mordor Intelligence | USD 14.04 B (2026) | |
| Global Consultancy A | USD 12.26 B (2025) | Uses a different base year and can include broader application buckets, which changes when large defense programs are recognized into the annual total. |
| Industry Publisher B | USD 11.04 B (2024) | Anchors the model to an earlier base year and does not clearly separate new system sales from follow-on services, which can shift both the level and the growth path. |
The table shows that year choice and what gets counted as a surveillance radar sale can move the total by a few billion dollars. By counting new, digitally controlled surveillance radar systems (including embedded software and initial spares) and excluding weather and fire control radars, the spread is reduced through a consistent scope treatment applied by Mordor Intelligence.


Key Questions Answered in the Report
What is the current size of the surveillance radar market and how fast is it growing?
The surveillance radar market stands at USD 14.04 billion in 2026 and is projected to advance at a 10.29% CAGR to reach USD 22.9 billion by 2031.
Which platform segment holds the largest revenue share?
Airborne systems led in 2025 with a 36.12% share, reflecting sustained investment in multi-mission aircraft and unmanned platforms.
Which platform segment is expanding the fastest?
Space-based radars are projected to post the quickest 9.47% CAGR through 2031 as governments seek persistent global coverage.
What frequency band is expected to grow most rapidly?
Ku/K-band systems are forecast to register a 10.38% CAGR thanks to superior resolution for counter-stealth and space-surveillance missions.
Which geographic region is anticipated to record the highest growth rate?
Asia-Pacific is set to advance at a 7.41% CAGR, driven by maritime security programs and large-scale counter-stealth deployments.
What is the primary restraint weighing on near-term adoption?
High acquisition and life-cycle costs—up to USD 130 million per unit for top-tier systems—remain the biggest short-term drag on procurement.
Page last updated on:






