
Surgical Kits Market Size and Share
Market Overview
| Study Period | 2020 - 2031 |
|---|---|
| Market Size (2026) | USD 18.48 Billion |
| Market Size (2031) | USD 25.57 Billion |
| Growth Rate (2026 - 2031) | 6.72 % |
| Fastest Growing Market | Asia-Pacific |
| Largest Market | North America |
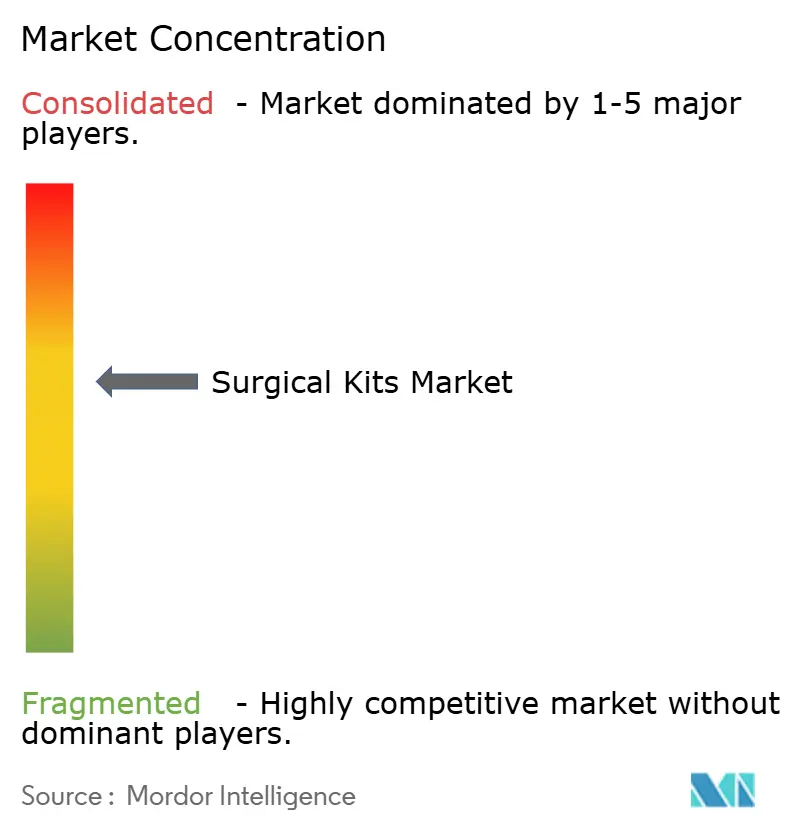
| Market Concentration | Medium |
Major Players *Disclaimer: Major Players sorted in no particular order Image © Mordor Intelligence. Reuse requires attribution under CC BY 4.0. | |
Surgical Kits Market Analysis by Mordor Intelligence
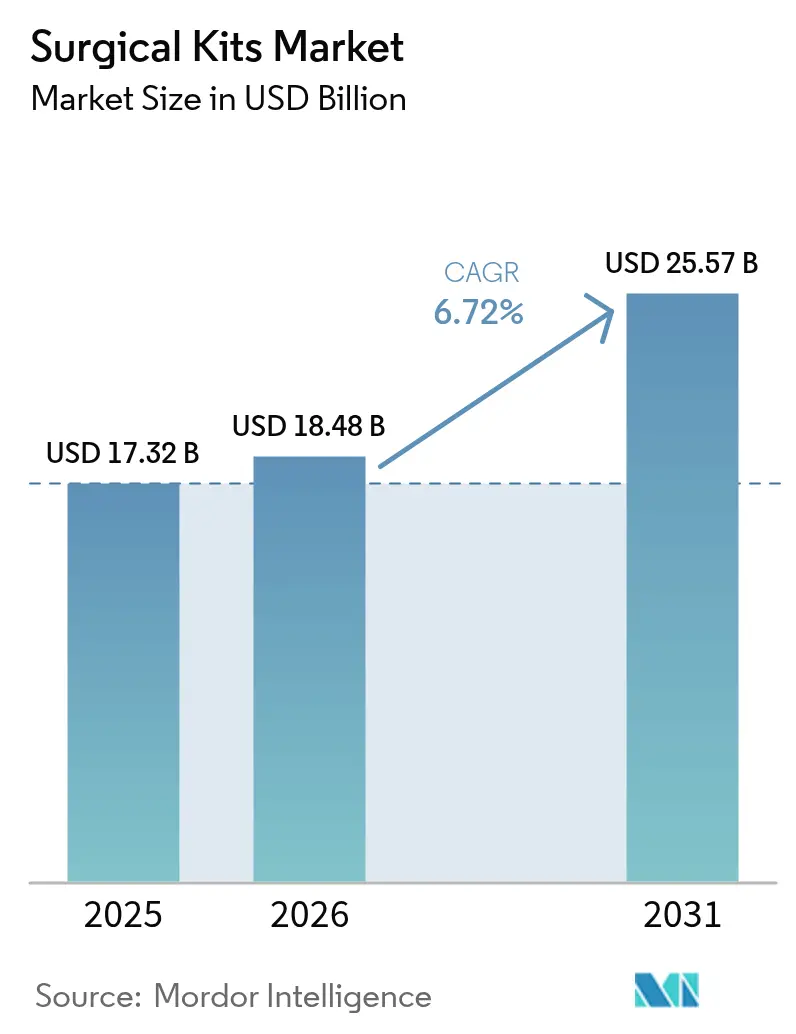
The surgical kits market size was valued at USD 17.32 billion in 2025 and is estimated to grow from USD 18.48 billion in 2026 to reach USD 25.57 billion by 2031, at a CAGR of 6.72% during the forecast period (2026-2031). Growth is underpinned by hospitals replacing reusable trays with single-use procedure packs that embed infection-control compliance and digital traceability. Demand intensifies as governments mandate unique-device identification, driving vendors to serialize every pouch for real-time inventory analytics. Ambulatory surgery centers favor standardized packs that trim supply expense, while regulations limiting ethylene-oxide emissions accelerate low-temperature plasma sterilization investments. Sustainability statutes in Europe and selected U.S. states spur experimentation with bio-based drapes and gowns, creating white-space opportunities for suppliers of compostable polymers. Meanwhile, vendor-managed just-in-time case carts convert hospitals’ fixed assets into variable costs, lowering inventory days on hand and tightening the competitive landscape.
Key Report Takeaways
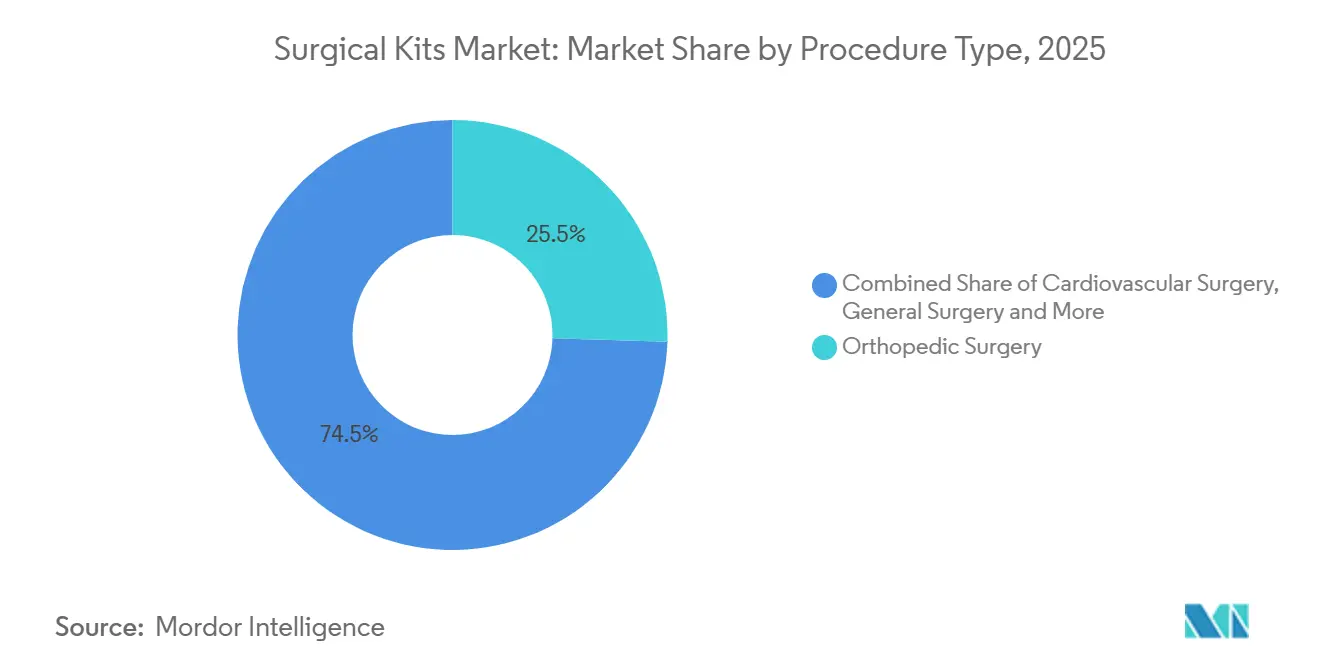
- By procedure type, orthopedic surgery led with 25.54% of the surgical kits market share in 2025, whereas ENT & thoracic surgery is projected to expand at a 9.25% CAGR through 2031.
- By component, drapes & gowns commanded 26.54% revenue share in 2025; sutures & adhesives are advancing at an 8.65% CAGR over 2026-2031.
- By kit configuration, customized procedure packs held 54.15% of the surgical kits market size in 2025, while emergency & trauma packs register the highest 9.82% CAGR.
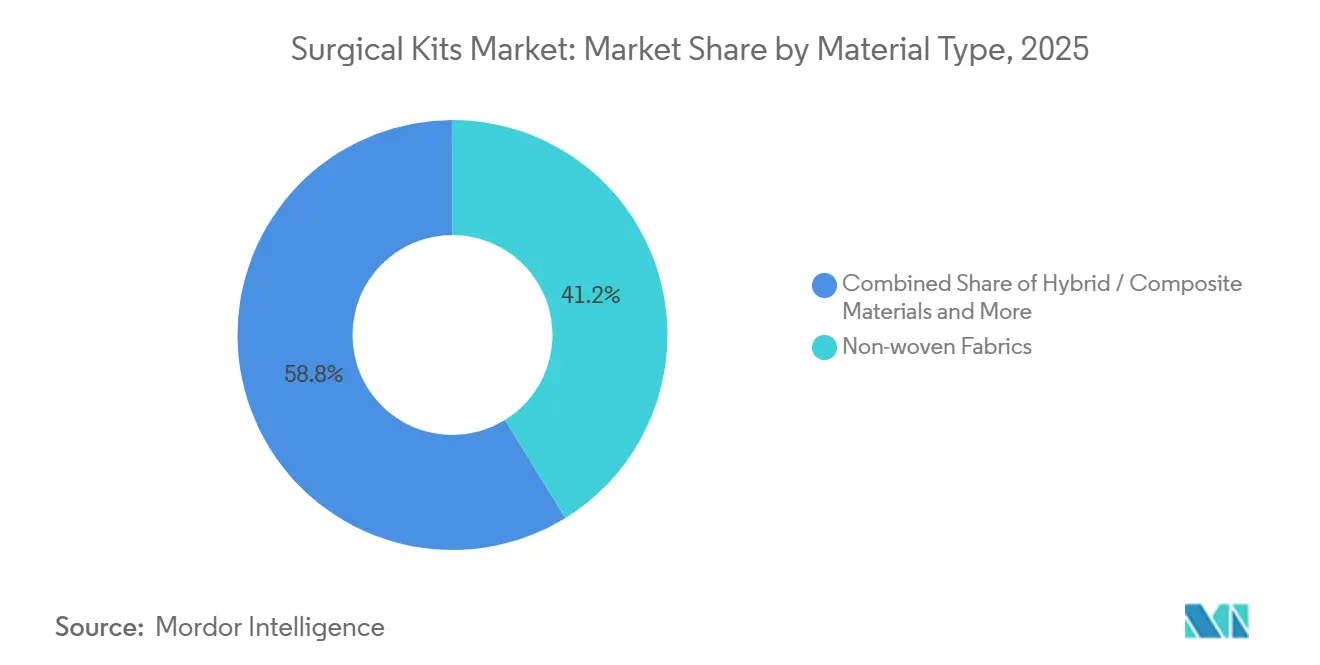
- By material type, non-woven fabrics captured 41.23% revenue share in 2025, yet bio-based/compostable materials are growing at a 12.42% CAGR.
- By sterilization method, ethylene oxide dominated with 45.83% share in 2025; plasma sterilization is the fastest riser at 11.22% CAGR.
- By sterility, sterile kits represented 92.23% of 2025 sales, whereas non-sterile kits are increasing at a 10.52% CAGR.
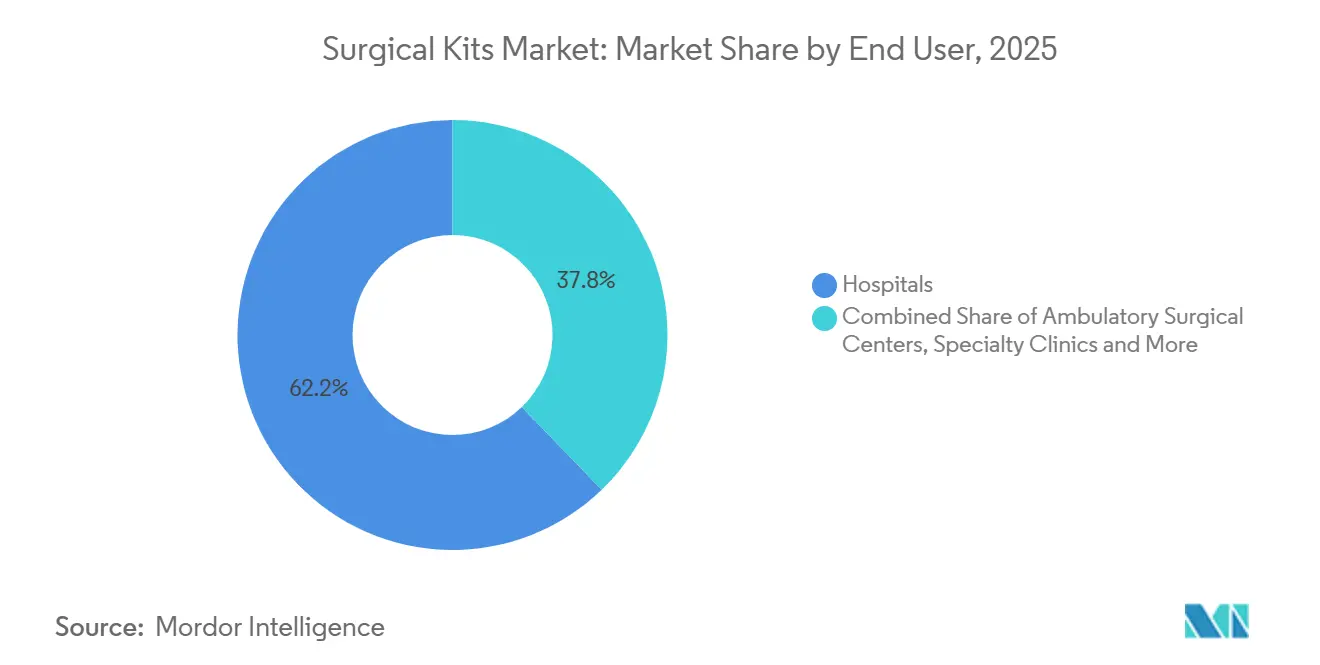
- By end user, hospitals accounted for 62.22% of revenue in 2025; ambulatory surgical centers are expanding at an 8.62% CAGR.
- By distribution channel, direct institutional sales formed 49.43% of sales in 2025, but e-commerce platforms accelerate at a 12.12% CAGR.
- By geography, North America led with 45.53% revenue share in 2025, while Asia-Pacific posts a robust 10.1% CAGR through 2031.
Note: Market size and forecast figures in this report are generated using Mordor Intelligence’s proprietary estimation framework, updated with the latest available data and insights as of 2026.
Market Trends and Insights
Drivers Impact Analysis of Surgical Kits Market*
| Driver | (~) % Impact on CAGR Forecast | Geographic Relevance | Impact Timeline |
|---|---|---|---|
| Growing surgical procedure volume worldwide | +1.8% | Global, notably Asia-Pacific & North America | Long term (≥ 4 years) |
| Shift toward customized procedure packs for OR efficiency | +1.5% | North America, Europe, urban Asia-Pacific | Medium term (2-4 years) |
| Stricter infection-control regulations boosting single-use sterile kits | +1.3% | Global, led by EU & U.S. | Medium term (2-4 years) |
| Expansion of ambulatory surgery centers demanding standardized kits | +1.2% | North America, spill-over Europe & Australia | Long term (≥ 4 years) |
| Digital traceability mandates enabling real-time inventory analytics | +0.7% | North America & EU | Short term (≤ 2 years) |
| OEM–CPT vendor partnerships for just-in-time case-cart delivery models | +0.6% | North America & Europe | Medium term (2-4 years) |
| Source: Mordor Intelligence | |||
Growing Surgical Procedure Volume Worldwide
Global surgical volume climbed to 421 million procedures in 2024 from 387 million in 2022 as aging populations and chronic diseases lifted elective interventions. The World Health Organization projects 62% of incremental demand to emanate from low- and middle-income nations by 2030, prompting governments to standardize essential-procedure packs that shave 18 minutes off set-up time and raise theater utilization. China expanded its surgical reimbursement catalog to 1,200 procedures in 2025, spurring a 23% rise in kit purchases by provincial hospitals[1]. India deployed 3,400 mobile surgical units equipped with trauma packs in rural districts, demonstrating how procedure growth extends beyond fixed facilities. As case volumes swell, the surgical kits market benefits from predictable, repeat demand cycles that underpin vendor capacity-planning.
Shift Toward Customized Procedure Packs for OR Efficiency
Tailored packs cut tray set-up by 14 minutes per orthopedic case and save USD 47 in nursing labor, according to a 2024 multicenter U.S. study. Seventy-eight percent of knee-replacement surgeries used surgeon-specific packs in 2025, transferring inventory risk to assemblers. Workflow complexity remains a concern; 34% of circulating nurses reported tray discrepancies weekly, delaying cases. Vendors now integrate barcode scanning with electronic health-records to verify contents in real time before a patient enters the room, reinforcing the value proposition of customization without eroding efficiency.
Stricter Infection-Control Regulations Boosting Single-Use Sterile Kits
FDA guidance issued in 2024 obliges manufacturers of reusable instruments to validate cleaning against prion contamination, adding USD 120,000 per instrument family in annual compliance costs and nudging hospitals toward disposables. EU Medical Device Regulation Article 5.5 enforces biofilm surveillance of reusable devices, compelling 14 national health systems to restrict reusable laparoscopic tools. Single-use kits reduced surgical-site infection by 0.8 percentage points across 47 randomized trials, solidifying their clinical merit. Hospitals weighing litigation and readmission penalties see disposable packs as insurance against adverse events.
Expansion of Ambulatory Surgery Centers Demanding Standardized Kits
U.S. ASCs performed 28.4 million cases in 2025, up 19% from 2023, driven by Medicare payment parity on 11 added procedure codes[2]. Supply expense per ASC case averages USD 412 versus USD 687 in hospitals; standardized packs ease budget pressure and slash expired inventory. Eighty-one percent of centers trimmed their kit suppliers from four to two, leveraging volume for double-digit price cuts. Staff turnover of 22% annually amplifies the appeal of pre-configured trays that shorten onboarding and curb errors.
Restraints Impact Analysis of Surgical Kits Market*
| Restraint | (~) % Impact on CAGR Forecast | Geographic Relevance | Impact Timeline |
|---|---|---|---|
| Reimbursement pressure in low-income settings | -0.9% | Sub-Saharan Africa, South Asia, Latin America | Long term (≥ 4 years) |
| Supply-chain volatility in non-woven barrier materials | -0.7% | Global, acute in North America & Europe | Short term (≤ 2 years) |
| Sustainability concerns over disposables driving regulatory scrutiny | -0.5% | EU, emerging U.S. & Australia | Medium term (2-4 years) |
| Customization complexity causing workflow mis-alignment | -0.3% | North America & Europe | Short term (≤ 2 years) |
| Source: Mordor Intelligence | |||
Reimbursement Pressure in Low-Income Settings
Public payers in 38 low-income nations reimburse procedures at 40-60% below the cost of single-use packs, forcing hospitals to rely on reusable sets and autoclaves[3]. Kenya’s national insurer allotted just USD 0.32 per surgical case for disposables in 2025, far below the USD 8-12 needed for basic drape-and-gown sets. Resin inflation of 11% annually from 2023-2025 widened the gap. Donor initiatives, such as Gavi’s advance-market commitment covering 2 million kits yearly at USD 6 apiece, remain confined to 11 countries.
Supply-Chain Volatility in Non-Woven Barrier Materials
Polypropylene spot prices spiked 34% between January 2024 and March 2025 after outages at U.S. Gulf Coast petrochemical plants. Four leading kit assemblers invoked force-majeure clauses, delaying deliveries up to six weeks and paying USD 18 million in penalties. Hospitals responded by dual-sourcing packs and tying contracts to the plastics producer price index. An ongoing U.S. antidumping probe into Chinese spunbond imports heightens uncertainty.
*Our forecasts treat driver/restraint impacts as directional, not additive. The impact forecasts reflect baseline growth, mix effects, and variable interactions.
Surgical Kits Market Segment Analysis
By Procedure Type:
Orthopedic Anchors Spend While Endoscopic ENT AcceleratesOrthopedic surgery held 25.54% of the surgical kits market share in 2025, buoyed by USD 1,200-1,800 joint-replacement packs that bundle implant trials and cement systems. Yet ENT & thoracic kits are growing briskly at 9.25% CAGR on the back of minimally invasive sinus and video-assisted thoracoscopic procedures that favor disposable trocars. An evidence review showed video-assisted lobectomy shaved 2.1 days off inpatient stay, bolstering payer support for single-use instrument sets that speed discharge. Cardiovascular kits tick along at mid-single-digit growth as transcatheter valves eclipse open-heart volumes. General surgery and obstetrics draw steady demand, the latter lifted by rising institutional deliveries in Asia-Pacific.
Shifting procedures to ambulatory sites compress kit footprints; ENT cases in U.S. ASCs jumped 27% between 2023-2025. Vendors now unbundle orthopedic implant trials to shave 15-20% off pack cost. Regulatory reclassification of laparoscopic instruments to Class II intensified 510(k) hurdles, favoring incumbents with robust validation labs.

By Component:
Drapes Dominate While Sutures Race AheadDrapes & gowns generated 26.54% of component revenue in 2025, mandated by universal-barrier protocols. Sutures & adhesives, however, outpace at 8.65% CAGR, propelled by bioresorbable polymers that erase follow-up removal visits. A 2025 meta-analysis reported cyanoacrylate adhesives cut infection by 1.2 percentage points in clean-contaminated wounds. Instruments, disposables, and implants each add incremental value but mirror overall market trajectory.
Innovation fuels component economics. Antimicrobial-coated drapes slashed contamination 34% in controlled trials, commanding a 25% premium. RFID-tagged suture packs reduced stockouts nearly 30%, underscoring tech’s growing role in inventory stewardship.
By Kit Configuration:
Customization Reigns, Trauma Packs SurgeCustomized packs absorbed 54.15% of the surgical kits market size in 2025 as surgeons fine-tuned instruments to personal technique. Emergency & trauma packs, by contrast, post a 9.82% CAGR, catalyzed by standardized hemorrhage-control kits in ambulances and field hospitals. The American College of Surgeons’ Stop the Bleed campaign trained 2.3 million civilians by 2025, expanding demand for public-access trauma kits.
Digital configurators now let surgeons drag-and-drop components in a 3-D workspace, previewing the tray before orders lock. Regulatory oversight intensifies when drug-device combos appear in a pack, elongating approval by up to nine months.
By Material Type:
Non-Woven Leads while Bio-Based DisruptsNon-woven fabrics represented 41.23% of 2025 revenue, prized for barrier and breathability at sub-USD 3.50/m². Bio-based/compostable materials grow 12.42% CAGR, helped by life-cycle assessments showing 48% lower greenhouse emissions for polylactic-acid drapes. Yet price premiums curb uptake outside sustainability-budgeted hospitals.
Material science advances: spunlace cellulose blends achieved ASTM F1671 viral-barrier status, granting biodegradability without sacrificing protection. Antimicrobial nanoparticle additives trim bacterial loads 99.7%, though regulators monitor migration risk.
By Sterilization Method:
Ethylene Oxide Dominates as Plasma GainsEthylene oxide retained 45.83% share in 2025 for heat-sensitive kits, yet plasma sterilization races ahead at 11.22% CAGR, completing cycles in under 45 minutes and leaving no toxic residue. Tougher EPA emission caps may inflate ethylene-oxide costs, compelling a shift toward plasma and e-beam irradiation. Gamma capacity tightens as cobalt-60 replacement costs shutter facilities, lengthening lead times.
By Sterility:
Sterile Kits Rule, Non-Sterile Finds a NicheSterile kits held 92.23% of 2025 sales, compulsory for devices touching sterile tissue. Non-sterile packs, however, log a 10.52% CAGR where hospitals autoclave instruments in-house to capture 30-40% savings. Infection-prone specialties remain wary; a 2024 CDC investigation tied seven surgical-site infections to improperly cleaned non-sterile orthopedic sets.
By End User:
Hospitals Command, ASCs AccelerateHospitals captured 62.22% revenue in 2025, supported by high-acuity caseloads and in-house sterile processing. ASCs gain at 8.62% CAGR on procedural migration after payment-parity reforms. Value-analysis committees in hospitals now weigh total cost of ownership, pushing vendors toward outcome-based contracts. Specialty clinics, military units, and office-based suites round out demand, each with tailored kit requirements.
By Distribution Channel:
Direct Sales Prevalent, E-Commerce Gains TractionDirect institutional sales formed 49.43% of 2025 revenue, reflecting hospitals’ appetite for field reps and clinical in-service. E-commerce platforms, nonetheless, grow 12.12% CAGR as GPOs aggregate 400-plus SKUs with live pricing, slicing order cycle times by 25%. Vizient’s 2025 EDI pilot chopped USD 14 off processing costs per order, underlining digital efficiencies.
Geography Analysis
North America Surgical Kits Market
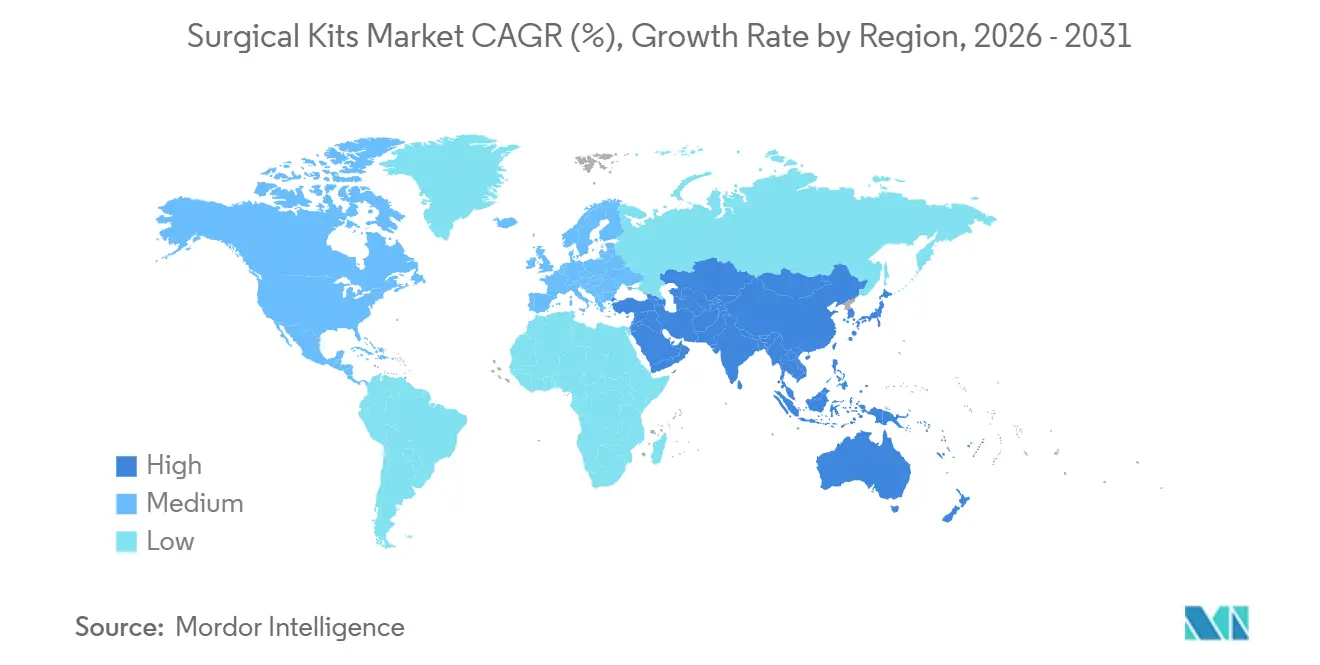
North America led at 45.53% in 2025, fueled by rigorous UDI mandates and robust value-analysis cultures. The U.S. added 4.8 million outpatient procedures to ASC settings between 2023-2025, fortifying demand for standardized packs. Ethylene-oxide emission curbs and polypropylene price swings pose near-term headwinds.
APAC Surgical Kits Market
Asia-Pacific advances 10.1% CAGR to 2031. China installed 12,000 surgical suites under Healthy China 2030, driving bulk-buying of procedure packs. India reimbursed 18 million surgical episodes in 2025 through Ayushman Bharat, ratcheting kit uptake. Japan’s cataract volumes rose 11% in 2024-2025, and new minimally invasive orthopedic codes won coverage in 2024.
EMEA and South America Surgical Kits Market
Europe occupies a sturdy mid-30s share, but sustainability and post-market surveillance requirements inflate compliance spend by 15-20%, uplifting barriers against low-cost entrants. Middle East & Africa grow modestly, concentrated in GCC medical-tourism hubs, while South America relies on public-private partnerships to expand theater capacity.
Regulatory Landscape
Regulation of surgical kits and procedure packs is tightening around traceability, quality systems, and post-market responsibilities. In the European Union, Regulation (EU) 2017/745 (EU MDR) sets requirements for systems and procedure packs under Article 22, including declaration of compatibility where applicable, UDI-related obligations, and registration pathways aligned to EUDAMED. Where kits are supplied sterile, Notified Body involvement can be triggered under the MDR conformity assessment framework (for example, in cases requiring intervention for sterile aspects), which increases documentation and technical file rigor compared with legacy pathways.
In the United States, FDA device classification and pathway requirements vary by kit type and intended use: general-use surgical instrument trays (product code FSM) are Class I and 510(k) exempt, while certain specialized surgical kit configurations can fall under Class II and require 510(k) clearance to demonstrate substantial equivalence. Across major jurisdictions, ISO 13485:2016 remains a common quality management anchor used by regulators and notified bodies when evaluating manufacturing controls, supplier management, and validation for assembled packs that combine multiple components under one label.
Competitive Landscape
The top suppliers—Johnson & Johnson (Ethicon), Medline Industries, Cardinal Health, B. Braun Melsungen, and Medtronic—collectively hold a significant share, signaling moderate concentration. Scale players exploit vertical integration from fabric extrusion to distribution, securing 18-22% gross margins. Mid-tier assemblers compete on customization agility and regional regulatory fluency. Sustainability disruptors such as Mölnlycke command premium contracts with carbon-neutral drapes certified under ISO 14067. Technology differentiators embed RFID tags and cloud preference-card systems, winning 25-30% share gains at digitally mature hospitals. Regulatory moats deepen as EU MDR and FDA 510(k) requirements extend validation timelines and costs, deterring greenfield entrants.
Surgical Kits Industry Leaders
-
Medline Industries, LP
-
Medtronic plc
-
Johnson & Johnson (Ethicon)
-
Cardinal Health, Inc.
-
B. Braun Melsungen AG
- *Disclaimer: Major Players sorted in no particular order
Surgical Kits Market Companies Covered in this Report
- Ansell Healthcare
- Aspen Surgical
- B. Braun
- Beckton Dickinson
- Cardinal Health
- The Cooper Companies
- Defries Industries
- Henry Schein
- Hogy Medical Co., Ltd.
- Integra LifeSciences
- Johnson & Johnson
- Lohmann & Rauscher GmbH
- Medline Industries
- Medtronic
- Merit Medical Systems
- Molnlycke Health Care
- Multigate Medical Products
- Owens & Minor Inc. (Halyard Health)
- Solventum Corp
- Steris plc
- Terumo Cardiovascular Systems
Market Opportunities and Future Outlook
Opportunity is expanding around regionalized manufacturing and higher-throughput kitting as health systems seek shorter lead times, fewer stockouts, and tighter control of preference-card variability. In May 2026, Owens and Minor launched Halyard Kitting, anchored by a facility in Villanueva, Honduras, adding automated packaging and sequencing to nearly double network production capacity for medical procedure trays. This aligns with hospitals moving toward vendor-managed, just-in-time case-cart models. Similarly, Medline confirmed an expansion of its Partizanske, Slovakia footprint (June 2026) to increase EMEA capacity, reinforcing the whitespace for suppliers that can support large, multi-country customers with consistent pack builds and local service levels.
A second whitespace is forming at the intersection of infection control, traceability, and sterilization constraints, where kit providers can differentiate through digital serialization, RFID-enabled content verification, and alternative low-temperature sterilization-compatible materials. In June 2026, Mölnlycke Health Care announced a EUR 40 million investment across Mikkeli, Finland and Oldham, UK, adding 100 million units of annual capacity and doubling sterilization capacity in Mikkeli, highlighting how supply assurance and sterilization throughput are becoming competitive levers for sterile drapes, gowns, and procedure-pack assemblies. On the demand side, tray optimization programs (for example, a November 2025 hip replacement tray reduction at The Surgery Center of Lynchburg that reduced sterile processing burden and delivered annual savings) support ongoing standardization and content-rightsizing, which creates openings for customized packs that remove unused items while maintaining compliance and audit-ready traceability.
Recent Industry Developments in Surgical Kits Market
- June 2026: Medtronic and KARL STORZ announced a strategic collaboration to integrate visualization and ENT instrumentation into Medtronic's AiBLE ENT ecosystem in the United States. The collaboration supports integrated ENT surgical workflows, where standardized, procedure-ready configurations and connected inventory practices are intended to reduce setup errors and support faster room turnover.
- May 2026: Owens and Minor launched Halyard Kitting, using its facility in Villanueva, Honduras to add visual management sequencing and automated packaging for medical procedure trays. The capacity and process upgrade strengthens supply resilience for large pack programs and supports hospitals seeking consistent builds under vendor-managed replenishment models.
- April 2026: Johnson and Johnson received CE Mark approval for the ETHICON 4000 Stapler for open and laparoscopic surgery in the European Union. The approval broadens advanced tissue-closure options that can be incorporated into procedure-specific kits, reinforcing demand for pack partners that can manage regulated, multi-component configurations under EU MDR requirements.
Surgical Kits Market Report Scope and Research Methodology
Market Definition and Coverage
For this study, the surgical kits market covers pre-assembled sets used before and during procedures, which bundle sterile or non-sterile supplies and instruments to support a specific surgical workflow in hospitals, ambulatory surgical centers, and specialty clinics.
Scope exclusions: We exclude capital operating room equipment and large reusable surgical systems that are bought as standalone devices rather than as kit-based packs.
Segments Covered in This Report
- By Procedure Type
- Cardiovascular Surgery
- Orthopedic Surgery
- Obstetrics & Gynecology
- General Surgery
- Neurosurgery
- Ophthalmic Surgery
- Urology Surgery
- ENT & Thoracic Surgery
- Other Procedures
- By Component
- Instruments & Tools
- Drapes & Gowns
- Disposable Supplies
- Sutures & Adhesives
- Implants & Fixation Accessories
- Other Components
- By Kit Configuration
- Standardised Procedure Packs
- Customized Procedure Packs
- Emergency & Trauma Packs
- By Material Type
- Non-woven Fabrics (SMS, Spunlace)
- Woven Textiles
- Hybrid / Composite Materials
- Bio-based / Compostable Materials
- By Sterilization Method
- Ethylene Oxide
- Gamma Radiation
- E-beam Irradiation
- Steam / Autoclave
- Plasma
- By Sterility
- Sterile Kits
- Non-sterile Kits
- By End User
- Hospitals
- Ambulatory Surgical Centers
- Specialty Clinics
- Military & Field Hospitals
- Home & Office-based Surgical Suites
- By Distribution Channel
- Direct Institutional Sales
- Group Purchasing Organizations (GPOs)
- Third-Party Distributors
- E-commerce Platforms
- By Geography
- North America
- United States
- Canada
- Mexico
- Europe
- Germany
- United Kingdom
- France
- Italy
- Spain
- Rest of Europe
- Asia-Pacific
- China
- India
- Japan
- Australia
- South Korea
- Rest of Asia-Pacific
- Middle East and Africa
- GCC
- South Africa
- Rest of Middle East and Africa
- South America
- Brazil
- Argentina
- Rest of South America
- North America
Data Sources, Market Sizing, and Validation
Desk Research
Desk research is used to build the first market structure and to anchor the model to real healthcare activity levels. We refer to public sources such as the World Health Organization for broad surgical care indicators, the US CDC for infection prevention and sterilization context, and the US FDA databases for device and sterile-pack related regulatory signals.
To keep the sizing grounded, we also use sources such as the OECD health statistics for hospital activity, the World Bank for macro and health spend indicators, and UN Comtrade for trade direction checks on relevant medical supply categories. Company annual reports, earnings decks, and reputable press coverage are reviewed to understand product mix language, pricing direction, and distribution approaches, and then those inputs are cross-checked with a paid subscription covering company financials and a patent database for innovation cadence. These desk sources are illustrative only, and many other references were also used for data collection, validation, and clarification during the study.
Primary Interviews and Surveys
Primary work is used to convert the desk structure into assumptions that match how kits are procured and consumed in care settings. We spoke with stakeholders across kit assemblers, component suppliers, distributors, and providers, and the feedback was balanced across APAC, EMEA, and the Americas to reflect differences in procedure mix and standardization maturity.
Distribution of primary research fieldwork respondents
| Company type | Respondent position | Region |
|---|---|---|
| Top tier: 35% | CXOs: 16% | APAC: 48% |
| Mid tier: 43% | Functional/Unit leaders: 28% | EMEA: 29% |
| Smaller Players: 22% | Managers: 56% | Americas: 23% |
Market-Sizing & Forecasting
Sizing starts with a top-down build where surgical procedure volumes by major specialties are translated into an addressable demand pool for kit usage, and then adjusted using observed adoption patterns for standardized and customized procedure packs. When the model is being shaped, the main inputs include the mix of inpatient versus outpatient surgeries, average kits used per procedure type, the share of sterile versus non-sterile configurations, and pricing movement by component intensity (for example, drapes and disposables heavy packs versus instrument heavy packs).
Once the first total is formed, selective bottom-up checks are applied using sampled ASP times estimated volumes for a set of common procedure categories, followed by channel checks on distributor and GPO purchasing behavior. In countries where data is thinner, gaps are handled through proxy procedure rates and import reliance signals, and those assumptions are then tested again in expert calls before finalizing.
For forecasting, we use scenario analysis supported by short variable-level projections, since procedure recovery, elective backlog normalization, and sterilization practice shifts do not move in a straight line every year. The final forecast is built by iterating assumptions on procedure growth, site-of-care shift, and kit standardization targets, and then keeping the year-to-year steps realistic.
Data Validation & Update Cycle
Outputs are validated through practical checks, including comparing implied kit spend per procedure against typical hospital procurement ranges and reviewing whether regional shares match known surgical activity splits. Where any large variance appears, the driver is traced back to the assumption level, and respondents are re-contacted when a single variable is found to be overly influential.
Before sign-off, the model and key calculations go through multi-step analyst reviews, and the final totals are re-checked for currency consistency and year labeling. The report is refreshed annually, and interim updates are completed when material events occur, such as major regulatory shifts, sharp pricing moves in disposables, or sudden changes in elective surgery volumes. Right before delivery, a final pass is completed so clients receive the most current view available.
Mordor Intelligence's Surgical Kits Market Size Versus Other Published Estimates
Published market sizes for surgical kits often differ because the study boundaries are not identical, and because procedure volume, kit adoption, and pricing are treated with different levels of detail. The spread usually comes from what is counted as a kit, how adjacent device categories are handled, and how quickly pricing is allowed to move over the forecast window.
The table shows a meaningful gap versus higher published values. In Mordor Intelligence's model, the scope is kept on kit-based packs and procedure sets used around surgeries, instead of folding in broader surgical device product families like sutures and electrosurgical tools as standalone markets. Differences also come from how procedure growth is interpreted, where some estimates assume faster elective normalization globally, and from how currency timing and inflation are applied when converting local prices to USD.
Benchmark comparison
| Source | Market Size | Gaps in Research Methodology |
|---|---|---|
| Mordor Intelligence | USD 17.32 B (2025) | |
| Global Consultancy A | USD 30.80 B (2024) | Uses a broader definition that can blend procedure packs with wider surgical device categories and related consumables, which lifts the starting value. The forecast window and base year choice also differ, which changes the compounding path. |
| Industry Publisher B | USD 24.56 B (2025) | Includes product buckets such as sutures, staplers, and electrosurgical devices under the same umbrella, which expands the addressable value beyond kit-only procurement. Some assumptions appear to rely on uniform adoption rates across specialties without enough adjustment for site-of-care mix. |
Looking across the three figures, most of the difference can be explained by scope expansion into adjacent surgical device revenue and by how quickly adoption and prices are stepped forward. By tying the size to procedure-driven demand signals and then sanity-checking with supplier and channel inputs, we end up with a market value that is easier to trace back to clear, repeatable drivers.
Key Questions Answered in the Report
How large will the surgical kits market be by 2031?
It is projected to reach USD 25.57 billion by 2031, growing at a 6.72% CAGR over 2026-2031.
Which segment shows the fastest growth in surgical kits?
ENT & thoracic procedure packs lead with a projected 9.25% CAGR through 2031.
Why are ambulatory surgery centers important for kit demand?
Medicare payment parity shifted millions of procedures to ASCs, and these centers prefer standardized packs that lower per-case supply costs.
What material innovations are influencing kit design?
Bio-based drapes and antimicrobial-coated non-woven fabrics are gaining traction as hospitals pursue sustainability and infection-control targets.
How is regulation shaping sterilization choices?
Stricter EPA rules on ethylene-oxide emissions and hospital demand for faster turnover are accelerating adoption of low-temperature plasma systems.
What is driving e-commerce growth in surgical kit distribution?
Group purchasing organizations are deploying digital catalogs that give hospitals live pricing and cut procurement cycle times by about 25%.