
Surgical Instrument Tracking Market Size and Share
Market Overview
| Study Period | 2020 - 2031 |
|---|---|
| Market Size (2026) | USD 362.64 Million |
| Market Size (2031) | USD 673.42 Million |
| Growth Rate (2026 - 2031) | 13.18 % |
| Fastest Growing Market | Asia Pacific |
| Largest Market | North America |
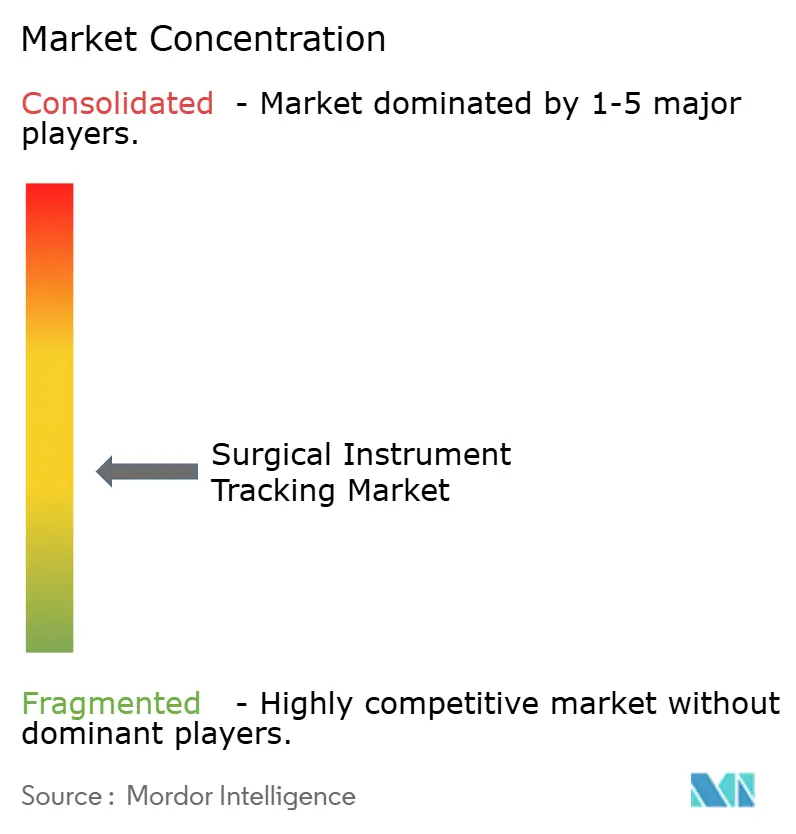
| Market Concentration | Medium |
Major Players
*Disclaimer: Major Players sorted in no particular order Image © Mordor Intelligence. Reuse requires attribution under CC BY 4.0. |
|
Surgical Instrument Tracking Market Analysis by Mordor Intelligence
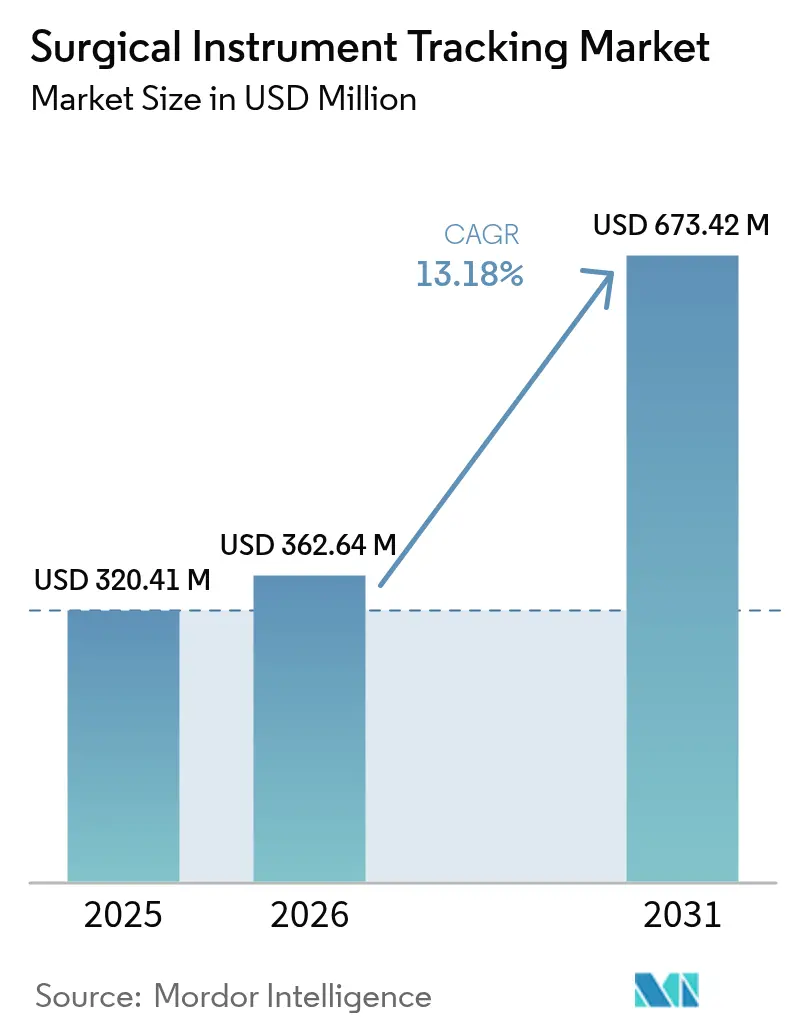
The surgical instrument tracking market size was valued at USD 320.41 million in 2025 and estimated to grow from USD 362.64 million in 2026 to reach USD 673.42 million by 2031, at a CAGR of 13.18% during the forecast period (2026-2031). This trajectory reflects tightening regulatory deadlines, the financial burden of retained surgical items that cost providers USD 2.4 billion every year, and the rapid pivot toward data-driven operating room (OR) environments. Care teams increasingly demand solutions that integrate with broader perioperative software rather than operate as stand-alone trackers, a shift illustrated by Johnson & Johnson MedTech’s Polyphonic ecosystem launched in 2024. RFID-enabled automation, mandatory device-identifier (UDI) regulations, and insurer penalties for never events round out the core growth drivers that keep the surgical instrument tracking market firmly on a double-digit expansion path.
Key Report Takeaways
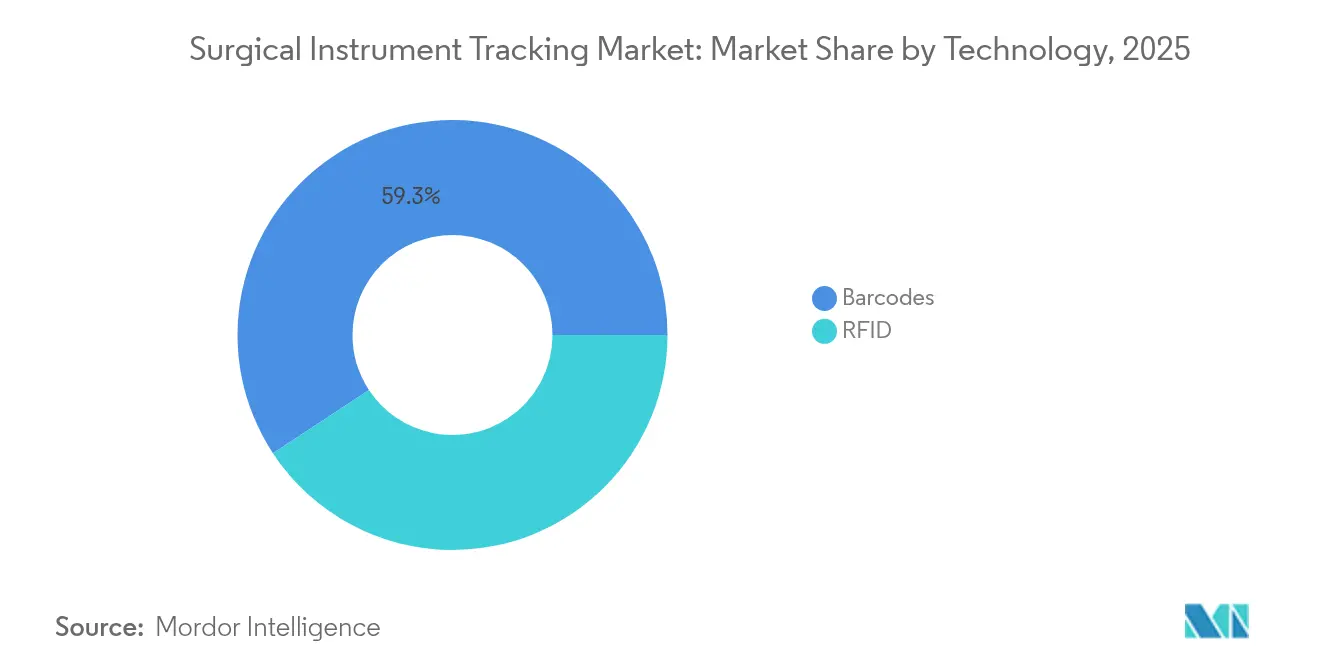
- By technology, barcode systems commanded 59.26% of 2025 surgical instrument tracking market share, while RFID is forecast to expand at a 14.05% CAGR through 2031.
- By component, software platforms captured 47.20% revenue share in 2025; hardware is projected to grow fastest at a 14.12% CAGR to 2031.
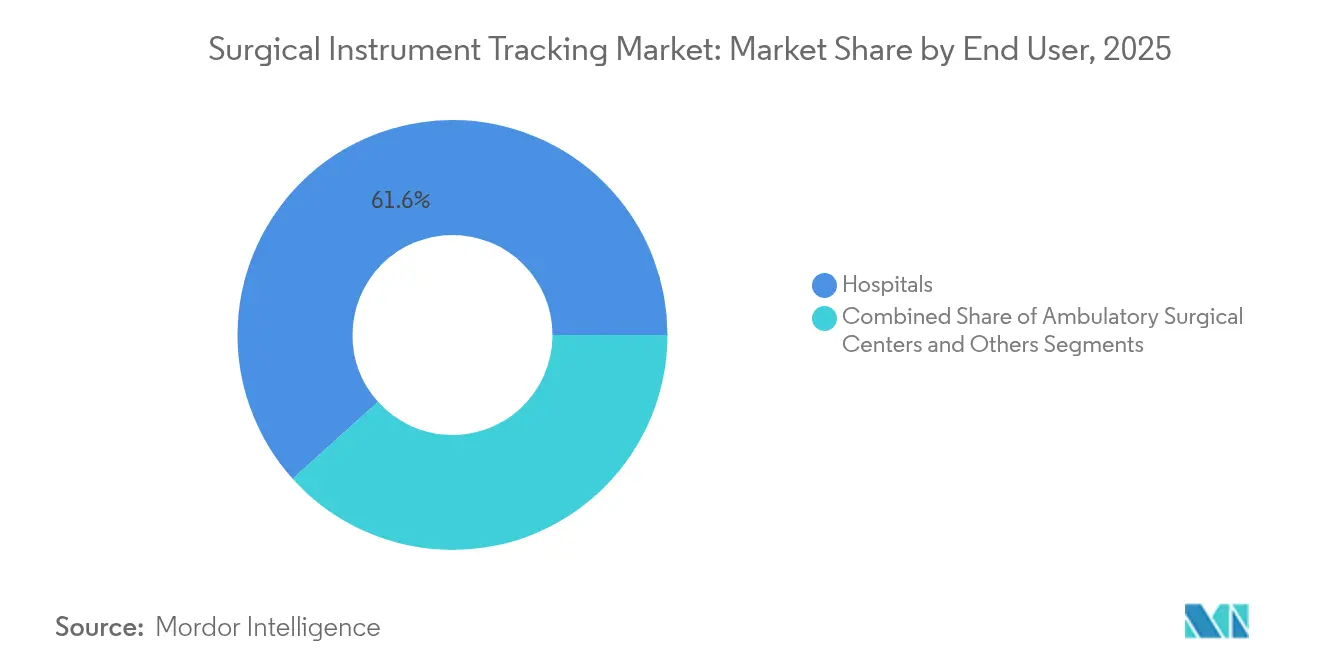
- By end user, hospitals held 61.65% of the surgical instrument tracking market in 2025, yet ASCs are advancing at a 13.95% CAGR through 2031.
Note: Market size and forecast figures in this report are generated using Mordor Intelligence’s proprietary estimation framework, updated with the latest available data and insights as of 2026.
Market Trends and Insights
Drivers Impact Analysis of Surgical Instrument Tracking Market*
| Driver | (~) % Impact on CAGR Forecast | Geographic Relevance | Impact Timeline |
|---|---|---|---|
| Mandatory FDA UDI & EU MDR compliance deadlines | +3.1% | North America & EU primary, APAC secondary | Short term (≤ 2 years) |
| Increasing number of complex surgical procedures | +2.8% | Global, concentrated in North America & EU | Medium term (2-4 years) |
| Rapid RFID-IoT adoption in healthcare supply chains | +2.5% | APAC core, spill-over to North America & EU | Medium term (2-4 years) |
| Rising hospital focus on OR cost & waste reduction | +2.2% | Global | Long term (≥ 4 years) |
| Interoperable “Digital-OR” ecosystems accelerating demand | +1.9% | North America & EU, expanding to APAC | Long term (≥ 4 years) |
| Insurer penalties for retained surgical items | +1.7% | North America primary, EU secondary | Short term (≤ 2 years) |
| Source: Mordor Intelligence | |||
Mandatory FDA UDI & EU MDR Compliance Deadlines
Hospitals and device makers now face overlapping UDI milestones in the US and EU, where EUDAMED requires database registration for reusable instruments in Q1 2026 [1]Rebecca Brewer, “Preparing for EU EUDAMED,” USDM, usdm.com . Non-compliance bars market entry, making tracking systems essential for both regulatory data capture and exchange with GUDID and EUDAMED. Procurement teams give preference to vendors with proven audit trails, global unique device identifier (UDI) compatibility, and dual-database connectivity, narrowing the competitive field to suppliers with the widest compliance footprints.
Rapid RFID-IoT Adoption in Healthcare Supply Chains
IoT connectivity elevates RFID tags from passive identifiers to nodes that broadcast location, cycle counts, and sterilization status in real time. Innovative Perioperative Technologies leverages AT&T’s global SIM to deliver predictive maintenance dashboards across hospital networks. Advances in antenna design counteract signal loss in metal-dense ORs, while middleware integrations feed data into ERP platforms for automated re-ordering. Facilities now justify projects on operational-intelligence gains rather than barcode replacement alone.
Rising Hospital Focus on OR Cost & Waste Reduction
Peer-reviewed studies reveal that only 13–29% of tray instruments are used, imposing USD 0.51 in excess reprocessing cost per device. Analytics from the Duke Institute for Health Innovation demonstrate tray-optimization cuts of 46–66%, lowering sterilization labor hours and freeing autoclave capacity [2]Duke Institute for Health Innovation (DIHI), "RFID surgical instrument tracking and optimization of the operating room," dihi.org. The ability to quantify under-utilized inventory shifts tracking from a safety initiative to a lean-operations mandate.
Interoperable “Digital-OR” Ecosystems Accelerating Demand
Digital-surgery suites such as Johnson & Johnson’s Polyphonic aggregate robotic video, patient data, and instrument status into a single interface [3]Johnson & Johnson “Polyphonic Digital Ecosystem Overview,” jnjmedtech.com . Tracking vendors that provide open APIs for robotic platforms, imaging workstations, and AI analytics gain priority over closed systems. Hospitals view interoperability as insurance against vendor lock-in and as a prerequisite for cross-facility benchmarking.
Restraints Impact Analysis of Surgical Instrument Tracking Market*
| Restraint | (~) % Impact on CAGR Forecast | Geographic Relevance | Impact Timeline |
|---|---|---|---|
| High upfront hardware & software costs | -1.8% | Global, more acute in emerging markets | Short term (≤ 2 years) |
| Cyber-security & data-privacy concerns | -1.2% | Global; heightened in EU & North America | Medium term (2-4 years) |
| RF signal attenuation in metal-dense OR environments | -0.9% | Global | Medium term (2-4 years) |
| Lengthy validation cycles for embedded RFID tags | -0.7% | Global; stricter in regulated markets | Long term (≥ 4 years) |
| Source: Mordor Intelligence | |||
High Upfront Hardware & Software Costs
A full RFID deployment—including tags, readers, middleware, and systems integration—can exceed USD 100,000 per site, a barrier for smaller hospitals. However, Emerald benchmarking shows payback in 18–24 months through lost-instrument avoidance and lower tray counts. Phased rollouts that start with high-value ortho and cardiac sets allow capital costs to span multiple budget cycles while proving incremental ROI.
Cyber-Security & Data-Privacy Concerns
RFID networks extend hospital attack surfaces. HIPAA and GDPR push encryption, role-based access, and network segmentation as baseline security requirements. Vendors counter by offering on-premise gateways, tokenized IDs, and zero-trust architectures to reassure security teams that tracking data will not compromise EHRs.
*Our forecasts treat driver/restraint impacts as directional, not additive. The impact forecasts reflect baseline growth, mix effects, and variable interactions.
Surgical Instrument Tracking Market Segment Analysis
By Technology:
RFID Gains Despite Barcode DominanceBarcode scanning commanded 59.26% of 2025 revenue as many facilities retained legacy printers and scanners for sterile processing. Yet RFID’s 14.05% CAGR underscores a realignment toward automated counts, bulk reading, and IoT integration that barcodes cannot match. RFID’s ability to read through wrapped trays and log sterilizer passes in seconds shortens turnover times, a key KPI for busy ORs. Hybrid workflows—barcode on low-value devices, RFID on high-value sets—let hospitals balance cost and speed while preparing for full automation. FDA guidance on embedding RFID transponders in reusable instruments elongates validation timelines but, once cleared, unlocks life-cycle data unattainable with adhesive labels.
Second-generation ultra-high-frequency (UHF) tags now withstand repeated autoclave cycles and maintain read ranges beyond one meter, reducing mis-reads. The shift signals that the surgical instrument tracking market will eventually converge on RFID as default, even though barcodes remain suitable for budget-sensitive settings. Vendors positioned with dual-technology scanners and cloud-agnostic middleware are best placed to serve this transitional landscape.


By Component:
Software Leadership Drives Hardware GrowthSoftware comprised 47.20% of 2025 revenue, reflecting demand for analytics engines that translate scans into actionable dashboards. However, hardware is projected to rise at a 14.12% CAGR as hospitals retrofit central-sterile services with RFID tunnels, cabinet readers, and handheld scanners. This sequencing—hardware first, analytics second—means that platform vendors must package hardware, firmware, and cloud subscriptions in modular tiers. The surgical instrument tracking market size attributed to hardware is set to advance quickly as Asia-Pacific and smaller US systems complete their foundational buildouts before layering AI modules.
Software differentiation now centers on predictive algorithms that flag over-stocked trays, forecast instrument fatigue, and auto-populate regulatory forms. API libraries that connect to Epic, Cerner, and SAP create stickiness by embedding tracking data into daily clinical and procurement workflows. Service revenues also rise as facilities rely on vendor teams for data cleansing, tag replacement, and process audits, cementing long-term contracts and cross-selling opportunities.
By End User:
Hospitals Lead While ASCs AccelerateHospitals held 61.65% of 2025 revenue thanks to multi-specialty case mixes and higher retained-instrument risk profiles. They require enterprise-scale platforms that sync with EHRs, sterilizers, and robotic stacks. In contrast, ASCs focus on rapid procedural throughput and slimmer staff ratios. Their 13.95% CAGR stems from a business model where a single retained item erodes tight margins and jeopardizes payer negotiations. The surgical instrument tracking market size for ASCs is expected to expand as pay-for-performance contracts push them to document every instrument’s chain of custody.
Specialty orthopedic and dental centers fall into the “Others” bucket, a niche now reachable via cloud-hosted software and low-cost tags. Vendors tailoring quick-deployment kits—with pre-loaded procedure templates and minimal IT overhead—are capturing these greenfield accounts. Smith+Nephew’s 2024 partnership with HOPCo shows how orthopedic supply vendors bundle tracking analytics to differentiate implant-plus-instrument offerings.
Geography Analysis
North America Surgical Instrument Tracking Market
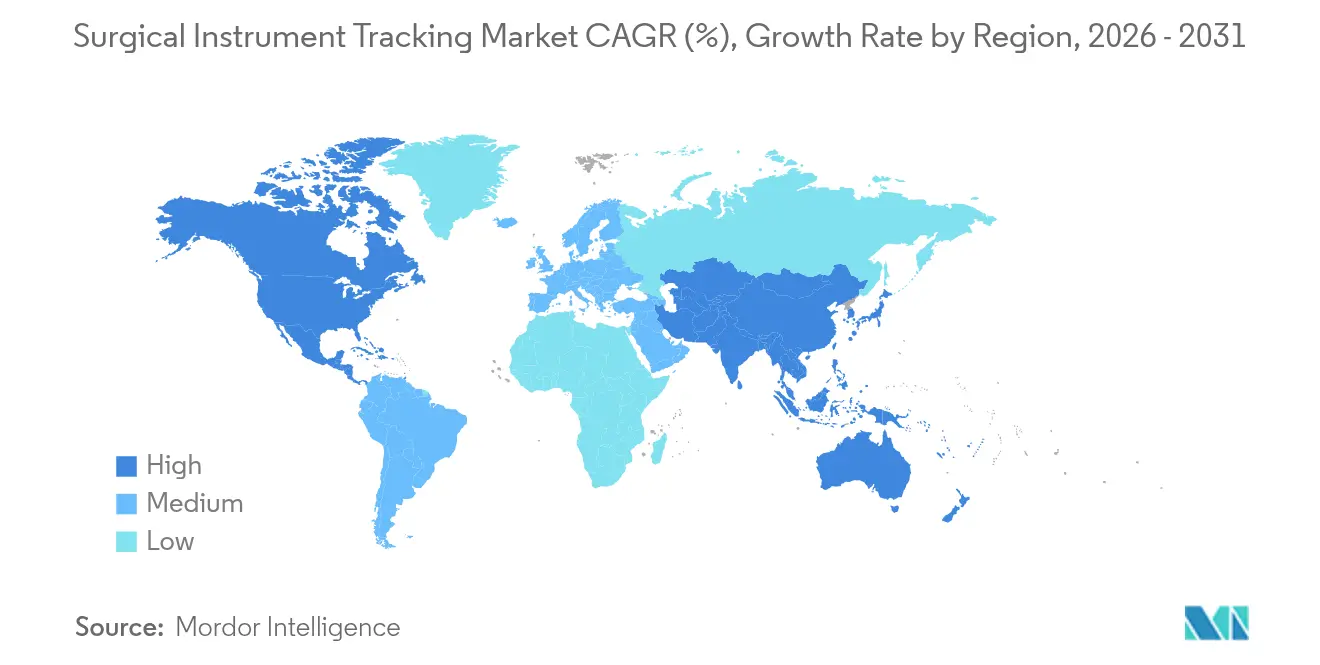
North America retained 41.52% revenue leadership in 2025, propelled by early-stage UDI enforcement and payer refusal to reimburse for never events. Hospitals routinely cite audit preparedness and litigation avoidance when budgeting for tracking projects. The region also concentrates leading hardware innovators and cloud-EHR vendors, shortening integration cycles. New US state laws requiring digital chain-of-custody logs for OR packs further institutionalize demand.
Europe Surgical Instrument Tracking Market
Europe proceeds steadily under the EU MDR timetable. Although budgets are tighter, the compulsory EUDAMED upload of device identifiers drives a baseline requirement for instrument registration. GDPR restrictions elevate supplier scrutiny on data residency and encryption, pushing vendors to deploy EU data centers and secure APIs that satisfy multi-country deployments. Sustainability rules, including circular-economy targets, incentivize platforms that extend instrument lifespans through data-driven maintenance.
APAC Surgical Instrument Tracking Market
Asia-Pacific is the fastest-growing region at 14.08% CAGR through 2031, energized by expanding health-insurance access, new hospital construction, and a technology-friendly regulatory mood. Singapore’s AI-assisted OR pilots, China’s smart-hospital grants, and India’s public-private drive for medical-device traceability create fertile ground. Suppliers that localize language support and offer subscription financing meet the price-sensitivity of emerging markets without sacrificing feature depth. The surgical instrument tracking market share gains in Asia-Pacific will likely dilute North American dominance as multi-site chains scale deployments across the region.

Regulatory Landscape
Surgical instrument tracking increasingly links to Unique Device Identification (UDI) and quality-system requirements across major markets. In the United States, the FDA UDI system (issued in 2013) supports standardized device identification and database reporting via GUDID, which pushes manufacturers and providers toward traceable workflows for reusable instruments and associated sets. In Europe, Regulation (EU) 2017/745 (EU MDR) extends UDI assignment and traceability obligations to reusable surgical instruments, increasing the need for direct marking, structured data capture, and auditable chain-of-custody records within sterile processing.
EU compliance timelines have become more time-bound, as European Commission Decision (EU) 2025/2371 (dated 26 November 2025) declared the UDI/Devices module in EUDAMED functional, with mandatory use beginning 28 May 2026. Sterilization validation standards also shape what tracking platforms must document: ISO 17665:2024 (published March 2024) for moist heat sterilization is recognized by the FDA for premarket submissions, with a transition period ending 04 July 2027. Taken together, these requirements increase demand for systems that combine UDI-ready master data, secure audit trails, and sterilization-cycle documentation that can stand up to inspections and internal quality audits.
Competitive Landscape
The market remains moderately fragmented; no single vendor exceeds a 15% global revenue share, and regional preferences complicate any one company’s bid for dominance. Fortive’s 2024 acquisition of Censis Technologies typifies larger industrial-technology firms folding niche tracking vendors into broader healthcare portfolios. Consolidators seek to bundle instrument tracking with broader sterile-processing and supply-chain suites, raising switching costs for providers.
Competitive positioning has shifted from sensor innovation to full-stack credibility—proof of UDI compliance, EU MDR readiness, HIPAA/GDPR security, and interoperability with every major EHR and ERP. AI analytics that optimize tray composition, recommend preventive maintenance, and forecast demand now serve as tiebreakers in RFPs. Smaller specialists survive by offering plug-and-play modules for ASCs and dental suites, often white-labeling software for OEM partners. Pricing models trend toward software-as-a-service (SaaS) with tiered analytics, encouraging shorter contracts that let hospitals upgrade modules without forklift replacements.
Strategic partnerships flourish: Aesculap renewed its alliance with Ascendco Health in May 2025 to push deeper into US hospital networks, while Crothall Healthcare joined Ascendco in 2024 to blend environmental services with sterile-processing analytics. Vendors also court robotics manufacturers, betting that future OR suites will treat instrument data as one of several feeds into AI decision-support dashboards. As consolidation advances, supplier differentiation will hinge on global service footprints, regulatory expertise, and proof that analytics translate into quantifiable cost savings.
Surgical Instrument Tracking Industry Leaders
-
Censis Technologies Inc.
-
Syrma Technology
-
Steris PLC
-
Keir Surgical Ltd
-
Case Medical
- *Disclaimer: Major Players sorted in no particular order
Surgical Instrument Tracking Market Companies Covered in this Report
- STERIS
- Getinge AB (T-DOC)
- Censis Technologies / Fortive
- Becton Dickinson & Co.
- Mobile Aspects Inc.
- Key Surgical (Stryker)
- Belimed
- Stanley Healthcare (CenTrak)
- Xerafy Singapore Pte Ltd.
- ScanCARE
- Case Medical
- NuTrace
- Spa Track Medical Ltd.
- Keir Surgical
- Vizbee RFID Solutions
- FlexScan RTLS
- Healthtech Pivot
- Ternio Group
- Systems iTrayce
- Olympus Corp. (HX-Flow)
- Syrma SGS

Market Opportunities and Future Outlook
The main opportunity is tied to regulatory convergence and hospital automation. In February 2026, the FDA transitioned from the legacy Quality System Regulation (QSR) to the Quality Management System Regulation (QMSR), directly incorporating ISO 13485:2016 concepts into US quality expectations and reinforcing the need for consistent identification, documentation, and traceability across reusable instruments. Separately, UDI implementations that reference GS1 standards, which are supported across multiple jurisdictions, create room for vendors that can harmonize identifier formats, master data governance, and reporting outputs across hospital groups operating in more than one regulatory region.
Hospital logistics modernization also creates pull-through that goes beyond compliance-only deployments, particularly where instrument sets move across multiple sites. In February 2026, Sengkang General Hospital completed an Automated Storage and Retrieval (AS/RS) implementation integrated with barcode tracking, a Warehouse Management System (WMS), and WareNavi control software to manage surgical instrument sets, indicating demand for solutions that connect sterile processing to enterprise inventory and automated storage. Evidence from implementation-focused research supports that end-to-end tracking can improve operations: an April 2026 multi-campus integrated information system study reported sterile item expiry rates falling from 0.089% to 0.025%, supporting demand for platforms that connect personnel, devices, items, and patients and support analytics for tray optimization, expiry prevention, and instrument lifecycle decisions.
Recent Industry Developments in Surgical Instrument Tracking Market
- May 2026: The European Commission moved EUDAMED UDI/Devices into mandatory use starting 28 May 2026, following its functional status decision in late 2025. This tightened the operational need for EU-facing manufacturers and healthcare providers to maintain electronic UDI-ready data and audit trails for reusable instruments, supporting software-led tracking platforms that can support structured registration and traceability workflows.
- May 2025: Aesculap and Ascendco Health extended their strategic partnership to expand surgical instrument tracking deployments across US health systems. The renewal reinforced the shift from point solutions toward scaled, multi-facility rollouts that combine sterile-processing workflows, instrument visibility, and implementation support.
- January 2024: Censis Technologies launched CensisAI2 Instrument Recovery to help identify lost, missing, damaged, and unused surgical instruments. The release pointed to a market shift toward analytics layered on top of tracking data, strengthening the value proposition beyond basic identification and location logging.


Surgical Instrument Tracking Market Report Scope and Research Methodology
Market Definition and Coverage
This market covers the revenue generated from systems used to identify, locate, and trace surgical instruments through the operating room and sterile processing workflow, so sets and single instruments can be accounted for across cleaning, assembly, sterilization, storage, and use.
Scope exclusions: This sizing does not count general hospital asset tracking for non-surgical equipment, or inventory software that is not used for surgical instrument level tracking.
Segments Covered in This Report
-
By Technology
- Barcodes
- RFID
-
By Component
- Software
- Hardware
- Services
-
By End User
- Hospitals
- Ambulatory Surgical Centers
- Others
-
By Geography
-
North America
- United States
- Canada
- Mexico
-
Europe
- Germany
- United Kingdom
- France
- Italy
- Spain
- Rest of Europe
-
Asia-Pacific
- China
- Japan
- India
- Australia
- South Korea
- Rest of Asia-Pacific
-
Middle East and Africa
- GCC
- South Africa
- Rest of Middle East and Africa
-
South America
- Brazil
- Argentina
- Rest of South America
-
North America
Data Sources, Market Sizing, and Validation
Desk Research
Desk research started with public healthcare and procedure signals that explain why instrument tracking budgets rise and fall over time. We referenced sources such as the US FDA (UDI program), CDC and AHRQ materials on patient safety and retained surgical items, and CMS releases that shape hospital compliance priorities. For demand context, we also reviewed OECD health statistics and selected national health ministry dashboards that track surgical procedure volumes and hospital capacity.
To connect that context to commercial adoption, we used company filings, annual reports, and investor presentations that describe solution mix and customer focus, followed by reputable press and association websites tied to perioperative practice and sterile processing. Patent databases were checked for technology direction (barcode labeling, RFID tags, and reader infrastructure) and to understand where innovation is active. The desk sources listed here are not exhaustive, and many other public references were used for data collection, cross-checks, and clarifying assumptions.
Primary Interviews and Surveys
Primary work focused on validating how hospitals and ambulatory surgical centers buy and roll out instrument tracking, and what gets counted as software, hardware, and services revenue in a typical deployment. We spoke with a mix of solution-side and user-side experts across APAC, EMEA, and the Americas to confirm adoption pace, pricing ranges, and the practical links between tracking needs and surgery volumes.
Distribution of primary research fieldwork respondents
| Company type | Respondent position | Region |
|---|---|---|
| Top tier: 38% | CXOs: 15% | APAC: 45% |
| Mid tier: 47% | Functional/Unit leaders: 25% | EMEA: 35% |
| Smaller Players: 15% | Managers: 60% | Americas: 20% |
Market-Sizing & Forecasting
Sizing was built using a top-down demand pool approach where procedure volumes and sterile processing throughput are used to reconstruct the addressable set of facilities that realistically implement tracking, and then the spend per site is applied by solution component. Because definitions can drift, we corroborated totals with selective bottom-up approximations, such as sampled ASP ranges for software subscriptions, readers and scanners, and tags, followed by channel checks on implementation and support intensity.
Key inputs that shaped the model included surgical procedure volume trends, the installed base growth of barcode versus RFID workflows, average instrument set counts per operating room, replacement and consumable cycles for tags and labels, and the share of sites that outsource versus run sterile processing in-house. When the market was forecast, scenario analysis was used so growth could be tied to a few practical drivers, including regulatory compliance pressure, staffing constraints in sterile processing, and the pace of digitization in perioperative informatics. Where bottom-up information was thin in smaller countries, we used proxy indicators like hospital bed counts and surgery rates, and then adjusted the implied spend levels using primary feedback before finalizing.
Data Validation & Update Cycle
Before sign-off, outputs were checked against independent signals, including regional procedure trends, public safety and compliance milestones, and the expected mix shift between barcode and RFID deployments. If a country or component line item moved too sharply versus these signals, assumptions were revisited and respondents were re-contacted to confirm whether a real buying change occurred or a modeling error had slipped in.
A multi-step review is followed so the logic is consistent across geographies and the math ties out across components and end users. The report is refreshed annually, and interim updates are triggered when material events occur, such as major regulatory updates or sharp changes in hospital capital spending. Before delivery, an analyst performs a fresh pass so clients receive the latest updated view.
Mordor Intelligence's Surgical Instrument Tracking Market Size Versus Other Published Estimates
Published values for surgical instrument tracking do not always line up, even when the market name looks the same, because the counted revenue streams and time frames can shift from one study to another. Differences also come from how firms treat hardware refresh cycles, service revenue recognition, and the pace at which barcode systems convert to RFID.
Procedure volume trends, sterile processing workload indicators, and the observed split of revenue between software, hardware, and services are the checks that keep Mordor Intelligence's 2025 estimate aligned to what hospitals and ambulatory surgical centers actually deploy for instrument-level traceability. When other studies broaden scope into adjacent hospital asset tracking, or assume faster RFID conversion without consistent site-level validation, their totals can swing meaningfully.
Benchmark comparison
| Source | Market Size | Gaps in Research Methodology |
|---|---|---|
| Mordor Intelligence | USD 320.41 M (2025) | |
| Global Consultancy A | USD 278.52 M (2025) | Uses a narrower system definition that tends to down-weight implementation services and ongoing support, and it often applies more conservative site adoption in smaller regions, which pulls down the near-term value. |
| Industry Research Group B | USD 343.80 M (2024) | Anchors the base year earlier and applies a broader capture of tracking-related spend that can include more RFID-related infrastructure and adjacent workflow software, which lifts the stated total versus instrument-only tracking in hospital workflows. |
Across the table, most of the spread can be explained by scope boundaries, base-year selection, and how component revenues are counted over the deployment life cycle. By tying assumptions back to observable hospital activity levels and realistic deployment mixes, the resulting number stays transparent and easier to reproduce when the inputs are updated.


Key Questions Answered in the Report
What is the current surgical instrument tracking market size?
The surgical instrument tracking market size stands at USD 362.64 million in 2026, with expectations to reach USD 673.42 million by 2031 at a 13.18% CAGR.
Which technology segment is growing fastest?
RFID systems are expanding at a 14.05% CAGR through 2031, outpacing barcodes even though barcodes still hold the largest revenue share.
Why are hospitals investing heavily in tracking platforms?
Hospitals face mandatory UDI regulations, penalties for retained surgical items, and rising pressure to reduce tray-processing waste, all of which drive investment in comprehensive tracking solutions.
Which region offers the strongest growth opportunity?
Asia-Pacific is projected to grow at 14.08% CAGR, powered by hospital construction, rising surgical volumes, and government digitization programs.
How quickly can facilities achieve ROI on RFID deployments ?
Benchmarks show payback periods of 18–24 months once lost-instrument incidents fall and tray-optimization analytics cut reprocessing expenses.
Are cybersecurity issues limiting adoption?
Concerns over data privacy and network vulnerabilities do raise implementation hurdles, but vendors are responding with zero-trust architectures, encrypted tags, and segregated hospital networks to satisfy HIPAA and GDPR requirements.
Page last updated on:


 Your data is secure and never sold or shared.


