
Surgical Equipment Market Size and Share
Market Overview
| Study Period | 2020 - 2031 |
|---|---|
| Market Size (2026) | USD 21.42 Billion |
| Market Size (2031) | USD 31.62 Billion |
| Growth Rate (2026 - 2031) | 8.13 % |
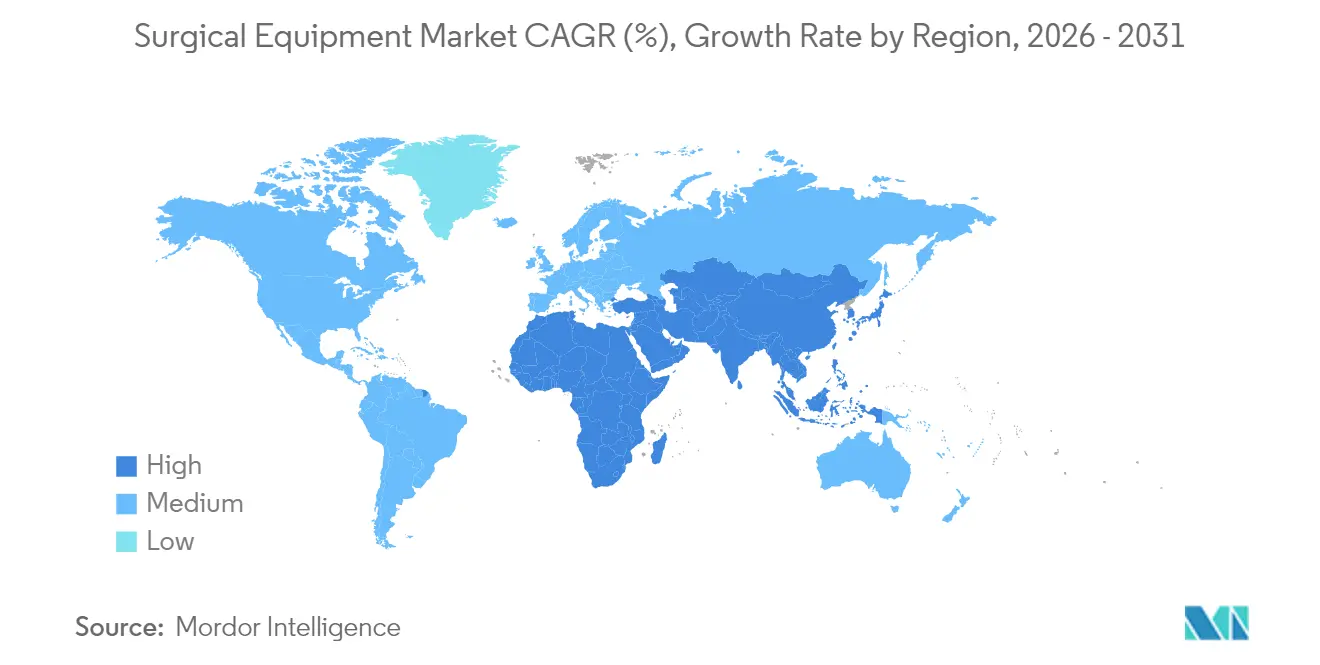
| Fastest Growing Market | Asia Pacific |
| Largest Market | North America |
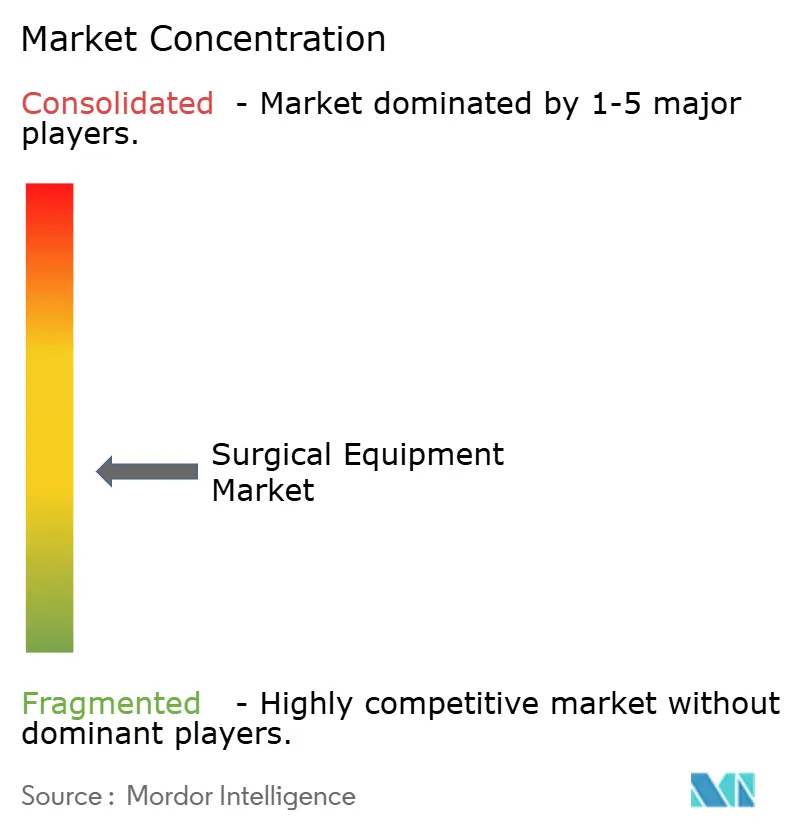
| Market Concentration | Medium |
Major Players *Disclaimer: Major Players sorted in no particular order Image © Mordor Intelligence. Reuse requires attribution under CC BY 4.0. | |
Surgical Equipment Market Analysis by Mordor Intelligence
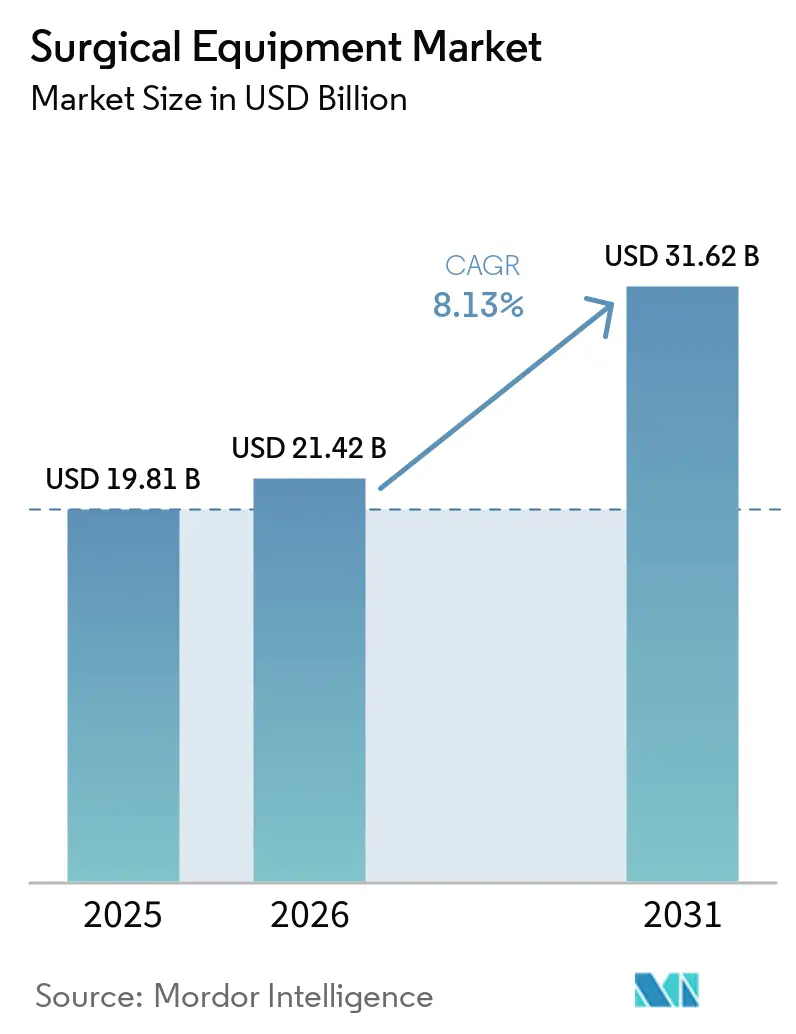
The Surgical Equipment market size is expected to grow from USD 19.81 billion in 2025 to USD 21.42 billion in 2026 and is forecast to reach USD 31.62 billion by 2031 at 8.13% CAGR over 2026-2031.
Rising procedure volumes strengthen the outlook, rapid uptake of minimally invasive techniques, and the growing presence of ambulatory surgical centers (ASCs). Powered and electrosurgical devices are set to lead product growth as clinicians seek instruments that cut, seal, and coagulate tissue in a single step. Asia-Pacific is on course to record the fastest regional expansion, reflecting capacity build-outs in China and India alongside steadily rising surgical volumes. Competitive intensity is growing as niche innovators challenge established brands with compact, workflow-specific systems designed for outpatient settings. Capital constraints in hospitals and ASCs are nudging suppliers toward flexible financing and per-procedure pricing, reshaping purchasing dynamics across the surgical equipment market.
Key Report Takeaways
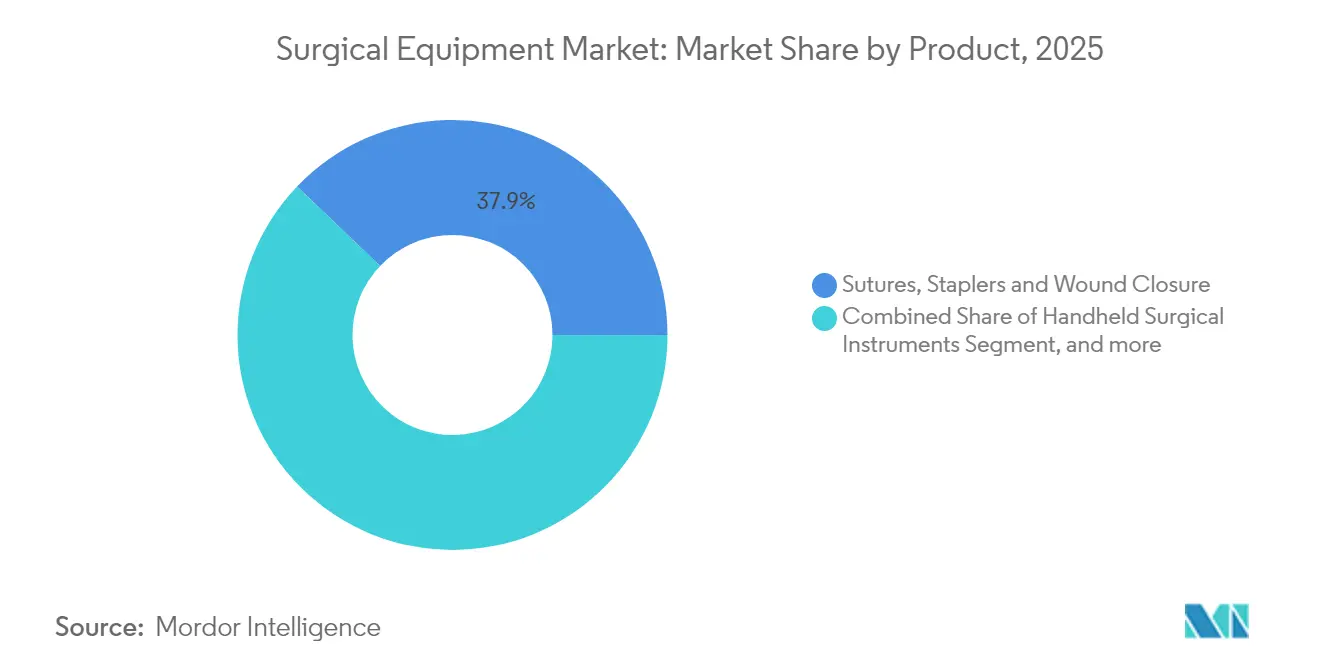
- By product type, sutures, staplers, and other wound-closure devices held 37.86% of the surgical equipment market share in 2025, while powered and electrosurgical devices are projected to grow at an 8.45% CAGR to 2031.
- By application, orthopedic and trauma surgeries commanded a 24.55% share of the surgical equipment market size in 2025, whereas plastic, cosmetic, and burn reconstruction is forecast to expand at an 8.76% CAGR through 2031.
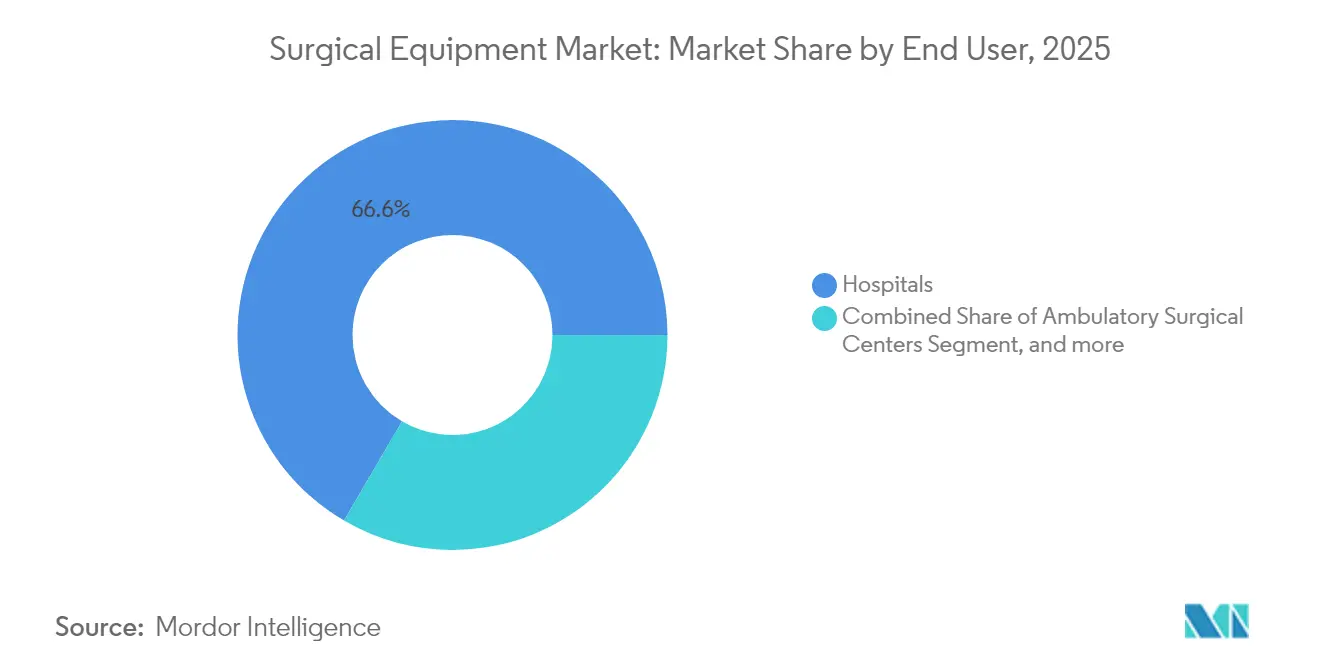
- By end user, hospitals maintained an 66.58% revenue share in 2025; ASCs are advancing at a 8.97% CAGR to 2031.
- By geography, North America led with 35.12% revenue share in 2025, while Asia-Pacific is projected to post an 8.69% CAGR between 2026 and 2031.
Note: Market size and forecast figures in this report are generated using Mordor Intelligence’s proprietary estimation framework, updated with the latest available data and insights as of 2026.
Market Trends and Insights
Drivers Impact Analysis of Surgical Equipment Market*
| Driver | (~) % Impact on CAGR Forecast | Geographic Relevance | Impact Timeline |
|---|---|---|---|
| Rising surgical procedure volumes | +2.1% | North America, Europe, Global | Medium term (2-4 years) |
| Increase in road-traffic and other accidents | +1.2% | Developing regions, Global | Short term (≤ 2 years) |
| Shift toward minimally invasive & robotic surgery | +2.5% | North America, Europe, Developed APAC | Medium term (2-4 years) |
| Growth of ASCs and outpatient care | +1.8% | North America, Emerging in Europe | Short term (≤ 2 years) |
| Adoption of disposable & single-use instruments | +1.0% | Developed markets, Global | Short term (≤ 2 years) |
| Expanding healthcare infrastructure in emerging economies | +1.9% | APAC, Middle East, Latin America | Long term (≥ 4 years) |
| Source: Mordor Intelligence | |||
Rising Surgical Procedure Volumes Driven by Aging & Chronic-Disease Prevalence
Procedure counts continue to climb, with roughly 235 million major operations performed each year. Orthopedic, cardiovascular, and oncology surgeries account for much of the incremental volume as global populations age and the burden of chronic disease rises.[1] Manufacturers are responding by tailoring instruments to high-volume specialties rather than offering broad, general-purpose sets, improving throughput and reducing waste. Orthopedic procedures are growing 7.2% annually, spurring demand for powered saws, drills, and navigation aids. Cardiovascular interventions are advancing 5.8% per year, prompting investment in hybrid operating rooms that combine imaging and minimally invasive capabilities. The net effect is a sustained need for reliable, procedure-specific systems that can withstand heavy daily utilization.
Rising Number of Road and Other Accidents
Road-traffic injuries and workplace trauma continue to elevate demand for fracture fixation hardware, portable imaging, and navigation systems that enable rapid intervention in emergency settings.[2] Beyond traditional plates and screws, trauma surgeons now seek integrated platforms capable of guiding screw placement in real time, shortening operative windows, and limiting repeat surgeries. Device makers have carved out a dedicated trauma segment within orthopedics, with growth outpacing general orthopedic equipment as hospitals expand major-injury centers and stock trauma-ready kits.
Accelerated Shift Toward Minimally Invasive & Robotic-Assisted Surgeries
Robotic and laparoscopic techniques have crossed the adoption threshold in urology, gynecology, and general surgery, bringing smaller incisions, quicker discharges, and fewer complications. Twenty new robotic systems are in development, promising competitive price points and vertical specialty expansion. Multi-visceral platforms capable of moving seamlessly from colorectal to thoracic cases are shifting the value equation toward adaptable robotic architectures. As device prices fall, mid-tier hospitals and high-volume ASCs are entering the market, widening the installed base and raising procedure counts for associated instruments and disposables.
Growth of Ambulatory Surgical Centers and Outpatient Care Models
ASCs currently perform 72% of U.S. procedures and are on track for a 25% volume jump by 2029, underpinned by 45-60% cost savings over hospital equivalents. Outpatient operators prioritize compact, easily sterilized devices that support fast room turnovers. Suppliers able to miniaturize consoles and bundle imaging and energy modalities into single units gain traction. Policy shifts that add complex orthopedic and cardiac codes to outpatient reimbursement lists are accelerating the case migration, compelling hospitals to reinvent surgical service lines and update equipment procurement strategies.
Restraints Impact Analysis of Surgical Equipment Market*
| Restraint | (~) % Impact on CAGR Forecast | Geographic Relevance | Impact Timeline |
|---|---|---|---|
| High capital and maintenance costs | -1.5% | Global, pronounced in price-sensitive markets | Medium term (2-4 years) |
| Stringent regulatory requirements | -0.8% | North America, Europe, Global | Medium term (2-4 years) |
| Shortage of skilled surgical workforce | -0.9% | Developing regions, Global | Long term (≥ 4 years) |
| Budget constraints delaying equipment upgrades | -0.7% | North America, Europe, Global | Short term (≤ 2 years) |
| Source: Mordor Intelligence | |||
High Capital and Maintenance Costs of Advanced Surgical Systems
A top-tier robotic platform can cost more than USD 2 million, with annual service contracts adding 10-15%. Smaller hospitals and ASCs often defer purchases or seek pay-per-use models that link expenses to utilization.[3] Leasing, profit-sharing, and risk-pooling agreements are gradually easing barriers, yet capital-intense systems remain concentrated in large academic centers.
Stringent Regulatory Approval & Compliance Requirements
Post-market surveillance mandates and unique device identifiers add complexity and cost to product launches. The United Kingdom’s evolving Medical Device Regulations and the FDA’s heightened scrutiny of AI-enabled devices lengthen approval timelines. Larger manufacturers can absorb these costs more readily, widening the competitive gulf between multinationals and start-ups.
*Our forecasts treat driver/restraint impacts as directional, not additive. The impact forecasts reflect baseline growth, mix effects, and variable interactions.
Surgical Equipment Market Segment Analysis
By Product:
Wound Closure Dominates While Electrosurgery AcceleratesSutures, staplers, and other closure devices held 37.86% of the surgical equipment market share in 2025, underlining their universal role across specialties. Barbed sutures that eliminate knot-tying have shaved an average 1 minute 43 seconds off cesarean section closure times, demonstrating workflow value. Johnson & Johnson’s ECHELON ENDOPATH Staple Line Reinforcement illustrates how biomaterial advances can protect tissue and reduce leaks.
Powered and electrosurgical systems are projected to expand at an 8.45% CAGR through 2031. Instruments such as Medtronic’s LigaSure Maryland jaw blend cutting and vessel-sealing, cutting operative steps, and collateral damage. Surgical retractors, handheld forceps, and surgical power tools remain essential staples, but the frontier lies in integrated consoles that merge energy, imaging, and smoke evacuation, streamlining the sterile field. The surgical equipment market size for powered devices is likely to gain further momentum as outpatient centers adopt multifunction towers for space efficiency.

By Application:
Orthopedics Leads While Aesthetics AcceleratesOrthopedic and trauma cases accounted for 24.55% of the surgical equipment market size in 2025. Stryker’s CD NXT power system, which offers real-time drilling depth feedback, highlights the push toward safer, data-rich joint reconstruction. Robotic guidance platforms such as Mako are widening minimally invasive joint-replacement adoption, shortening hospital stays, and lowering revision rates.
Plastic, cosmetic, and burn reconstruction procedures are forecast to grow at an 8.76% CAGR through 2031, buoyed by growing patient interest in aesthetic enhancements and refinements in regenerative tissue technology. Cardiovascular and thoracic surgery maintains solid demand owing to high disease prevalence, while neurosurgery benefits from improved intra-operative visualization. The surgical equipment industry continues to diversify, with bariatric and gynecologic specialties embracing robotic single-port platforms that reduce trocar entries and postoperative pain.
By End User:
Hospitals Dominate While ASCs SurgeHospitals controlled 66.58% of global revenue in 2025, leveraging multidisciplinary teams and intensive-care backups for complex surgeries. Rising operating costs, however, have stretched capital budgets; the average age of installed equipment has climbed as purchases are deferred. This dynamic opens doors for vendors offering upgrade paths and usage-based finance.
ASCs are growing at a 8.97% CAGR and redefining procurement criteria. Devices must be compact, quick to sterilize, and interoperable across specialties to justify floor space. The surgical equipment market size tied to ASCs is amplified by CMS rule changes that reimburse more complex orthopedic and cardiac codes outside hospital walls. Specialty clinics and physician offices remain niche but present opportunities for ultra-portable, battery-powered platforms.
Geography Analysis
North America Surgical Equipment Market
North America held 35.12% of 2025 revenue, driven by favorable reimbursement and early adoption of robotic and AI-enabled systems. Hospitals are under cost pressure, but ASCs are flourishing, reflecting payer incentives and patient preference for same-day procedures. Ongoing capital modernization delays have increased the average equipment life cycle, pushing providers toward service contracts and rental models. Nonetheless, U.S. and Canadian centers remain the proving ground for next-generation robotic and digital-surgery suites.
Europe Surgical Equipment Market
Europe presents a broad landscape anchored by robust public health systems. Germany, France, and the United Kingdom spearhead uptake of minimally invasive platforms. New Medical Device Regulations strengthen post-market oversight, raising compliance costs yet bolstering patient safety. Southern and Eastern European markets, upgrading legacy infrastructure, represent catch-up growth pockets where mid-priced, versatile instruments gain favor.
APAC Surgical Equipment Market
Asia-Pacific is the fastest-growing zone, advancing at an 8.69% CAGR through 2031. China is now the second-largest buyer of robotic theaters, supported by domestic manufacturers who tailor designs to local budgets. Japan leads in procedure volumes per capita, while India targets 15% annual device adoption via tax incentives and streamlined approvals. Southeast Asian nations are adding surgical suites in provincial hubs, fueling demand for turnkey, bundled equipment packages that include on-site training and service warranties.
MEA and South America Surgical Equipment Market
The Middle East & Africa and South America offer long-range potential as governments allocate larger health budgets to surgical infrastructure. Private-sector hospital chains in Brazil and the Gulf Cooperation Council are early adopters of robotic systems, setting benchmarks that public facilities strive to match.
Regulatory Landscape
The surgical equipment market is shaped by quality, usability, and post-market requirements that are becoming more harmonized, but remain more demanding across major jurisdictions. In the United States, the FDA began implementing the Quality Management System Regulation (QMSR) on February 2, 2026, aligning device quality-system expectations more closely with ISO 13485 and strengthening supplier controls and lifecycle compliance for manufacturers selling globally.
In Europe, the Medical Device Regulation (MDR) transition timelines continue to affect product availability and certification planning. Legacy device access is extended until December 31, 2027 for certain higher-risk devices and until December 31, 2028 for other classes, subject to defined application and compliance conditions overseen through notified bodies and competent authorities. At a global level, the International Medical Device Regulators Forum (IMDRF) published its Playbook for Medical Device Regulatory Reliance Programs on February 26, 2026, and a March 2026 industry joint workshop in Singapore reinforced operationalization through reliance-based pathways that can reduce duplicative review cycles for multinational surgical device portfolios.
Competitive Landscape
The surgical equipment market is moderately fragmented, with Medtronic, Johnson & Johnson, Stryker, and Intuitive Surgical occupying leading positions through broad portfolios and global supply chains. Technology-centric differentiation is intensifying; Medtronic is layering AI onto surgical planning to optimize staple line selection, whereas Johnson & Johnson is integrating digital tracking into orthopedic implant workflows. Twenty emerging robotic platforms are in the pipeline, signaling heightened rivalry and potential price pressure. Vertical integration is on the rise as manufacturers extend into imaging, software, and post-acute monitoring to lock in recurring revenue and deepen customer stickiness.
Niche challengers focus on single-specialty systems, cost-efficient disposables, or ASC-tailored mini consoles. Strategic acquisitions, such as Stryker’s purchase of Inari Medical to add mechanical thrombectomy devices, demonstrate how incumbents plug capability gaps and enter high-growth adjacencies. Ecosystem playbooks that bundle hardware, software, and analytics are becoming standard as buyers seek end-to-end solutions that simplify multi-vendor coordination.
Surgical Equipment Industry Leaders
-
CONMED Corporation
-
Olympus Corporation
-
Stryker Corporation
-
B Braun Melsungen AG
-
Smith & Nephew plc
- *Disclaimer: Major Players sorted in no particular order
Surgical Equipment Market Companies Covered in this Report
- Medtronic
- Johnson & Johnson
- Stryker
- B. Braun
- Olympus
- Boston Scientific
- Smiths Group
- Zimmer Biomet
- Conmed
- Intuitive Surgical
- Siemens Healthineers
- 3M
- Frankenman International Ltd.
- Meril Life Science
- Teleflex
- Karl Storz
- Arthrex
- Alcon
- Steris plc
- Surgical Holdings Ltd.
Market Opportunities and Future Outlook
Outpatient migration and the push for higher throughput create whitespace for compact, interoperable powered and electrosurgical platforms tailored to ASCs, where rapid room turnover and space constraints favor integrated energy and smoke management alongside simplified sterilization workflows. Evidence of supply-side positioning is visible in manufacturing investments for staples, sutures, and minimally invasive consumables: Healthium MedTech reported completing a Sri City (India) facility expansion in January 2026, increasing production capacity by over 40% for surgical staples, sutures, and minimally invasive devices. This aligns with demand for standardized, high-volume wound-closure and single-use instrument categories.
Regulatory and compliance shifts are also pushing opportunity toward vendors that can standardize quality systems, human factors documentation, and traceability across regions without slowing product refresh cycles. The FDA published final guidance on the content of human factors information for device marketing submissions in the Federal Register on May 29, 2026, and the QMSR rollout increases the payoff from ISO 13485-aligned global operating models. Portfolio expansion around robot-assisted and digitally enabled procedure ecosystems is reinforced through commercial alliances and capacity scaling, including Microbot Medicals June 2026 manufacturing agreement with Sanmina to increase production capacity for the LIBERTY Endovascular Robotic System, reflecting how contract manufacturing partnerships can accelerate availability of next-generation procedural platforms and their associated instrument and disposable pull-through.
Recent Industry Developments in Surgical Equipment Market
- May 2026: Olympus Corporation announced a definitive agreement to acquire BioProtect Ltd. for USD 270 million, expanding its urological technology portfolio, with closing targeted by the end of Q2 2026. The deal strengthens Olympus exposure to procedure-driven urology workflows and supports broader bundling of therapeutic platforms with instruments and related disposables. It also signals continued consolidation around differentiated surgical and endoluminal technologies.
- March 2026: CONMED entered a definitive agreement to sell global distribution rights for its Duraclip, Precisor, and Optibite gastroenterology product lines to Micro-Tech Endoscopy as part of its strategic exit from gastroenterology. The transaction reflects a portfolio refocus toward CONMEDs priority surgical franchises, including minimally invasive and laparoscopic procedures, smoke evacuation, and orthopedic soft tissue repair. For the market, it reshapes channel control and competitive intensity in specific procedural tool categories.
- February 2025: Stryker completed the acquisition of Inari Medical, expanding its portfolio with mechanical thrombectomy systems such as FlowTriever and ClotTriever. The acquisition broadened Stryker's procedure coverage in vascular interventions and reinforced its strategy of adding adjacent interventional capabilities that can be cross-leveraged with hospital accounts. It also increased competitive pressure on incumbents offering peripheral vascular and venous thromboembolism solutions.
Surgical Equipment Market Report Scope and Research Methodology
Market Definition and Coverage
This market covers revenue generated from surgical equipment used to perform, support, and close surgical procedures, across hospitals and outpatient surgical settings. It includes core surgical tools, energy and powered devices, and wound-closure products that are procured for operating and procedure rooms.
Scope exclusions: We exclude capital imaging systems, full surgical robots, sterilization infrastructure, and general operating room furniture unless they are bundled within the surgical equipment categories being priced in the model.
Segments Covered in This Report
- By Product
- Handheld Surgical Instruments
- Forceps & Graspers
- Scalpels & Blades
- Retractors & Dilators
- Powered & Electrosurgical Devices
- High-frequency Electrosurgery Units
- Ultrasonic & Plasma Energy Systems
- Surgical Power Tools
- Sutures, Staplers & Wound Closure
- Absorbable Sutures
- Non-absorbable Sutures
- Manual Staplers
- Sealants & Tissue Adhesives
- Others
- Handheld Surgical Instruments
- By Application
- Orthopedic & Trauma
- Cardiovascular & Thoracic
- Obstetrics & Gynecology
- Neurosurgery & Spine
- Plastic, Cosmetic & Burn Reconstruction
- Gastrointestinal & Bariatric
- Other Surgeries
- By End User
- Hospitals
- Ambulatory Surgical Centers
- Specialty Clinics & Physician Offices
- By Geography
- North America
- United States
- Canada
- Mexico
- Europe
- Germany
- United Kingdom
- France
- Italy
- Spain
- Rest of Europe
- Asia-Pacific
- China
- Japan
- India
- Australia
- South Korea
- Rest of Asia-Pacific
- Middle East & Africa
- GCC
- South Africa
- Rest of Middle East & Africa
- South America
- Brazil
- Argentina
- Rest of South America
- North America
Data Sources, Market Sizing, and Validation
Desk Research
Desk research is used to set the base structure of demand and to anchor key assumptions that interviews later confirm. We mainly rely on public healthcare statistics and procedure volumes, such as those available from sources like the World Health Organization, OECD health data, the US CDC, and the US FDA device databases. We also review select peer reviewed clinical journals to understand procedure mix and technology adoption.
For supply and pricing context, we review company annual reports, investor decks, and official trade and customs statistics where surgical instrument and device codes are informative, plus reputed medical association websites and hospital procurement publications. In parallel, we use paid subscription data for company financials and for patent databases to track innovation intensity and product launches that can shift average selling prices over time. The examples listed above are not exhaustive, and we also pulled from other public sources for data collection, validation, and clarification.
Primary Interviews and Surveys
Primary work was used to test what desk research cannot fully explain, especially on pricing, replacement cycles, and mix shifts between handheld tools, powered and electrosurgical devices, and sutures and staplers. We spoke with manufacturers, distributors, group purchasing and procurement functions, surgeons, and operating room managers across major regions, so that utilization patterns and purchasing pathways were captured before finalizing assumptions.
Distribution of primary research fieldwork respondents
| Company type | Respondent position | Region |
|---|---|---|
| Top tier: 39% | CXOs: 13% | APAC: 48% |
| Mid tier: 40% | Functional/Unit leaders: 27% | EMEA: 32% |
| Smaller Players: 21% | Managers: 60% | Americas: 20% |
Market-Sizing & Forecasting
Sizing starts with a top-down build that reconstructs the addressable demand pool using surgical procedure volumes, facility counts, and typical equipment use per procedure. We then convert the demand into value using region-specific pricing benchmarks.
Once the global total is formed, we cross-check it with selective bottom-up approximations, such as supplier revenue mapping by product group and channel checks on average selling prices. This helps correct for overcounting and undercounting when product definitions or coverage differ across sources.
Key inputs that shape the model include annual procedure growth by specialty, adoption of minimally invasive approaches that change instrument mix, utilization of electrosurgical and powered tools per case, sutures and staplers usage intensity, replacement and maintenance cycles, and currency timing for multi-country normalization. Where bottom-up signals are incomplete for smaller markets, we use proxy ratios (per-procedure consumption and per-facility purchasing) and validate them with local interviews.
For forecasting, we run scenario analysis using short-cycle indicators, such as elective surgery backlog normalization, direction of healthcare spend, and procurement budget expectations shared by respondents. The forecast remains traceable to measurable drivers, and we make small adjustments when primary inputs indicate a near-term pricing or mix change.
Data Validation & Update Cycle
Validation is done in steps, with totals compared against independent signals like procedure growth, device shipment commentary, and public financial disclosures. We also review outputs for outliers by region and product group. If the model implies a sudden jump that is not supported by demand or pricing logic, we reopen the assumptions and re-contact the relevant experts.
Before sign-off, another analyst reviews the work to confirm that calculations, conversions, and definitions are consistent across the time series. Reports are refreshed annually, and interim updates are triggered when material events occur, such as major regulatory changes, sharp currency moves, or large shifts in procedure volumes. Right before delivery, we run a final pass to incorporate the latest public updates and learnings from interviews.
Mordor Intelligence's Surgical Equipment Market Sizing Compared With Other Published Estimates
Published market sizes for surgical equipment often vary even when they use similar wording, mainly because product scope and pricing logic are not identical. Differences also show up when one publisher uses older base-year pricing, or when regional coverage and currency conversion timing are not aligned.
The main gap comes from whether adjacent operating room categories, such as capital imaging, full robotics platforms, and broad OR infrastructure, are included in the total. Mordor Intelligence counts only the surgical equipment categories (handheld, powered and electrosurgical devices, and sutures and staplers) and keeps these adjacent items out of scope. Other gaps usually come from how procedure-driven demand is converted into value, including how fast ASPs are allowed to rise, whether mix shifts toward energy devices are modeled explicitly, and how often assumptions are rechecked with clinicians and procurement respondents.
Benchmark comparison
| Source | Market Size | Gaps in Research Methodology |
|---|---|---|
| Mordor Intelligence | USD 21.42 B (2026) | |
| Industry Research Publisher A | USD 20.02 B (2025) | Uses a different base year and does not clearly separate surgical equipment from adjacent categories in all regions, so pricing and mix assumptions can drift when compared year to year. |
| Industry Research Publisher B | USD 20.30 B (2025) | Highlights advanced technologies like robotics and imaging without a consistent rule on inclusion, which can inflate totals when capital platforms or broader operating room technologies get blended in. |
The table indicates that the spread is driven less by arithmetic differences and more by definition choices, plus how pricing and mix are carried forward. By keeping scope rules explicit and tying demand to procedure activity with purchasing checks, we arrive at a market value that is easier to reproduce and update when conditions change.
Key Questions Answered in the Report
What is the current size of the surgical equipment market?
The surgical equipment market size is USD 21.42 billion in 2026.
How fast is the market expected to grow?
Revenue is forecast to reach USD 31.62 billion by 2031, reflecting an 8.13% CAGR.
Which product category is expanding the fastest?
Powered and electrosurgical devices are projected to post an 8.45% CAGR through 2031.
Why are ambulatory surgical centers important for equipment suppliers?
ASCs perform 72% of U.S. surgeries and demand compact, quick-turnover instruments, driving a 8.97% CAGR in related equipment sales.
Which region offers the strongest growth outlook?
Asia-Pacific shows the highest regional CAGR at 8.69%, supported by infrastructure expansion and rising procedure volumes.
What restrains adoption of advanced robotic systems?
High capital outlays exceeding USD 2 million per unit and stringent regulatory hurdles limit uptake among smaller hospitals and ASCs.