
Global Surgical Booms Market Size and Share
Market Overview
| Study Period | 2020 - 2031 |
|---|---|
| Forecast Data Period | 2026 - 2031 |
| Market Size (2026) | USD 531.26 Million |
| Market Size (2031) | USD 665.97 Million |
| Growth Rate (2026 - 2031) | 4.62 % |
| Fastest Growing Market | Asia-Pacific |
| Largest Market | North America |
Major Players *Disclaimer: Major Players sorted in no particular order Image © Mordor Intelligence. Reuse requires attribution under CC BY 4.0. | |
Global Surgical Booms Market Analysis by Mordor Intelligence
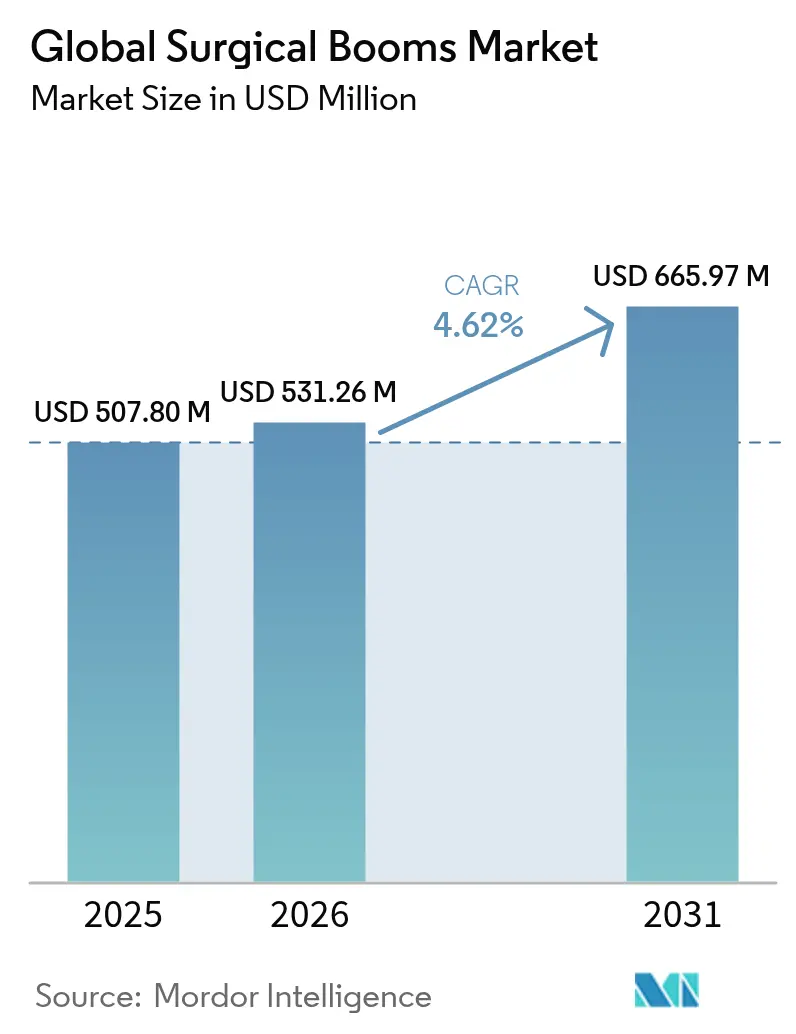
The Surgical Booms market size is expected to grow from USD 507.80 million in 2025 to USD 531.26 million in 2026 and is forecast to reach USD 665.97 million by 2031 at 4.62% CAGR over 2026-2031. Rising adoption of hybrid operating rooms, rapid growth of ambulatory surgery centers, and hospital decarbonization initiatives are together pulling capital toward ceiling-mounted infrastructure. At the same time, IoT-driven predictive-maintenance contracts are shifting service models from reactive repairs to proactive asset management, keeping surgical suites online longer and lowering lifetime ownership costs. Pent-up surgical demand after COVID-19, coupled with persistent clinician preference for minimally invasive procedures, ensures continuous utilization of advanced ceiling systems. Vendors now compete primarily on integration depth with imaging, robotics, and data platforms rather than on headline price, which underscores how technical differentiation is reshaping the Surgical Booms market.
Key Report Takeaways
- By product type, Equipment Booms led with 47.78% revenue of the Surgical Booms market share in 2025; Hybrid/Combination Booms are forecast to grow at 4.98% CAGR through 2031.
- By arm type, Single-Arm systems held 53.62% of the Surgical Booms market size in 2025, while Multi-Arm systems are expanding at a 5.67% CAGR through 2031.
- By power & rotation mechanism, Mechanical Brake units captured 58.91% revenue in 2025; Electric Motorized mechanisms post the fastest growth at a 5.86% CAGR to 2031.
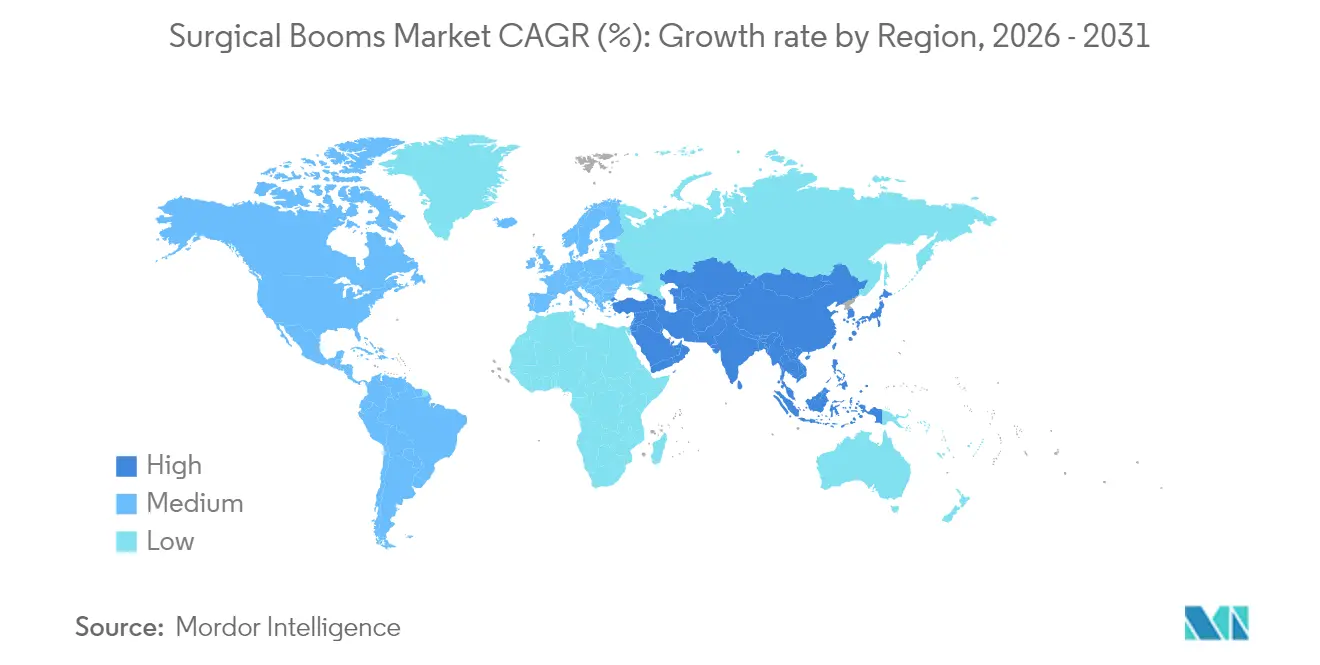
- By geography, North America accounted for 41.88% of the Surgical Booms market in 2025; Asia-Pacific is advancing the fastest at a 6.78% CAGR through 2031
Note: Market size and forecast figures in this report are generated using Mordor Intelligence’s proprietary estimation framework, updated with the latest available data and insights as of 2026.
Market Trends and Insights
Drivers Impact Analysis of Global Surgical Booms Market*
| Driver | (~) % Impact on CAGR Forecast | Geographic Relevance | Impact Timeline |
|---|---|---|---|
| Rapid hybrid-OR build-outs in tertiary hospitals | +1.2% | North America & EU, expanding to APAC | Medium term (2-4 years) |
| Ambulatory Surgery Center (ASC) proliferation in OECD nations | +0.8% | Global, concentrated in North America | Short term (≤ 2 years) |
| Rising adoption of integrated OR-IT & video routing platforms | +0.7% | Global, led by developed markets | Medium term (2-4 years) |
| Post-COVID backlog driving procedure-room expansion | +0.9% | Global, acute in North America & Europe | Short term (≤ 2 years) |
| IoT-enabled predictive-maintenance contracts for booms | +0.4% | APAC core, spill-over to North America | Long term (≥ 4 years) |
| Hospital decarbonization targets favouring modular ceiling utilities | +0.3% | EU & North America, emerging in APAC | Long term (≥ 4 years) |
| Source: Mordor Intelligence | |||
Rapid Hybrid-OR Build-outs in Tertiary Hospitals
Tertiary hospitals are accelerating hybrid suite construction to merge open surgery and advanced imaging. Vancouver General Hospital’s 2025 expansion added 15 rooms and upgraded a hybrid suite, lifting annual cases above 19,000. Virtua Health’s USD 500 million project introduces 10 rooms, two of which are hybrid, specifically supporting high-acuity cardiovascular and gastrointestinal interventions. These spaces need booms that can bear heavier payloads, route complex utilities, and integrate seamlessly with imaging and robotics, driving premium demand across the Surgical Booms market.
Ambulatory Surgery Center Proliferation in OECD Nations
The United States hosted 11,555 ASCs by mid-2024, representing a USD 43.1 billion setting with 2.88 rooms per center. Medicare beneficiaries treated at ASCs climbed to 3.4 million in 2023[1]Source: Medicare Payment Advisory Commission, “March 2025 Report,” medpac.gov . ASC owners prefer ceiling systems that shorten turnover, streamline visualization, and fit lower ceiling heights typical of outpatient builds, underpinning steady intake in the Surgical Booms market.
Post-COVID Backlog Driving Procedure-Room Expansion
Hospitals lost roughly 35% of surgical volume during early 2020, leaving an orthopedic backlog surpassing 1 million cases. Health Sciences Centre in Manitoba launched a USD 100 million program to raise surgical capacity by 25% via new rooms equipped with modern ceiling infrastructure cbc.ca. Clearing backlogs requires efficient, multipurpose rooms, reinforcing procurement momentum for the Surgical Booms market
Rising Adoption of Integrated OR-IT & Video Routing Platforms
Systems such as KARL STORZ OR1 NEO® centralize device control, imaging, and data management through overhead hubs. Sapporo Kashiwabakai Hospital’s SMART suite documented workflow gains once data routing, sterilization bridges, and boom positioning converged in a single ceiling grid Integration raises cabling, network, and structural demands, pushing hospitals to favor advanced booms and enlarging the Surgical Booms market.
Restraints Impact Analysis of Global Surgical Booms Market*
| Restraint | (~) % Impact on CAGR Forecast | Geographic Relevance | Impact Timeline |
|---|---|---|---|
| High retrofit cost for brown-field ORs | -0.6% | Global, acute in North America & Europe | Medium term (2-4 years) |
| Extended procurement cycles & facility-planner shortages | -0.4% | North America & EU, emerging in APAC | Short term (≤ 2 years) |
| Supply-chain bottlenecks in medical-gas connectors & bearings | -0.3% | Global, concentrated in North America & EU | Short term (≤ 2 years) |
| Limited reimbursement linkage for capital OR fixtures | -0.2% | North America & EU regulatory markets | Long term (≥ 4 years) |
| Source: Mordor Intelligence | |||
High Retrofit Cost for Brown-field ORs
Renovation consumes 35–55% of new-build budgets, with healthcare construction averaging USD 700-730 per sq ft. St. Francis Hospital’s cardiac unit upgrade cost USD 2.2 million and required temporary closures. Such expense discourages some mature facilities from installing new ceiling platforms, muting a portion of near-term demand inside the Surgical Booms market.
Extended Procurement Cycles & Facility-Planner Shortages
Seventy-one percent of hospitals cite distribution delays, while facility-planning teams operate under staffing gaps that drag out capital approvals. Cross-department coordination now spans HTM, IT, and building engineering, extending order-to-install timelines. These frictions shift revenue recognition outward for suppliers and shave growth points off the Surgical Booms market.
*Our forecasts treat driver/restraint impacts as directional, not additive. The impact forecasts reflect baseline growth, mix effects, and variable interactions.
Global Surgical Booms Market Segment Analysis
By Product Type:
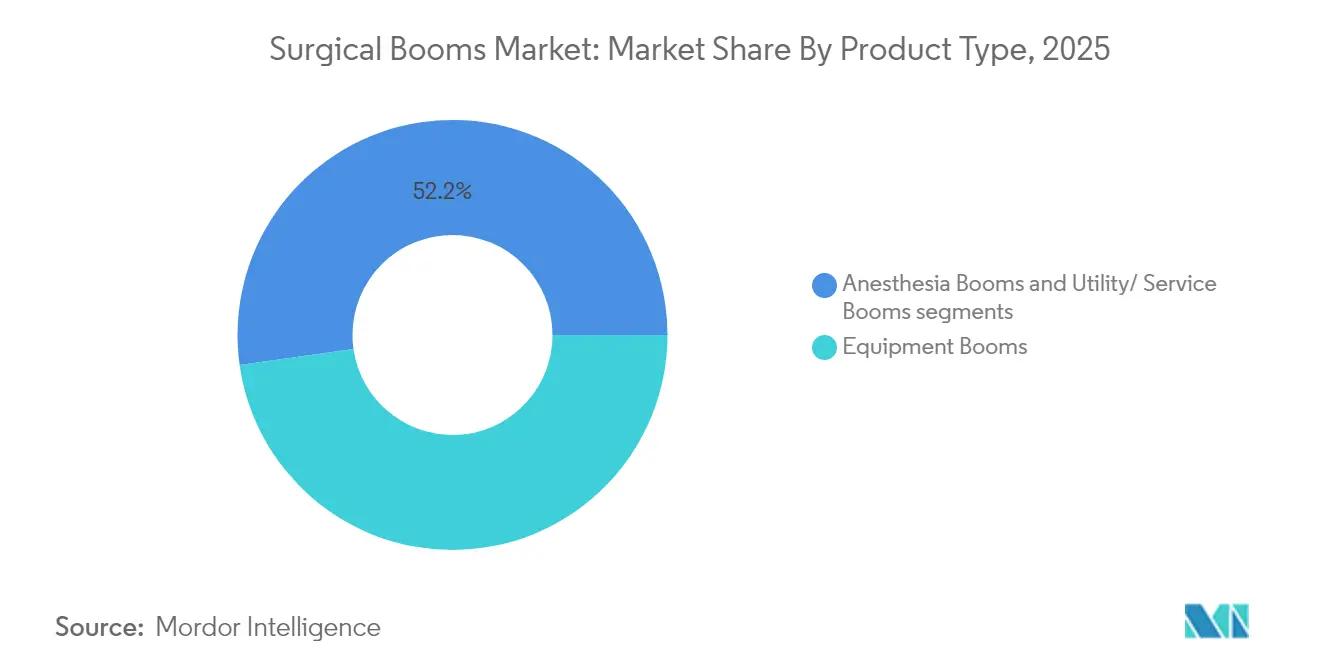
Equipment Dominance Drives IntegrationEquipment Booms retained 47.78% revenue in 2025 because they anchor anesthesia workstations, imaging displays, and surgical lights within compact footprints. Hybrid/Combination Booms, although smaller in base, exhibit a 4.98% CAGR thanks to rising universal-room strategies. Vancouver General Hospital’s build underscores how versatile booms allow any procedure in any room. CleanSuite by Steris illustrates the trend by delivering ISO Class 5 sterility with 40% cost savings and six-fold faster installs. Integration pressure keeps Equipment Booms central to the Surgical Booms market, while combination units promise the headroom for future tech additions.


By Arm Type:
Multi-Arm Systems Gain Workflow AdvantageSingle-Arm layouts captured 53.62% share in 2025 because they serve cost-sensitive facilities focusing on straightforward cases. Multi-Arm systems rise at 5.67% CAGR as complex minimally invasive procedures require concurrent imaging, suction, and robotics. St. Tammany Health System’s outpatient center runs Da Vinci and Mako robots from multi-arm platforms sttammany.health. This migration improves ergonomics, reduces floor clutter, and heightens room turnover, sustaining momentum in the Surgical Booms market size for the multi-arm class.
By Power & Rotation Mechanism:
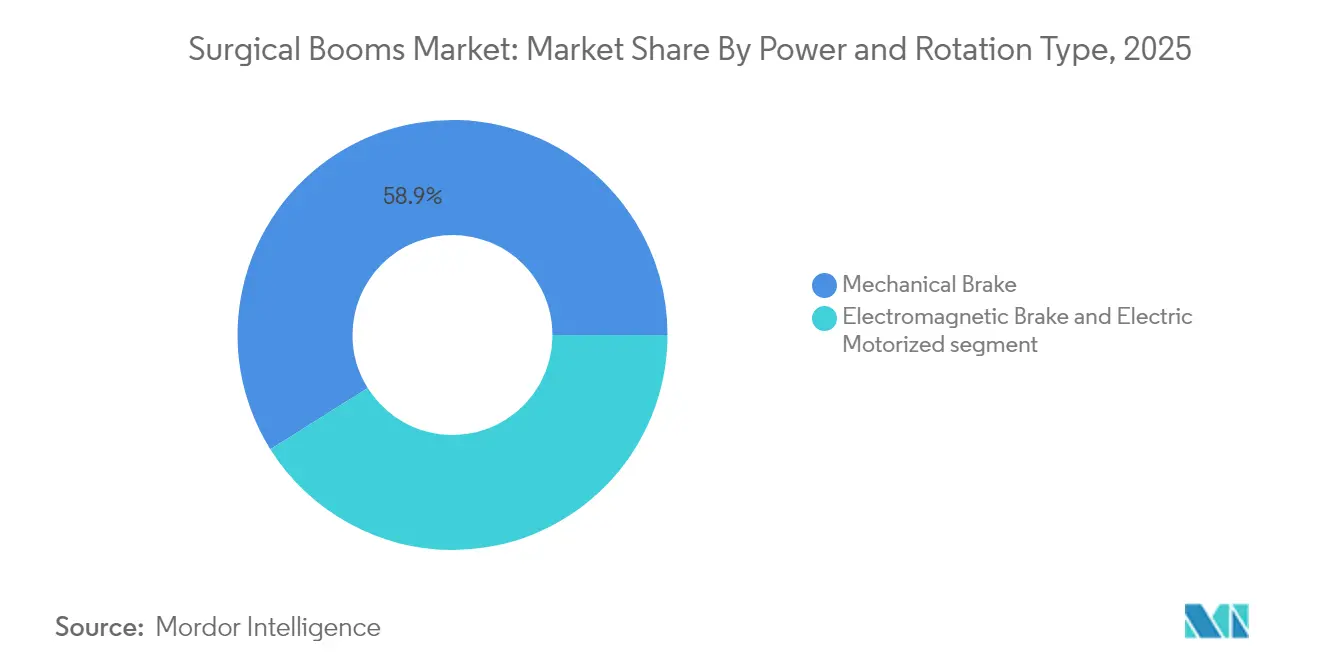
Electric Automation Transforms PrecisionMechanical Brake designs held 58.91% revenue in 2025; however, Electric Motorized variants track a 5.86% CAGR. BG Klinik’s Ciartic Move self-propelled C-arm highlights automation benefits by eliminating manual alignment. Electric units allow programmable presets, integrate IoT sensors, and maintain tighter infection-control protocols because staff touch fewer surfaces. As hospitals embed digital maintenance suites, Electric systems will claim greater revenue inside the Surgical Booms market.
Geography Analysis
North America Surgical Booms Market
North America generated 41.88% of 2025 revenues, buoyed by well-funded capital budgets and early adoption of surgical robotics. Reimbursement stability allows hospitals to replace ceiling equipment on predictable cycles, and updated building codes mandate higher availability rates—trends that collectively sustain purchasing activity in the Surgical Booms market.
Europe Surgical Booms Market
Europe shows mid-single-digit growth anchored by decarbonization directives. The EU’s focus on energy-efficient infrastructure compels facilities to specify modular ceiling utilities compatible with smart HVAC, which raises demand for next-generation booms. Ageing populations further elevate procedure volumes, lending resilience to European contributions within the Surgical Booms market.
APAC Surgical Booms Market
Asia-Pacific is advancing at 6.78% CAGR. China’s hospital construction outlays exceed USD 75 billion for 2020-2025, while India’s leading chains intend to add 17,800 beds via ₹14,600 crore programs. Getinge seeks to raise its Indian share from 30% to 45%, illustrating competitive heat. Multilateral funding from the Asian Infrastructure Investment Bank eases capital constraints for public builds, enlarging the addressable Surgical Booms market across emerging Asia.

Regulatory Landscape
Surgical booms are regulated as medical devices and must meet electrical safety, EMC, software, and usability requirements, alongside facility-level codes for medical gases, power, and structural ceiling loads. In the United States, the FDA regulates these systems under the medical device framework, and from February 2026, the Quality Management System Regulation (QMSR) took effect, updating 21 CFR Part 820 to align more directly with ISO 13485:2016 quality system expectations for manufacturers and their suppliers.
In Europe, compliance is centered on the EU Medical Device Regulation (MDR 2017/745), with 2026 adding additional compliance anchors. The European Commission adopted Implementing Regulation (EU) 2026/977 to set more uniform procedural requirements for notified body conformity assessments, and the EUDAMED UDI/Devices module became mandatory on 28 May 2026, increasing the documentation and registration burden for manufacturers placing booms and integrated ceiling systems on the EU market. Safety and performance expectations are also reinforced through standardization updates, including the 2026 citation of EN 60601-1 (edition 3.2) as an MDR-harmonised standard and the July 2026 publication of IEC 60601-1:2026 within the IEC 60601 medical electrical equipment series.
Competitive Landscape
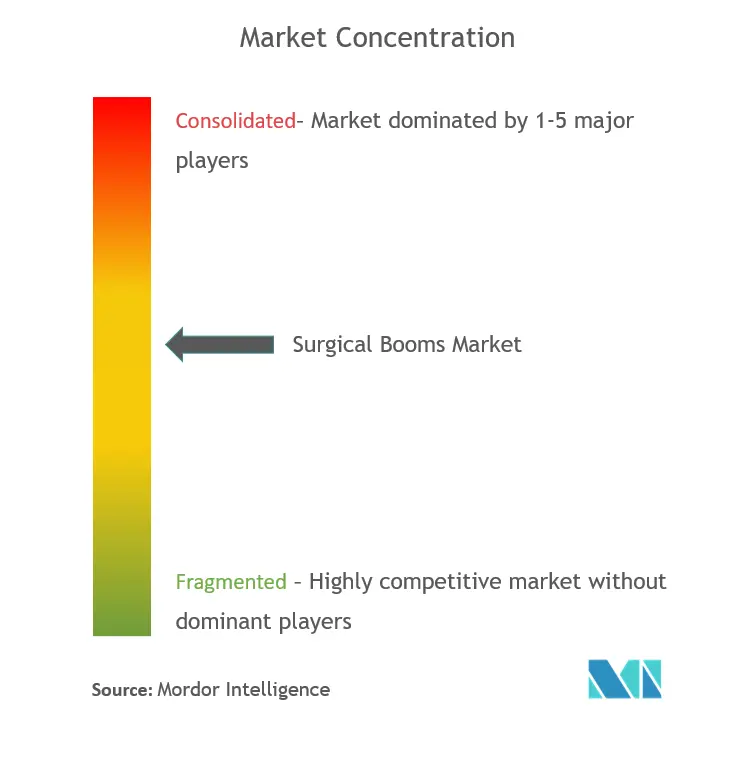
The Surgical Booms market is moderately consolidated. Stryker, Steris, Getinge, and Drägerwerk emphasize integration depth, cybersecurity, and lifecycle service bundles. Stryker’s USD 4.9 billion purchase of Inari Medical widens its vascular reach and potential boom attach-rate. Steris drives turnkey adoption via CleanSuite, cutting installation times dramatically and pitching ISO-Class sterility in one contract. Getinge’s U.S. Defense Health cybersecurity clearance secures access to large federal tenders.
Emerging players exploit regional procurement models and e-commerce. Mindray’s alliance with Amazon Business lowers transaction friction for mid-tier buyers. Baxter’s voice-activated Voalte Linq signals convergence between communication platforms and ceiling equipment, hinting at future function layers. As autonomous positioning, AI guidance, and predictive analytics proliferate, mechanical engineering alone will not preserve competitive edges, widening the innovation race in the Surgical Booms market.
Global Surgical Booms Industry Leaders
Hill-Rom Services, Inc.
Steris
Amico Group of Companies
Zimmer Biomet
Stryker
- *Disclaimer: Major Players sorted in no particular order
Global Surgical Booms Market Companies Covered in this Report
- Stryker
- Steris plc
- Skytron
- Getinge AB (Maquet)
- Dragerwerk
- Trumpf Medical
- Amico Corporation
- Ondal Medical Systems
- Hillrom (Baxter)
- Mindray
- Olympus
- Shenzhen Keling Medical
- Karl Storz
- Mediland Enterprise Corp.
- BeaconMedæs (Atlas Copco)
- Starkstrom
- Hipac Healthcare
- Sigma-Medical
- Fuji Booms
- Pronk Technologies

Market Opportunities and Future Outlook
White-space is opening as providers shift from buying standalone ceiling arms to specifying integrated, data-capable overhead infrastructure that supports robotics, imaging, and centralized device control. Evidence of this shift shows up in digital surgery roadmaps: in June 2026, Intuitive Surgical outlined how the da Vinci 5 platform leverages robotic kinematic data and force-feedback information to increase the practical value of OR connectivity, high-throughput data pathways, and standardized room layouts that reduce variation across sites.
Interoperability and infrastructure planning are also where opportunities concentrate as hospitals align power, medical gas, and network ports around case clusters rather than single-device installs. Buyer requirements increasingly link to compatibility with healthcare data and imaging standards (DICOM, HL7, and FHIR) and to in-room compute needs (edge computing/TinyML) for low-latency workflow and analytics, which favors boom platforms built as modular integration backbones rather than purely mechanical supports. This expands the addressable scope for vendors that bundle ceiling hardware with OR integration, cybersecurity-ready connectivity, and lifecycle service models that keep integrated rooms online.
Recent Industry Developments in Global Surgical Booms Market
- May 2026: The European Commission made the EUDAMED UDI/Devices module mandatory from 28 May 2026, requiring manufacturers to register device information in the EU database. This raises documentation and master-data readiness requirements for surgical boom suppliers and can affect how quickly new configurations are deployed across EU hospital and ASC sites.
- July 2025: Zimmer Biomet announced a strategic partnership with Getinge to distribute Getinge operating room capital products, including OR integration and lighting, to ambulatory surgery center customers under ZBX ASC Solutions. The partnership strengthens bundled ASC offerings and connects implant and procedure growth strategies with ceiling-mounted infrastructure purchasing decisions.
- February 2025: Stryker completed its USD 4.9 billion acquisition of Inari Medical, expanding its endovascular footprint. The broader procedural portfolio supports more comprehensive hospital and ASC solution selling, reinforcing a platform approach where ceiling-mounted infrastructure can be positioned alongside procedure-enabling technologies and service contracts.


Global Surgical Booms Market Report Scope and Research Methodology
Market Definition and Coverage
This market covers revenue generated from brand-new surgical booms used inside operating rooms, including ceiling or floor mounted arms that carry medical gases, power, data connectivity, monitors, and accessory shelves for clinical workflows.
Scope exclusions: Refurbished systems, basic wall pendants, and mobile carts are excluded because their pricing, replacement cycles, and use patterns do not match boom capital purchases.
Segments Covered in This Report
- By Product Type (Value)
- Equipment Booms
- Anesthesia Booms
- Utility / Service Booms
- Hybrid / Combination Booms
- By Arm Type (Value)
- Single-Arm
- Dual-Arm
- Multi-Arm
- By Power & Rotation Mechanism (Value)
- Mechanical Brake
- Electromagnetic Brake
- Electric Motorized
- By Geography (Value)
- North America
- United States
- Canada
- Mexico
- Europe
- Germany
- United Kingdom
- France
- Italy
- Spain
- Rest of Europe
- Asia-Pacific
- China
- India
- Japan
- South Korea
- Australia
- Rest of Asia-Pacific
- South America
- Brazil
- Argentina
- Rest of South America
- Middle East and Africa
- GCC
- South Africa
- Rest of Middle East and Africa
- North America
Data Sources, Market Sizing, and Validation
Desk Research
Desk research was used to build the first version of the demand map and to keep definitions aligned with how hospitals budget for operating room infrastructure. Public sources such as the World Health Organization, OECD health statistics, the World Bank, and national health agencies were used to sanity check surgery volumes, hospital capacity, and the overall direction of health spend.
We also reviewed regulatory and procurement signals that shape adoption. For device context, US FDA database records were used where relevant, and we cross-checked capital equipment purchasing behavior using national public tender portals (when accessible). To connect the market to supply-side reality, we studied company filings, investor presentations, product brochures, and credible trade press coverage of operating room upgrades. In a few places, paid subscriptions for company financials and news intelligence, as well as patent databases, were used to cross-check timelines and product positioning. The sources mentioned above are illustrative and not exhaustive, and additional public references were consulted for data collection, validation, and research clarification.
Primary Interviews and Surveys
Primary work focused on confirming what gets purchased with a boom system and how buying decisions are made across different facility types. We spoke with hospital engineering and OR planning teams, procurement stakeholders, distributors and service partners, and clinical users so gaps on typical configurations, replacement cycles, and installed base expansion could be closed. Since this is a global market, inputs were balanced across APAC, EMEA, and the Americas so pricing and uptake assumptions were not pushed by one geography.
Distribution of primary research fieldwork respondents
| Company type | Respondent position | Region |
|---|---|---|
| Top tier: 36% | CXOs: 14% | APAC: 45% |
| Mid tier: 49% | Functional/Unit leaders: 37% | EMEA: 30% |
| Smaller Players: 15% | Managers: 49% | Americas: 25% |
Market-Sizing & Forecasting
Sizing starts with a top-down build where procedure capacity, operating room additions, and renovation activity are translated into expected boom placements across hospitals and ambulatory surgery centers, which are then converted to value using typical system pricing. To keep the logic realistic, we used market fingerprints such as the share of surgeries shifting to outpatient settings, average number of ORs per facility type, replacement timing tied to major refurb cycles, and the mix of single-arm versus multi-arm installations that influences the average selling price.
Those totals were then checked with selective bottom-up approximations, mainly by using channel checks on shipment momentum, sampled price bands by configuration, and supplier-side commentary on backlog and replacement demand. Where direct data was thin, gaps were handled using bounded ranges for attachment rates (for example, add-on shelves, monitor mounts, and gas modules), followed by tightening those ranges using interview feedback and typical tender specifications.
For forecasting, scenario analysis was used so adoption can flex with hospital capital budgets, elective procedure normalization, and facility upgrade cycles across regions. The final forecast was kept consistent with primary feedback on what purchasers treat as non-discretionary versus deferrable in operating room modernization plans.
Data Validation & Update Cycle
Before numbers are finalized, outputs are triangulated against independent signals such as hospital construction trends, procedure growth direction, and procurement activity patterns, and then the model is reviewed for outliers that do not fit known buying cycles. When a region shows a sharp jump that cannot be explained by capacity or pricing inputs, we re-check assumptions, revisit the source trail, and re-contact relevant interviewees to confirm the change driver.
A second analyst review is done to confirm definitions, units, currency handling, and that the implied volume-to-value relationship is realistic. Reports are refreshed annually, with interim updates when material events occur, such as policy shifts that impact hospital capex or meaningful changes in surgery throughput. Right before publication, we run a final update pass so clients receive the latest view that stays consistent across sections and tables.
Mordor Intelligence's Surgical Booms Market Size Compared With Other Published Estimates
Published market sizes for surgical booms can differ even when they describe similar clinical settings, mainly because each publisher includes a different set of ceiling-mounted infrastructure and applies different timing for replacement demand. The year chosen for the headline number can also shift results because currency conversion timing, one-time hospital capex pauses, and average selling price updates do not always move in sync.
The main gap comes from whether refurbished booms, basic wall pendants, and mobile carts are bundled into the same total, and in Mordor Intelligence calculations only brand-new ceiling or floor mounted surgical booms installed in operating rooms and ambulatory surgery centers are counted so older asset resale and adjacent equipment categories do not dilute the pricing signal.
Benchmark comparison
| Source | Market Size | Gaps in Research Methodology |
|---|---|---|
| Mordor Intelligence | USD 531.26 M (2026) | |
| Global Consultancy A | USD 507.00 M (2026) | Keeps scope closer to core boom arms and applies a flatter price progression across configurations, which can reduce the modeled value even when facility activity is similar. |
| Trade Journal B | USD 388.90 M (2022) | Anchors sizing on a narrower set of hospital build and upgrade signals and does not fully adjust for outpatient OR expansion and replacement timing, which pulls the starting value lower. |
Overall, the spread is explained by scope inclusion, how configuration mix is priced, and how replacement cycles are translated into annual demand. By tying inputs to procedure capacity, renovation cadence, and realistic configuration patterns, the estimate remains traceable to a few repeatable steps and clear variables.


Key Questions Answered in the Report
What is the current Global Surgical Booms Market size?
The Global Surgical Booms Market size was USD 531.26 million in 2026 and is projected to register a CAGR of 4.62% during the forecast period (2026-2031)
Who are the key players in Global Surgical Booms Market?
Hill-Rom Services, Inc., Steris, Amico Group of Companies, Zimmer Biomet and Stryker are the major companies operating in the Global Surgical Booms Market.
Which is the fastest growing region in Global Surgical Booms Market?
Asia-Pacific is estimated to grow at the highest CAGR of 6.78% over the forecast period (2026-2031).
Which region has the biggest share in Global Surgical Booms Market?
In 2025, the North America accounts for the largest market share in Global Surgical Booms Market.
What years does this Global Surgical Booms Market cover?
The report covers the Global Surgical Booms Market historical market size for years: 2019, 2020, 2021, 2022, 2023 and 2024. The report also forecasts the Global Surgical Booms Market size for years: 2025, 2026, 2027, 2028, 2029 and 2030.
Page last updated on:


 Your data is secure and never sold or shared.


