
Surfing Equipment Market Size and Share
Market Overview
| Study Period | 2021 - 2031 |
|---|---|
| Market Size (2026) | USD 4.85 Billion |
| Market Size (2031) | USD 6.19 Billion |
| Growth Rate (2026 - 2031) | 4.99 % |
| Fastest Growing Market | Asia Pacific |
| Largest Market | North America |
| Market Concentration | Medium |
Major Players
*Disclaimer: Major Players sorted in no particular order Image © Mordor Intelligence. Reuse requires attribution under CC BY 4.0. |
|
Surfing Equipment Market Analysis by Mordor Intelligence
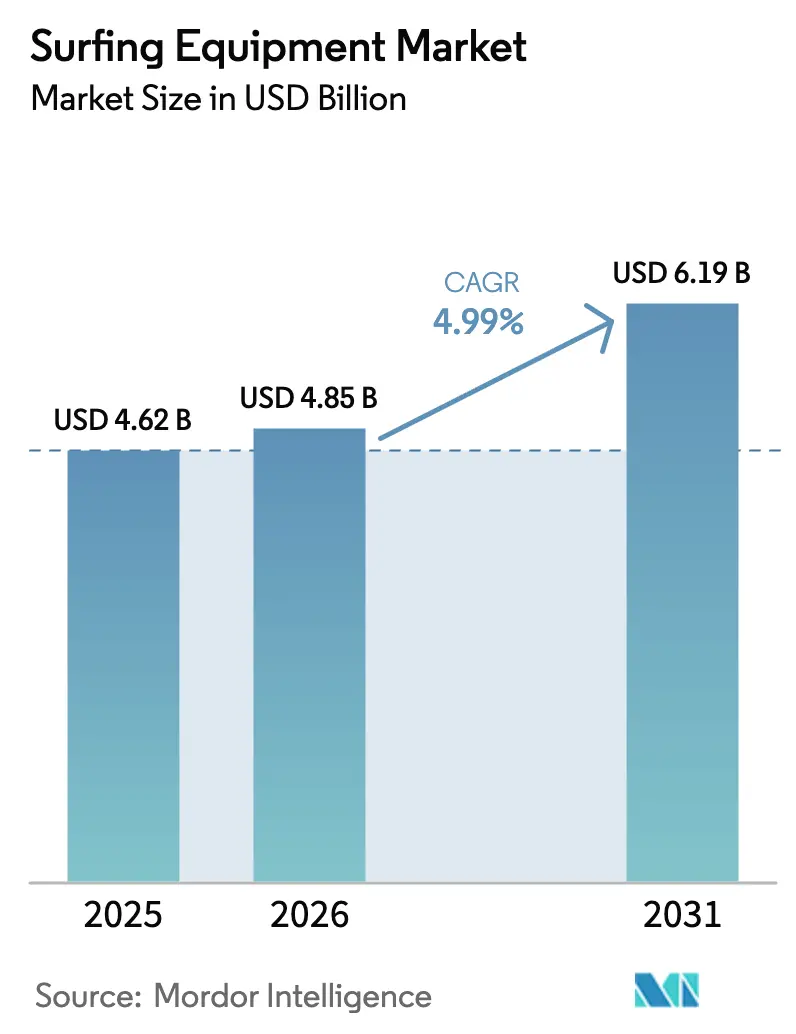
The surfing equipment market size is expected to grow from USD 4.62 billion in 2025 to USD 4.85 billion in 2026 and is forecast to reach USD 6.19 billion by 2031 at 4.99% CAGR over 2026-2031. This trajectory underscores the market's expansion beyond its traditional coastal confines. As product innovations emerge and environmental awareness heightens, consumer expectations are evolving. Notable advancements, such as carbon-composite constructions, sustainable rubber alternatives, and lighter board cores, have enhanced performance, leading to more frequent purchases. Additionally, a strong resurgence in coastal tourism in 2024 has fueled demand from both traveling surfers and lifestyle aficionados, many of whom now regard boards and apparel as symbols of status. Highlighting this trend, the European Travel Information and Authorization System (ETIAS) reported a significant surge in investments in Polish coastal destinations. Hotel transactions skyrocketed to over EUR 120 million in 2024, a substantial leap from EUR 45 million in 2023[1]Source: European Travel Information and Authorization System, "Poland Baltic Coast Draws in Global Travelers as Tourism Surges 30%", www.etias.com. While the premium segment, representing under one-fifth of unit sales, is on the rise, dedicated surfers are gravitating towards lighter, stronger, and more eco-friendly setups. The digital commerce boom further accelerates this growth, with online surf specialists and direct-to-consumer brands penetrating markets where traditional surf shops are scarce.
Key Report Takeaways
- By product type, surfboards dominated with 69.78% of the surfing equipment market share in 2025, while apparel is forecast to post a 5.45% CAGR through 2031.
- By end user, adults accounted for 71.88% of the surfing equipment market size in 2025; the children’s segment leads growth at a 5.36% CAGR to 2031.
- By category, mass-market items captured 79.35% revenue in 2025, whereas the premium tier is projected to rise at a 5.51% CAGR.
- By distribution channel, offline retail controlled 74.96% of the surfing equipment market size in 2025; online sales are advancing at a 5.82% CAGR.
- By geography, North America held 37.28% of revenue in 2025, while Asia-Pacific is on track for a 5.95% CAGR through 2031.
Note: Market size and forecast figures in this report are generated using Mordor Intelligence’s proprietary estimation framework, updated with the latest available data and insights as of 2026.
Market Trends and Insights
Drivers Impact Analysis of Surfing Equipment Market*
| Driver | (~) % Impact on CAGR Forecast | Geographic Relevance | Impact Timeline |
|---|---|---|---|
| Rising popularity of surfing as a sport and lifestyle | +0.8% | Global, with the strongest impact in North America and Europe | Medium term (2-4 years) |
| Technological advancements in surfboard materials and design | +0.7% | Global, led by Australia and California innovation hubs | Long term (≥ 4 years) |
| Expansion of surf schools and training programs | +0.6% | Asia-Pacific core, spill-over to South America | Short term (≤ 2 years) |
| Growth of coastal tourism and surf destinations | +0.5% | Global coastal regions, emerging markets, priority | Medium term (2-4 years) |
| Influence of social media and surfing Influencers | +0.4% | Global, with highest penetration in North America and Europe | Short term (≤ 2 years) |
| Increasing participation in competitive surfing events | +0.3% | Global, Olympic influence driving regional development | Long term (≥ 4 years) |
| Source: Mordor Intelligence | |||
Rising Popularity of Surfing as a Sport and Lifestyle
Surfing's inclusion in the Olympic program not only validated its competitive pathways but also broadened its media coverage. This elevation transformed surfboards and branded apparel into coveted lifestyle symbols, extending their allure far beyond the traditional surfer demographic. As the sport's popularity surges, local tournaments flourish, and amateur surfers flock to summer camps, driving up the demand for surfing equipment. For instance, the International Surfers Association reported in 2023 that there are approximately 23 million surfers worldwide. Brands have shifted their marketing focus, targeting urban fitness enthusiasts who now see surfing as a desirable addition to their gym and running club routines. This shift is evident in the rising demand for premium boards, as newcomers prioritize gear that marries performance with aesthetic appeal. Furthermore, lifestyle content on social media amplifies this trend, with surf influencers gaining global traction, seamlessly translating cultural exposure into heightened product demand.
Technological advancements in surfboard materials and design
Surfing gear is transforming, thanks to material innovations that boost performance, durability, and sustainability. Innovations like carbon-fiber masts, titanium core fuselages, and recyclable bio-resins are not only cutting weight by 15-20% but also enhancing flex precision and strength. Take, for example, Armstrong Foils’ Quad C-Beam carbon composite masts. They allow for the creation of thinner, faster foils that don't skimp on durability, catering to riders who navigate diverse wave conditions. Furthermore, advancements in digital shaping and CAD technologies are making semi-custom boards more affordable, democratizing access to high-end gear. Wetsuit manufacturers are now turning to eco-friendly materials, such as natural rubber and limestone neoprene, striking a balance between warmth, flexibility, and a reduced environmental impact. Fin designs are now leveraging carbon fiber and honeycomb structures, enhancing maneuverability. With sustainable practices like using recycled cores and biobased resins, the industry is resonating with surfers' eco-conscious values. This not only makes advanced, eco-friendly equipment more accessible but also propels the sport into a greener future.
Expansion of surf schools and training programs
Professional instruction reduces the intimidation barrier for children, women, and older adults, encouraging them to take up surfing while promoting systematic upgrades from soft-top beginner boards to shorter composite boards as their skills improve. Surfing schools, both seasonal and summer-focused, are expanding rapidly to address the growing demand for surfing. For instance, in September 2024, Woolworths SurfGroms Season Schools launched their seasonal programs, offering training for both amateur surfers and professional participants. Additionally, on Australia’s South Coast, schools like Pines Surfing Academy provide comprehensive packages that include equipment rentals, lessons, and progression clinics. This integrated approach not only ensures consistent equipment turnover, benefiting board manufacturers, but also offers brands an opportunity to test new materials in real-world conditions, enabling faster and more effective feedback loops.
Growth of coastal tourism and surf destinations
Post-pandemic, governments have significantly increased investments in surf breaks, enhanced beach access, and established rental shops, which have collectively driven recurring hardware sales. France has emerged as a key destination, attracting a substantial number of tourists to its coastal cities, where adventurous surfing activities are gaining popularity and fueling market growth. As reported by CAMPUS FRANCE, approximately 100 million tourists visited France in 2024, underscoring its prominence as a global tourism hub[2]Source: CAMPUS FRANCE, "2024, A Record Year For International Tourism in France"www.campusfrance.org. Furthermore, emerging destinations in Southeast Asia and Central America are actively promoting surf culture as a distinctive alternative to traditional beach vacations. This strategic focus has spurred demand for travel-friendly surfboards and compact, packable wetsuits, catering to the preferences of adventure-oriented travelers.
Restraints Impact Analysis of Surfing Equipment Market*
| Restraint | (~) % Impact on CAGR Forecast | Geographic Relevance | Impact Timeline |
|---|---|---|---|
| Limited number of surfing facilities and low participation rates in certain regions | -0.9% | Inland regions globally, emerging markets with limited coastal access | Long term (≥ 4 years) |
| Decline in water bodies and natural resources | -0.6% | Global, with acute impact in drought-affected regions | Long term (≥ 4 years) |
| High cost of surfing equipment | -0.4% | Emerging markets, price-sensitive consumer segments | Medium term (2-4 years) |
| Seasonal and weather dependency | -0.3% | Temperate regions, markets with distinct seasonal patterns | Short term (≤ 2 years) |
| Source: Mordor Intelligence | |||
Limited number of surfing facilities and low participation Rates
Although online interest in surfing continues to rise, a significant portion of the global population resides far from surfable coastlines, limiting direct participation in the sport. Artificial wave parks have emerged as a potential solution; however, their high capital requirements and operational complexities confine their development to premium resorts and affluent urban areas. This exclusivity restricts accessibility for broader demographics. In developing nations, government spending is often directed toward critical infrastructure projects, leaving limited resources for investments in costly wave pools. As a result, the growth of local demand for surfing equipment, such as surfboards and wetsuits, remains constrained. These factors collectively hinder the widespread adoption of surfing, despite its growing popularity in digital and social media spaces.
High cost of surfing equipment
High entry fees and expensive equipment pose significant barriers for aspiring surfers, particularly in lower-income markets. According to an article published in April 2024 in Surf Expedition, the cost of surfboards starts at approximately USD 150, while premium foam surfboards range between USD 600 and USD 800, making surfing an expensive sport. Although direct-to-consumer brands and the use of alternative materials aim to reduce costs, substantial price reductions depend on scaling bio-resins and recycled foams, which currently involve high production costs. These elevated prices discourage occasional or one-time surfers from purchasing new surfboards. Instead, they often prefer renting existing surfboards as a more economical option. The high costs associated with surfing equipment continue to limit accessibility, particularly for those with budget constraints.
*Our forecasts treat driver/restraint impacts as directional, not additive. The impact forecasts reflect baseline growth, mix effects, and variable interactions.
Surfing Equipment Market Segment Analysis
By Product Type:
Boards maintain dominance despite apparel accelerationIn 2025, the board segment dominated the surfing equipment market, accounting for 69.78% of total revenue. This dominance is attributed to shorter replacement cycles, the trend of maintaining multiple boards for different breaks, and ongoing material upgrades that sustain demand. Highlighting the market's nuances, North Foils unveiled its 2025 range in July 2024, featuring wing, prone, and kite foils. This move underscores the growing demand for specialized boards in sub-disciplines, as consumers increasingly seek equipment tailored to specific surfing styles and conditions. Furthermore, the industry's pivot towards lighter carbon constructions has driven up average selling prices, allowing the board segment to maintain its share even as other categories broaden. The combination of innovation and adaptability ensures the board segment remains a cornerstone of the surfing equipment market.
Apparel is projected to grow at a 5.45% CAGR through 2031, paralleling surfing's evolution into mainstream streetwear. Items like branded rash guards, UV tops, and lifestyle tees resonate with both dedicated surfers and casual beachgoers, emphasizing a coastal lifestyle. These products not only cater to functional needs, such as UV protection and comfort, but also serve as a medium for self-expression and identity. Although the unit economics of apparel diverge from hard goods, brands find apparel margins appealing, blending fashion trends with technical functionality. Consequently, the surfing equipment market witnesses a harmonious interplay between boards and apparel, with the prestige of hard goods enhancing the brand equity of soft goods. This synergy allows brands to expand their consumer base while reinforcing their market presence across multiple product categories.


By End user:
Adult segment stability contrasts children’s growth potentialIn 2025, adults accounted for 71.88% of sales in the surfing equipment market, underscoring their consistent purchasing power and driving technical demands that fuel Research and Development. Experienced riders, often owning multiple boards tailored to varying wave conditions, further bolster repeat purchases. These riders prioritize performance and durability, leading to a preference for premium materials that enhance their surfing experience. This demand for high-quality products significantly contributes to the segment's elevated average selling price, making adults a key demographic in the market.
Children's gear, witnessing a 5.36% CAGR, underscores surf camps and national federations' success in engaging the youth. Parents, viewing surfing as a blend of fitness and ocean literacy, frequently upgrade gear to match their children's growth. Highlighting this trend, the National Federation of State High School Associations (NFHS) noted a rise in high school surfing participation, jumping from 1,428 students in 2023 to 1,588 in 2024. This increase reflects growing interest and accessibility for younger demographics. Furthermore, rental programs serve as gateways, introducing young surfers to the market. These programs allow children to build confidence and skills before transitioning to ownership, fostering a deeper connection to the sport and paving the way for lifelong loyalty to the surfing equipment industry.
By Category:
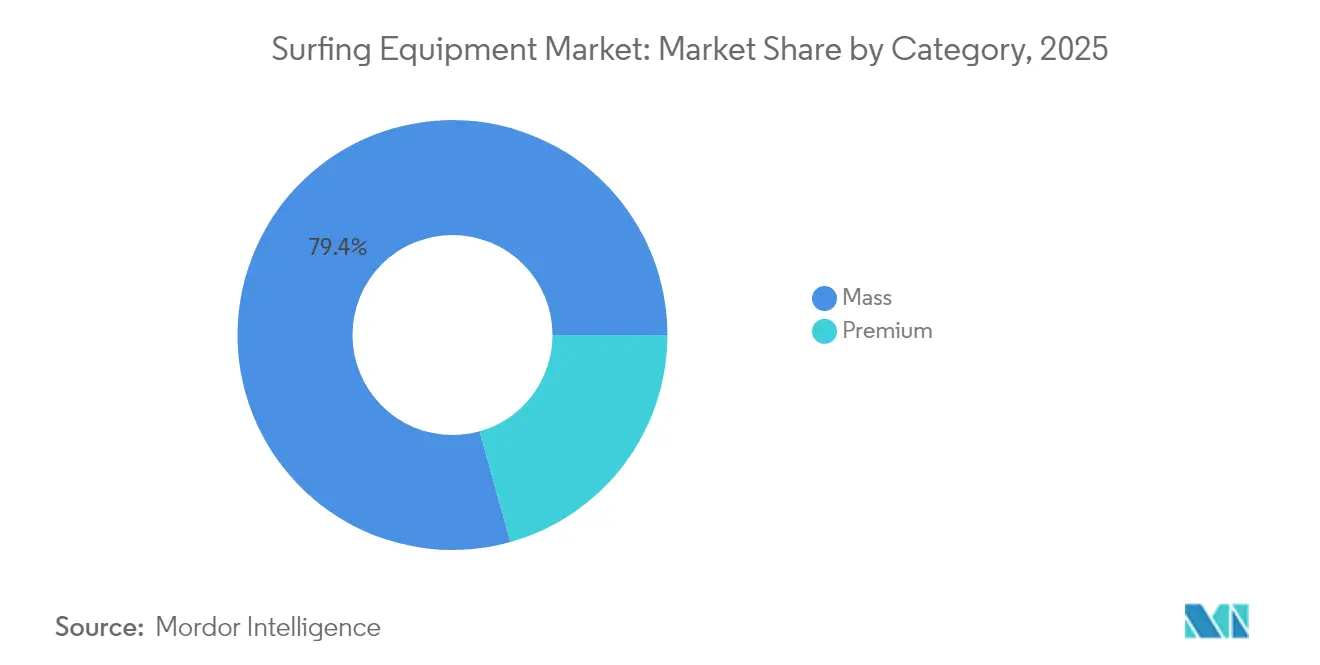
Premium segment momentum challenges mass-market dominanceIn 2025, mass-market offerings accounted for a dominant 79.35% of total revenue, driven by their strong foothold in entry-level and casual use cases. Asian production hubs, leveraging economies of scale, manage to keep prices affordable without compromising on quality. These hubs enable manufacturers to produce large volumes efficiently, ensuring a consistent supply to meet global demand. Yet, there's a subtle shift: as online platforms spotlight premium gear, the mass market's share is witnessing a gradual decline, with consumers increasingly exploring higher-end alternatives.
Premium products, on the other hand, are set to grow at a robust 5.51% rate. This growth is largely attributed to innovations like carbon fiber, flax-based laminates, and bio-rubber wetsuits, all of which boast distinct performance or sustainability benefits. These materials not only enhance durability and functionality but also align with the growing consumer preference for eco-friendly products. With increasing environmental awareness, surfers are beginning to associate higher price tags with a smaller ecological footprint, further propelling the premium segment of the surfing equipment market. Additionally, targeted marketing campaigns and endorsements by professional surfers are amplifying the appeal of premium offerings, driving their adoption among enthusiasts and professionals alike.
By Distribution channel:
Digital transformation accelerates despite offline dominanceIn 2025, offline surf shops dominated the market, accounting for 74.96% of total sales. This dominance underscores the importance of hands-on board selection and the critical need for in-person wetsuit fittings. Customers often prefer the tactile experience of evaluating boards and ensuring proper wetsuit sizing, which online platforms cannot fully replicate. Beyond sales, these shops serve as vibrant community centers, hosting events like movie nights, local contests, and demo days. These activities not only foster a sense of community but also strengthen customer loyalty and engagement, making offline stores an integral part of the surfing ecosystem.
Meanwhile, online platforms are poised for growth, anticipating a 5.82% CAGR. Innovations like 360-degree board viewers, augmented-reality fittings for wetsuits, and direct-to-consumer board builders offering worldwide vacuum-sealed kit shipments are driving this surge. These advancements provide convenience and customization options that appeal to tech-savvy surfers. Additionally, the swift rise of click-to-collect services melds the strengths of both online and offline channels, empowering surfers to conduct online research before making in-store pickups. This hybrid approach addresses the need for convenience while retaining the benefits of in-person interactions.
Geography Analysis
North America Surfing Equipment Market
In 2025, North America accounted for 37.28% of global revenue, driven by a long-standing surf culture, premier surf breaks, and affluent coastal residents willing to invest in premium lighter composites and plant-based foam wetsuits. California and Hawaii's consistent year-round swells stabilize sales, bolstered by media spotlight on the World Surf League, which keeps the sport in the public eye and attracts new participants. Established infrastructure allows specialty retailers to provide board repairs, rentals, and demo fleets, reinforcing the demand for replacements and ensuring customer loyalty. As surfing gains popularity, equipment demand surges. For instance, the Sports and Fitness Industry Association reported a rise in surfers from 3.99 million in 2023 to 4.23 million in 2024, highlighting the growing interest in the sport.
Europe Surfing Equipment Market
Europe melds historic surf hubs in France, Portugal, and Spain with colder markets like the UK and Scandinavia, which lean on wetsuit advancements to cater to their specific needs. French tourism rebounded to 100 million arrivals in 2024, boosting board and suit rentals along the Atlantic and giving a lift to the surfing equipment market. This increase in tourism not only supports local surf shops but also encourages the adoption of surfing as a recreational activity among visitors. Moreover, European policies promoting greener materials amplify the demand for bio-based wetsuits and recycled board cores, aligning with the region's sustainability goals and consumer preferences for eco-friendly products.
APAC Surfing Equipment Market
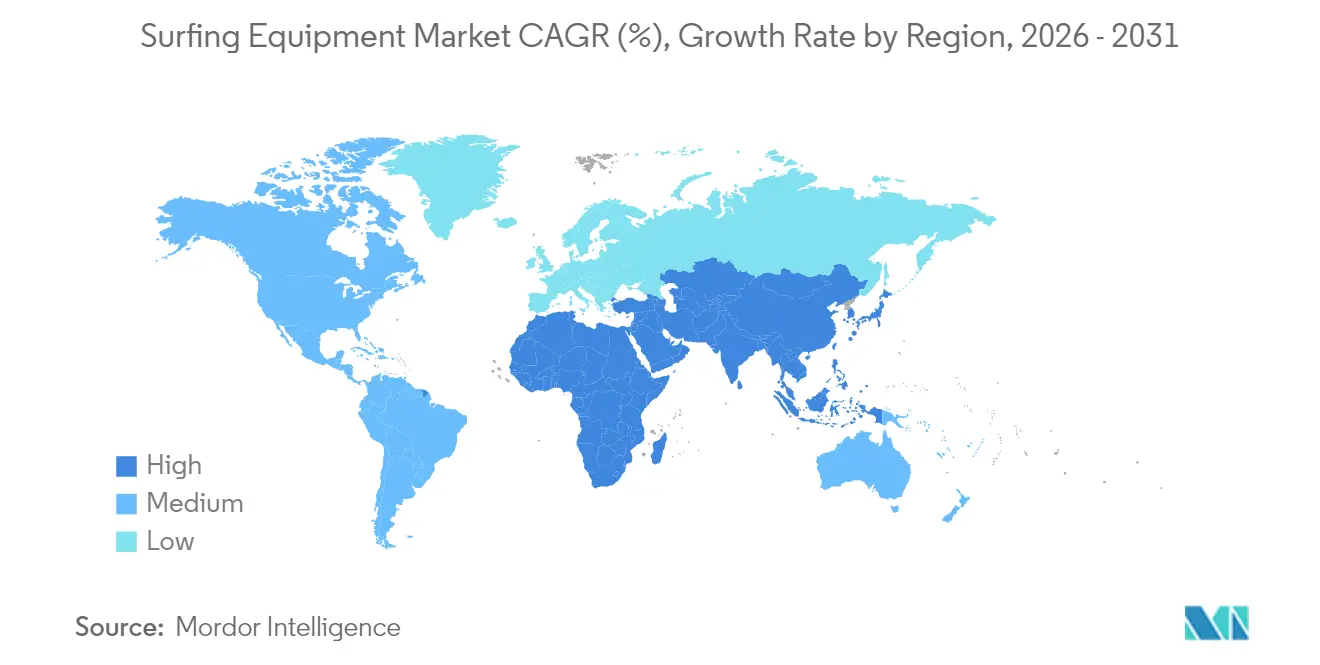
Asia-Pacific is on the rise, projecting a 5.95% CAGR through 2031. Countries like Indonesia, the Philippines, and Thailand are actively marketing their beaches to regional tourists, leveraging their natural resources to attract both beginners and experienced surfers. Government-sponsored surf festivals and clinics led by influencers are boosting domestic participation, nurturing local board-building startups, and creating a supportive ecosystem for the surfing industry. Although current market penetration lags behind America and Europe, the region's vast demographic potential, coupled with increasing disposable incomes and growing interest in outdoor activities, positions it as a burgeoning hub for future surfing equipment customers.
Note: Segment shares of all individual segments will be available upon report purchase

Regulatory Landscape
Sustainability and supply-chain disclosure requirements are becoming more consequential for surfing equipment brands that sell into large consumer markets. In the United States, California SB 253 introduces climate reporting obligations for large companies doing business in the state, with Scope 1 and 2 reporting starting in 2026 and Scope 3 following in 2027. This timeline is pushing brands and licensees to formalize upstream data collection across boards, wetsuits, and apparel supply chains. In Europe, the EU Corporate Sustainability Reporting Directive (CSRD) is phasing in across qualifying large companies, with growing emphasis on auditable environmental and social disclosures tied to materials, manufacturing, and logistics.
Compliance in surf manufacturing and sourcing is also shaped by third-party social audit and certification ecosystems that are used across production hubs, rather than surf-specific regulation. Programs such as Amfori BSCI, Fair Labor Association (FLA), and WRAP are commonly referenced for social compliance. At the product level, surfboard sustainability initiatives such as Sustainable Surf's ECOBOARD Project provide program guidelines that brands use to substantiate lower-impact materials and processes. Brand-level commitments, such as the Beaumanoir Group (owner of Boardriders) commitment to the Science Based Targets initiative (SBTi) cited in its 2025 reporting, further reinforce the shift toward measurable targets and verifiable supplier practices.
Competitive Landscape
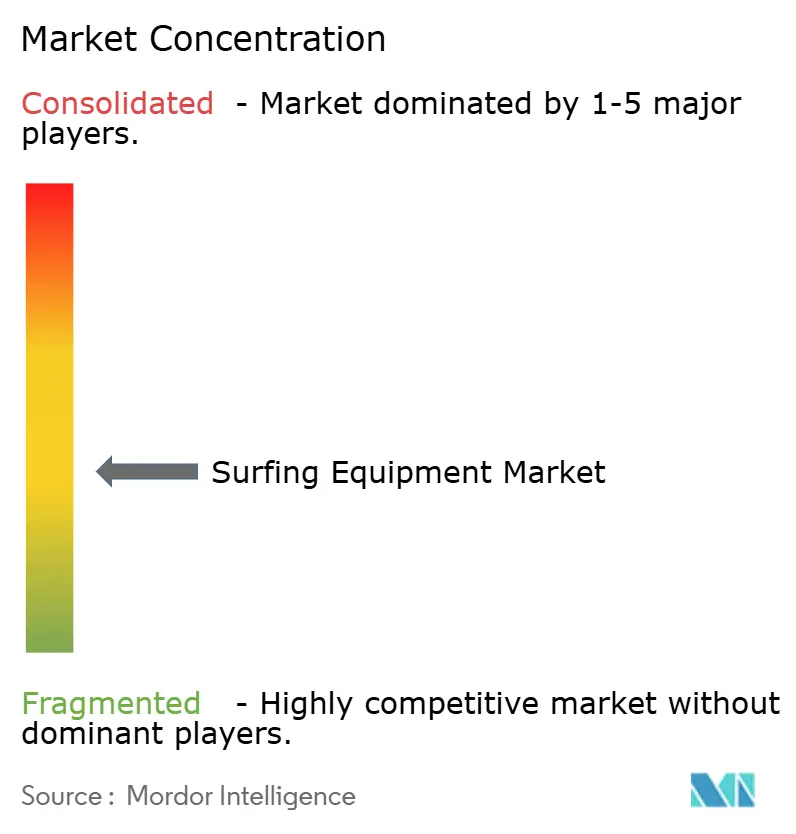
Moderate fragmentation in the market suggests opportunities for differentiation. Global brands, including Boardriders (encompassing Quiksilver, Billabong, and Roxy), Rip Curl, and O’Neill, blend scale with lifestyle appeal, securing prime shelf space globally. Their diverse product range spans hard goods, apparel, and accessories, ensuring prominent visibility at both travel hotspots and urban retail outlets.
Specialists, driven by innovation, carve out market shares through technical prowess. For instance, Armstrong Foils’ titanium core foils cater to advanced riders, emphasizing weight-to-stiffness ratios. On another front, Yulex champions sustainability, offering natural-rubber alternatives now favored by numerous wetsuit brands over traditional petroleum-based neoprene. Such strategies resonate with eco-conscious consumers, enabling smaller firms to stand out without directly competing on volume.
Digital direct-to-consumer approaches are reshaping traditional distribution. Firewire Surfboards, for instance, offers online configurators, allowing customers to customize outlines, fin setups, and artwork, with factory-fresh boards shipped within weeks. This strategy sidesteps retail markups, supports ongoing Research and Development, and gathers detailed rider data for design enhancements. Concurrently, traditional surf shops are transitioning into service hubs, focusing on repairs and local expertise, fostering a symbiotic relationship between the old and new channels.
Surfing Equipment Industry Leaders
-
Nike, Inc.
-
Firewire Surfboards, LLC
-
Authentic Brands Group
-
Channel Islands Surfboards Inc
-
Rip Curl Group Pty Ltd
- *Disclaimer: Major Players sorted in no particular order
Surfing Equipment Market Companies Covered in this Report
- Authentic Brands Group
- Rip Curl Group Pty Ltd
- Nike Inc
- Channel Islands Surfboards Inc
- Firewire Surfboards, LLC
- VF Corporation
- O’Neill
- Patagonia, Inc.
- Decathlon SA
- Global Surf Industries(GSI)
- Vegas Enterprises Pty Ltd
- Lost Enterprises
- NSP International
- JS Industries
- Haydenshapes Surfboards
- Catch Surf
- Lightning Bolt Surf Company
- Wedge Brands LLC
- Fin Control Systems Pty Ltd
- Marquee Brands LLC

Market Opportunities and Future Outlook
Verifiable sustainability and upstream transparency are emerging as a clear opportunity as reporting frameworks and consumer scrutiny increase the demand for documented materials and manufacturing practices. Companies that invest in traceable inputs and lower-impact processes can differentiate across both hard goods and soft goods, including bio-resin systems, waste-reduction initiatives, and third-party verified materials (for example, USDA-certified bio-based foams and GOTS-certified textiles referenced in industry discussions). Firewire Surfboards has aligned its premium board strategy with proprietary bio-based resin systems and waste-reduction work (including initiatives related to EPS waste), which fits the proof requirements that retailers and regulators are increasingly emphasizing.
Separately, brand re-entry and portfolio repositioning are creating whitespace in performance-to-lifestyle crossovers and in digitally enabled go-to-market models. Nike's 2025 return to surfing through athlete sponsorship activity has raised competitive intensity in surf-inspired apparel, while also increasing the value of athlete-led product stories tied to major event cycles. Direct-to-consumer and online configurator models, already visible through specialist brands such as Firewire, support customization and faster feedback loops on design, and they widen geographic reach where specialty surf retail is limited, particularly as premiumization continues alongside mass-market volume.
Recent Industry Developments in Surfing Equipment Market
- April 2026: Firewire Surfboards LLC released the DRK surfboard model, designed by Dan Mann and featuring I-Bolic 2.0 Technology. The launch targets the premium board segment and expands Firewire's footprint among performance-oriented riders. The release reinforces Firewire's innovation leadership and premium positioning within the market.
- February 2026: Firewire Surfboards LLC released the Mindcraft surfboard model, a collaboration between Kelly Slater and Daniel Thomson. This introduces a new high-performance model tied to a well-known design partnership. The collaboration supports Firewire's authority in tech-enabled boards and strengthens direct-to-consumer differentiation.
- February 2026: Nike Inc. unveiled the Nike Surf Symphony Kit at the 2026 Australian Open. This connects high-visibility branding to surfing culture during a major event. The re-entry into the surfing ecosystem is intended to capture youth audiences and align with lifestyle and apparel demand.


Surfing Equipment Market Report Scope and Research Methodology
Market Definition and Coverage
For this study, the surfing equipment market is defined as the value of products bought for wave riding and related participation. This includes surfboards and commonly purchased surf wear and accessories sold through online and offline channels across major regions.
Scope exclusions: We exclude second-hand peer-to-peer transactions, rentals, and non-surf water sports gear that is not purchased primarily for surfing.
Segments Covered in This Report
-
By Product Type
- Surfing Boards
- Apparel
- Footwear
- Protective Guards and Accessories
-
By End User
- Adult
- Kids/Children
-
By Category
- Mass
- Premium
-
By Distribution Channel
- Offline Retail Stores
- Online Retail Stores
-
By Geography
-
North America
- United States
- Canada
- Mexico
- Rest of North America
-
Europe
- Germany
- United Kingdom
- Italy
- France
- Spain
- Netherlands
- Poland
- Belgium
- Sweden
- Rest of Europe
-
Asia-Pacific
- China
- India
- Japan
- Australia
- Indonesia
- South Korea
- Thailand
- Singapore
- Rest of Asia-Pacific
-
South America
- Brazil
- Argentina
- Colombia
- Chile
- Peru
- Rest of South America
- Middle East and Africa
-
North America
Data Sources, Market Sizing, and Validation
Desk Research
Desk research was used to map the demand pool and to anchor assumptions that are difficult to observe from company disclosures alone. We reviewed participation and travel indicators, trade flows, and consumer-spending context from public sources such as the International Surfing Association, the Outdoor Industry Association, the World Tourism Organization, and relevant national statistics agencies.
We also referenced company annual reports, investor presentations, and product catalogs to understand price ladders, replacement cycles, and channel mix shifts. For cross-checks, paid subscriptions for company financials and for shipment-level import and export records were used selectively to sanity check growth direction and supplier exposure. The sources listed here are illustrative, and many other public documents and datasets were used to clarify, validate, and complete the analysis.
Primary Interviews and Surveys
Primary work focused on validating what gets bought most often, how average selling prices move by region, and how online versus specialty retail splits are evolving. We spoke with manufacturers, distributors, specialty retailers, surf schools, and material suppliers, then used follow-up checks to confirm assumptions that showed high sensitivity in the model across APAC, EMEA, and the Americas.
Distribution of primary research fieldwork respondents
| Company type | Respondent position | Region |
|---|---|---|
| Top tier: 25% | CXOs: 15% | APAC: 49% |
| Mid tier: 56% | Functional/Unit leaders: 34% | EMEA: 29% |
| Smaller Players: 19% | Managers: 51% | Americas: 22% |
Market-Sizing & Forecasting
The core sizing is built using a top-down approach, where participation and travel-related surf activity are translated into an addressable buying base, then converted into annual demand using replacement cycles and typical spend per surfer. To keep totals realistic, we corroborated the outcome with selective bottom-up checks such as sampled ASP times estimated unit volumes for key product groups, plus channel checks from retailers and distributors.
A few inputs mattered most: estimated surfer participation and frequency, board replacement timing, wetsuit and accessory attachment rates, online versus offline share by region, and price dispersion between mass and premium products. When direct data points were missing for smaller countries, gaps were handled through proxy ratios from similar surf destinations, then reviewed again during expert callbacks.
For forecasting, scenario analysis was applied and then normalized using short time-series smoothing on the main drivers, so one-off tourism spikes did not overstate the mid-term path. Assumptions were adjusted only after primary feedback showed consistent direction across regions and customer cohorts.
Data Validation & Update Cycle
Outputs were checked against independent signals such as surf participation indicators, broader sporting-goods spending direction, and visible pricing changes on retail shelves. If a country or region showed a jump that could not be explained by the driver set, it was flagged, reviewed, and reworked before internal sign-off.
Reports are refreshed annually, and interim updates are completed when material events change pricing, availability, or demand patterns. Before delivery, an analyst performs a fresh pass on key inputs and recent news so the final dataset reflects the latest market conditions.
Mordor Intelligence's Surfing Equipment Market Estimate Compared With Other Published Estimates
Published values for surfing equipment do not always match because the scope is often drawn differently, and because the same demand drivers can be converted into revenue using different price and replacement assumptions. Differences also come from the base year chosen, how currencies are converted, and how frequently the model is refreshed.
Some estimates fold in adjacent beach lifestyle categories or treat rentals as part of sales, which can lift totals even if participation does not change much. Other estimates lean heavily on trade data, which can miss locally made boards and can blur the split between surf-specific and general water sports products. In those cases, the ASP path is sometimes applied as a flat uplift. In contrast, the split is kept tighter for Mordor Intelligence, where revenue is counted only for surf-specific equipment sales across the defined channels and regions, with price steps and replacement timing re-checked through expert callbacks.
Benchmark comparison
| Source | Market Size | Gaps in Research Methodology |
|---|---|---|
| Mordor Intelligence | USD 4.85 B (2026) | |
| Industry Journal A | USD 5.27 B (2024) | Uses a broader lifestyle-led scope that can include non-surf beach products, and applies a faster ASP uplift without re-validating replacement behavior by region. |
| Regional Consultancy B | USD 4.10 B (2024) | Narrower coverage that emphasizes traded goods and formal retail, which can undercount locally produced boards and specialty-shop sales in key surf destinations. |
Taken together, the spread is explained mostly by scope and by how demand signals are converted into priced volumes. Our approach stays traceable to participation, replacement, channel mix, and region-level price steps, which makes the final number easier to replicate and stress test.


Key Questions Answered in the Report
What is the current Surfing Equipment Market size?
The surfing equipment market was valued at USD 4.85 billion in 2026 and is forecast to reach USD 6.19 billion by 2031.
Which product type generates the most revenue?
Surfboards lead with 69.78% of the surfing equipment market share in 2025, thanks to faster replacement cycles and ongoing material innovation.
Which region shows the fastest growth potential?
Asia-Pacific is projected to expand at a 5.95% CAGR through 2031 as rising middle-class incomes and tourism infrastructure boost participation.
How significant is online retail for surf gear?
Online channels hold a smaller base today but are growing at a 5.82% CAGR, outpacing brick-and-mortar growth as visualization tools improve and direct-to-consumer brands scale.
Why are premium products gaining momentum?
Surfers increasingly pay for lighter carbon constructions and sustainable materials; this premium tier is set for a 5.51% CAGR that outstrips mass-market growth.
Page last updated on:


 Your data is secure and never sold or shared.


