
Surface Vision & Inspection Equipment Market Size and Share
Market Overview
| Study Period | 2020 - 2031 |
|---|---|
| Market Size (2026) | USD 5.09 Billion |
| Market Size (2031) | USD 7.46 Billion |
| Growth Rate (2026 - 2031) | 7.93 % |
| Fastest Growing Market | South America |
| Largest Market | Asia Pacific |
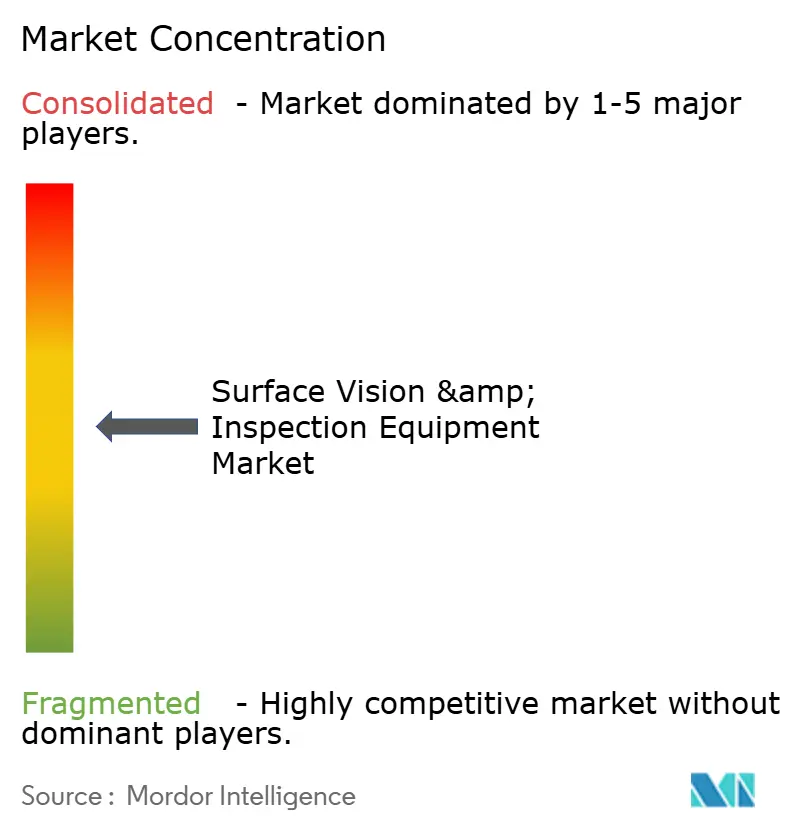
| Market Concentration | Medium |
Major Players *Disclaimer: Major Players sorted in no particular order Image © Mordor Intelligence. Reuse requires attribution under CC BY 4.0. | |
Surface Vision & Inspection Equipment Market Analysis by Mordor Intelligence
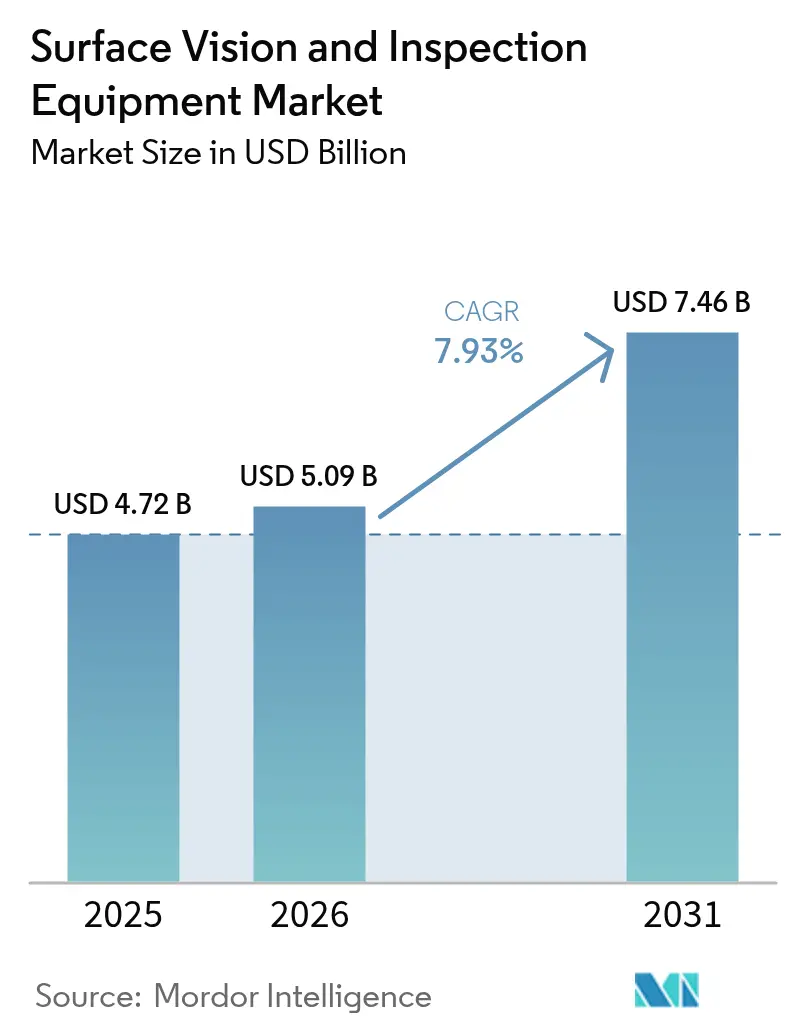
The surface vision and inspection equipment market size is expected to grow from USD 4.72 billion in 2025 to USD 5.09 billion in 2026 and is forecast to reach USD 7.46 billion by 2031 at 7.93% CAGR over 2026-2031. Accelerating adoption of hyperspectral imaging, real-time artificial intelligence (AI) inference at the edge, and pay-per-inspection service models are widening access to advanced visual quality assurance. Demand spikes in automotive battery lines, solar cell production, and semiconductor front-end fabrication reinforce the strategic value of near-zero-defect manufacturing. In tandem, the escalation of connected Industry 4.0 architectures is prompting corporations to place cybersecurity and data governance at the center of vision-system roadmaps. Mid-sized manufacturers are responding by favoring portable, low-capex scanners and pay-as-you-use software subscriptions that shorten investment payback cycles.
Key Report Takeaways
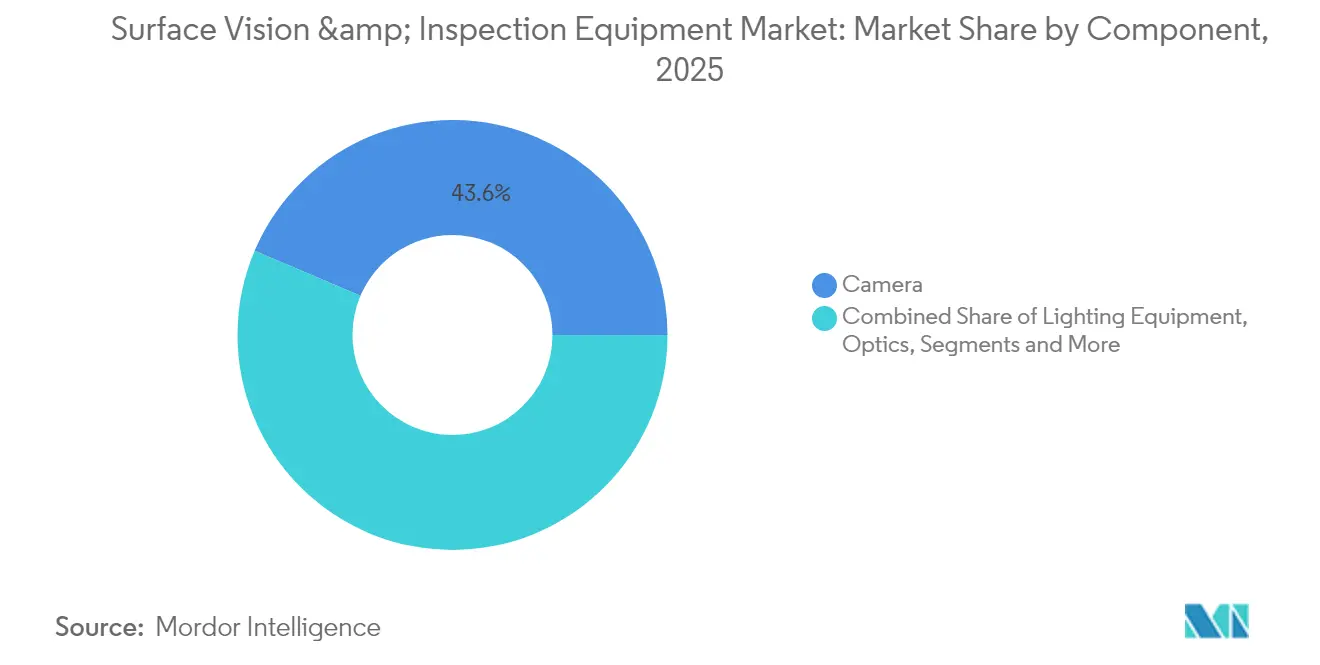
- By component, cameras led with a 43.60% revenue share in 2025, while AI-enabled vision systems are projected to expand at a 9.08% CAGR through 2031.
- By system type, 2D solutions held 62.30% of the surface vision and inspection equipment market share in 2025; AI-enabled systems are set to grow the fastest at an 8.55% CAGR to 2031.
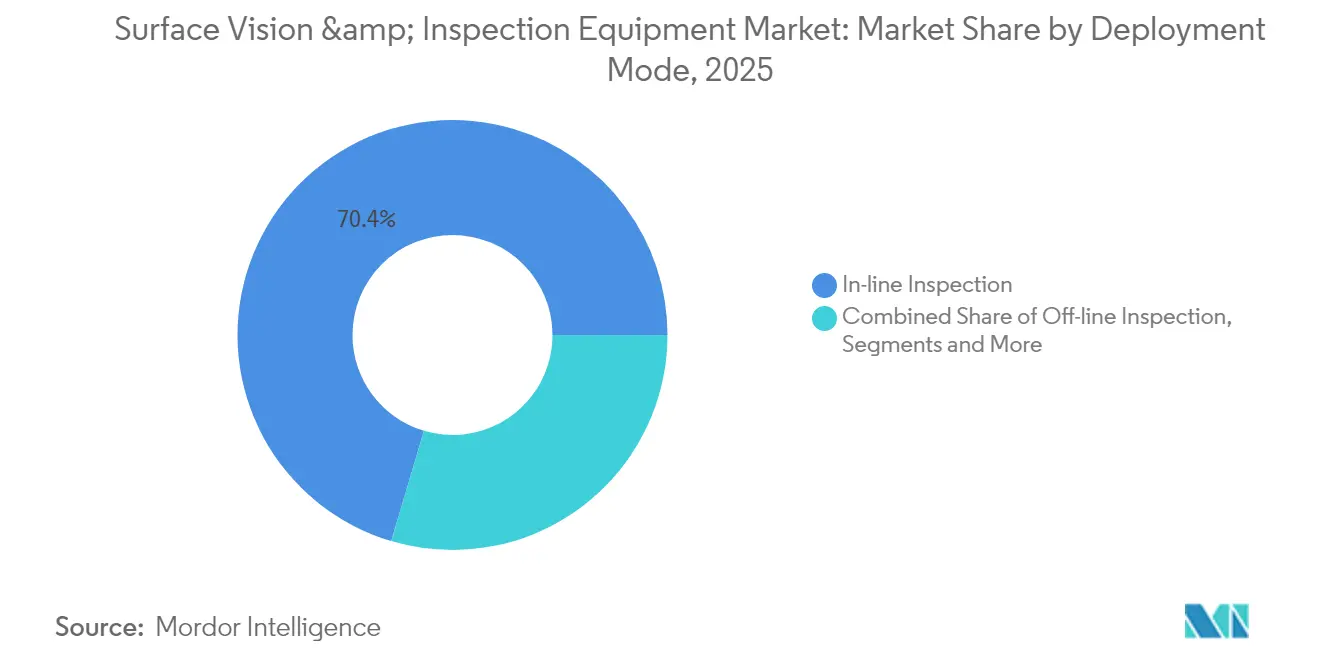
- By deployment mode, in-line inspection accounted for 70.40% of the surface vision and inspection equipment market size in 2025, whereas portable and handheld platforms are advancing at an 7.98% CAGR.
- By application industry, automotive led with 26.40% of the surface vision and inspection equipment market share in 2025, but battery and solar panel lines are positioned for the quickest expansion at a 9.25% CAGR.
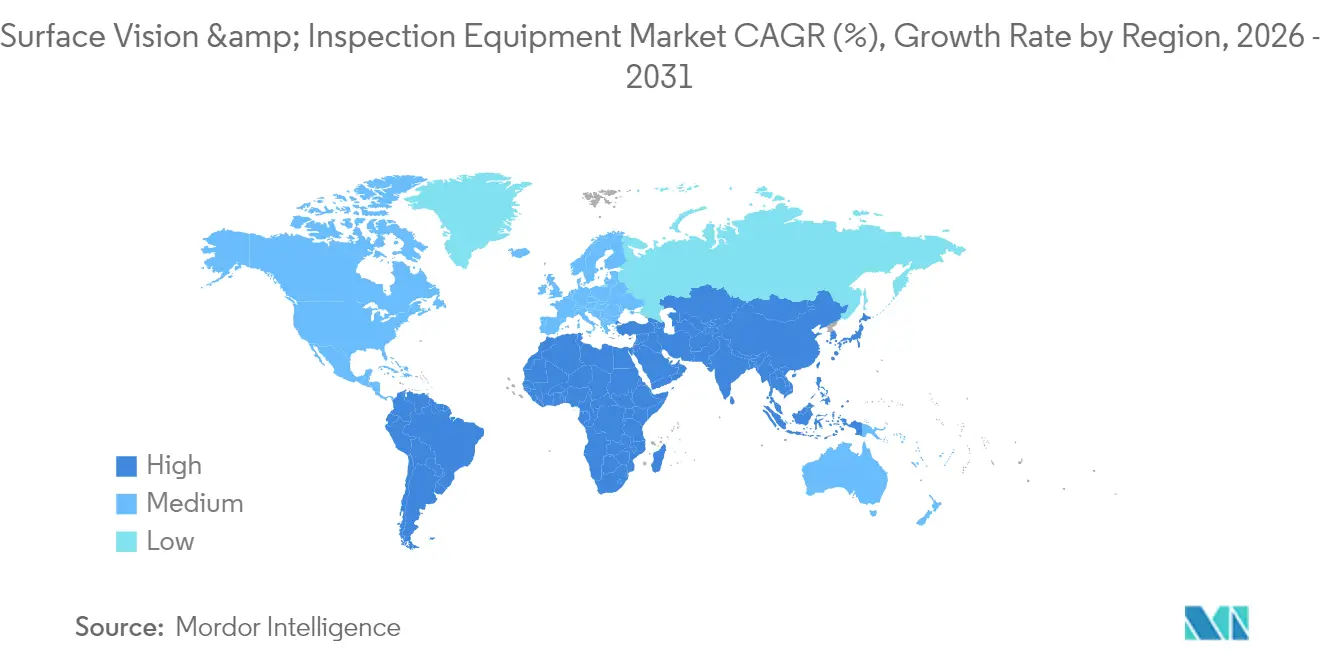
- By geography, Asia Pacific dominated with a 38.40% revenue contribution in 2025, while South America is forecast to register the highest regional CAGR of 8.16% through 2031.
Note: Market size and forecast figures in this report are generated using Mordor Intelligence’s proprietary estimation framework, updated with the latest available data and insights as of 2026.
Market Trends and Insights
Drivers Impact Analysis of Surface Vision & Inspection Equipment Market*
| Driver | (~) % Impact on CAGR Forecast | Geographic Relevance | Impact Timeline |
|---|---|---|---|
| Increasing need for higher manufacturing throughput at lower cost | +2.1% | Global; strongest in APAC hubs | Medium term (2-4 years) |
| Rising demand for zero-defect quality in precision industries | +1.8% | North America & EU automotive, APAC electronics | Long term (≥ 4 years) |
| Adoption of Industry 4.0 and smart-factory automation | +1.6% | Global; led by Germany, China, Japan, South Korea | Medium term (2-4 years) |
| Emergence of hyperspectral imaging for sub-surface defect detection | +1.2% | APAC core; spill-over to North America | Long term (≥ 4 years) |
| Pay-per-inspection service models lowering SME capex barriers | +0.9% | Europe & North America early adopters | Short term (≤ 2 years) |
| ESG-driven mandatory inspection in battery and solar lines | +0.8% | Renewable-energy manufacturing hubs | Medium term (2-4 years) |
| Source: Mordor Intelligence | |||
Increasing need for higher manufacturing throughput at lower cost
Vision-enabled automation is enabling processors to compress inspection cycles from minutes to seconds while sustaining ≥99% detection accuracy, as evidenced by cutting-tool systems running four-second cycles assemblymag.com. Electronics factories operating as “dark” facilities in China validate the 24/7 production model and capture energy savings of 15–20%.[1] Cost-down pressures therefore reinforce the case for the surface vision and inspection equipment market across discrete and process manufacturing.
Rising demand for zero-defect quality in precision industries
Advanced semiconductor nodes, electric-vehicle battery packs, and implantable medical devices tolerate no latent defects. For example, Onto Innovation reported Q1 2025 revenue growth tied to DRAM and gate-all-around geometries, underscoring inspection’s link to wafer yield. Battery cell producers are similarly adopting round-the-clock visual analytics to prevent downstream safety failures. Consequently, the surface vision and inspection equipment market captures rising capital allocations in high-reliability segments.
Adoption of Industry 4.0 and smart-factory automation
Integration of cameras, illumination, and analytics with manufacturing execution systems supports closed-loop optimization. OMRON’s i-BELT data-service platform demonstrates predictive insight by aggregating line data to pre-empt quality drifts. Government programs, such as South Korea’s USD 2.24 billion robotics master plan, further fuel investments that directly reference machine-vision hardware in sensor roadmaps.[2]
Emergence of hyperspectral imaging for sub-surface defect detection
Hyperspectral sensors capture contiguous wavelength ranges, enabling detection of impurities embedded beneath surfaces in aerospace composites, solar wafers, and additive-manufactured powders. As algorithms mature, manufacturers can segment spectral signatures in real time, unlocking new assurance regimes within the surface vision and inspection equipment market.
Restraints Impact Analysis of Surface Vision & Inspection Equipment Market*
| Restraint | (~) % Impact on CAGR Forecast | Geographic Relevance | Impact Timeline |
|---|---|---|---|
| Scarcity of skilled vision engineers and integration complexity | -1.4% | Global, particularly acute in North America and Europe | Long term (≥ 4 years) |
| High upfront cost of high-resolution 3D systems | -0.8% | Global, with higher impact on SMEs in emerging markets | Medium term (2-4 years) |
| Cyber-security risks in connected inspection networks | -0.6% | Global, with highest concern in critical infrastructure sectors | Medium term (2-4 years) |
| Rapid product-mix changes outpacing algorithm update cycles | -0.5% | Global, particularly in high-mix low-volume manufacturing | Short term (≤ 2 years) |
| Source: Mordor Intelligence | |||
Scarcity of skilled vision engineers and integration complexity
Only 19.5% of South Korean SMEs report smart-factory uptake, citing limited technical capability as the top hurdle. [3] Cognex is countering the talent gap by channeling 17% of revenue into R&D to simplify setup through low-code interfaces. Yet the human-capital constraint continues to temper the near-term expansion rate of the surface vision and inspection equipment market.
High upfront cost of high-resolution 3D systems
Metrology-grade 3D platforms can command six-figure price tags, restricting penetration in cost-sensitive factories. A USD 69 million order for DRAM metrology exemplifies the capital intensity in semiconductor environments. Equipment-as-a-Service models are emerging but remain nascent, leaving many SMEs on the sidelines.
*Our forecasts treat driver/restraint impacts as directional, not additive. The impact forecasts reflect baseline growth, mix effects, and variable interactions.
Surface Vision & Inspection Equipment Market Segment Analysis
By Component:
Dominance of Cameras amid AI AccelerationCameras represented 43.60% of 2025 revenue, cementing their status as the foundational element of any inspection stack. Progress in sensor resolution, frame rate, and ultraviolet sensitivity is expanding the attainable defect envelope in semiconductor back-end and micro-LED lines. Lighting and optics integrate tightly with those cameras to expose fine scratches on polished metals and detect voids in transparent substrates. The segment’s scale anchors the surface vision and inspection equipment market and secures volume pricing on complementary optics and frame grabbers.
AI-enabled vision platforms, while a smaller base, are forecast to post a 9.08% CAGR to 2031. Embedding convolutional neural networks directly into smart cameras reduces latencies that previously mandated host-based inference. Cognex’s April 2024 launch of an integrated 3D-with-AI device illustrates how suppliers now collapse multiple sub-systems into a single housing. This convergence is set to reshape the cost stack and expand addressable use cases across the surface vision and inspection equipment market.

By System Type:
2D Established yet AI-Driven Alternatives Scaling2D vision keeps a 62.30% foothold thanks to barcode decoding, presence checks, and label verification that rarely require depth data. These legacy tasks continue to secure incremental refresh revenue as line speeds accelerate. At the same time, AI-enabled configurations are scaling quickly at an 8.55% CAGR, delivering robustness to variable lighting, shape deformation, and overlapping features that confound rule-based scripts. The surface vision and inspection equipment market size for AI-enabled systems is projected to reach USD 2.26 billion by 2031, supported by declining inference-engine costs.
3D imaging remains a niche for applications like gearbox housing measurement or aerospace fastener depth validation, but the blend of structured light and neural inference is starting to blur historical boundaries. Suppliers that merge 2D, 3D, and spectral content within unified software suites stand to capture cross-selling premiums in the surface vision and inspection equipment industry.
By Deployment Mode:
Real-Time In-Line Systems Maintain the LeadIn-line installations delivered 70.40% of 2025 revenue because they intercept defects before value-adding steps. Direct integration with manufacturing execution systems enables instant reject signals and closed-loop process adjustments. Automotive battery-tab welds, for instance, now undergo 100% visual validation within milliseconds to avert downstream thermal-runaway risk. As line tact times shorten, the business case for continuous vision grows stronger, underpinning core demand for the surface vision and inspection equipment market.
Portable and handheld scanners, however, are forecast to post an 7.98% CAGR thanks to wireless operation and no-fixture designs. Hexagon’s 2024 handheld scanner launch demonstrates demand for rapid, point-of-use dimensional checks during rail-carriage repair and aircraft MRO. Off-line laboratories continue to justify investment where deep analytics or regulatory documentation are obligatory, yet they no longer dictate the bulk of spending.
By Application Industry:
Automotive Leads; Energy Transition Spurs GrowthAutomotive retained a 26.40% contribution in 2025, leveraging machine vision for paint integrity, panel-gap measurement, and power-electronics solder joint verification. Regulatory pushes toward Advanced Driver-Assistance Systems (ADAS) calibration further lift image-sensor demand on final assembly lines. Accordingly, the surface vision and inspection equipment market remains tightly coupled to global light-vehicle output.
Battery and solar manufacturing, by contrast, is expanding at a 9.25% CAGR as ESG mandates demand traceable quality metrics. Thin-film defect mapping and electrode alignment are critical to lifetime performance; vision-guided robotics therefore occupy every process stage from coating to pack assembly.Electronics, medical devices, food packaging, and logistics each contribute incremental diversification, ensuring revenue resilience across economic cycles.
Geography Analysis
APAC Surface Vision & Inspection Equipment Market
Asia Pacific captured 38.40% of global revenue in 2025, powered by large-scale electronics and auto supply chains in China, Japan, and South Korea. Chinese machine-vision vendors benefited from ≥30% sales growth in 2024 as state policies reinforced “smart manufacturing” imperatives. South Korea’s robot density of 1,012 units per 10,000 workers illustrates the region’s appetite for automation hardware that embeds intelligent optics.
Europe and North America Surface Vision & Inspection Equipment Market
Europe and North America retain robust demand lines anchored in aerospace, semiconductor front-end, and regulated medical-device sectors that justify premium pricing. The surface vision and inspection equipment market size for North America is forecast to approach USD 1.92 billion by 2031 as electrification and printed-electronics projects proliferate. Manufacturers also value proximity to high-service vendors to navigate integration complexity.
South America and MEA Surface Vision & Inspection Equipment Market
South America is the fastest-growing territory with an 8.16% CAGR, underpinned by Brazil’s modernization agenda and Argentina’s push into automotive and agricultural-equipment exports. Battery and solar investments in Chile and Brazil offer fresh landing zones for vision suppliers. Although Middle East & Africa remains an emerging prospect, rising pharmaceutical production in Saudi Arabia and UAE is laying foundations for future uptake.
Regulatory Landscape
Regulation and standards affecting surface vision and inspection equipment focus on safety, product certification, and documented inspection performance in electronics and industrial machinery. The EU Machinery Regulation (EU) 2023/1230 became fully applicable on May 29, 2026, raising the bar for compliance assessment of industrial equipment and safety-related devices that can include vision-enabled safeguards. IPC released IPC-9716 in December 2024 to standardize Automated Optical Inspection (AOI) process control in printed board assemblies, while ITU-T approved Recommendation F.747.16 in March 2025 defining requirements for 3D machine-vision-based surface defect detection services.
Market access is also shaped by national conformity and authorization regimes that influence test planning and documentation. China’s CNCA released 11 sets of updated CCC implementation rules in April 2026, with changes taking effect July 1, 2026, shifting certain product categories toward mandatory third-party certification. Vietnam’s Ministry of Science and Technology issued Circular No. 14/2026/TT-BKHCN, effective May 25, 2026, introducing a risk-based product certification framework. In the United States, the FCC adopted measures published May 15, 2026 to strengthen equipment authorization program integrity, including prioritization of “Trusted Test Labs” for devices requiring Pre-Approval Guidance, which increases the compliance burden on connected vision hardware that falls under applicable authorization pathways.
Value Chain Analysis
The value chain starts with upstream component supply for cameras/sensors, optics and illumination, embedded processors/edge AI modules, and motion/handling subsystems, then moves to equipment OEMs that integrate imaging hardware with defect-classification software and factory connectivity. Specialized solution providers and metrology/inspection OEMs, including AMETEK Surface Vision and ZEISS Industrial Quality Solutions, sit at the center of the chain by packaging configurable platforms for in-line, off-line, and portable inspection. Niche technology contributors such as TRIOPTICS (optical surface inspection), Fraunhofer IPM (applied inspection measurement concepts), and specialist system builders such as mabri.vision and Asentics show how surface defect detection designs pair optics, mechanical handling, and analytics.
Downstream, system integrators, automation partners, and end users in automotive, electronics, semiconductor/PCB, and medical/pharma shape specifications around throughput, traceability, and auditability, while service providers create a parallel route to market. Independent inspection and auditing firms, including Tetra Inspection and ECQA, support supplier qualification and quality verification programs that often align with sampling and acceptance practices such as ISO 2859-1, and they are increasing digital evidence generation to meet customer reporting needs. Data interoperability and process control standards such as IPC-9716 pull software, reporting, and governance deeper into delivered solutions, expanding lifecycle services such as model maintenance, cybersecurity hardening for connected inspection networks, and periodic recalibration/validation.
Competitive Landscape
The surface vision and inspection equipment market shows moderate fragmentation. Market leaders—Cognex, Keyence, and Omron—leverage integrated hardware-software ecosystems, creating high switching costs and reinforcing customer lock-in. Their combined installed base enables data network effects that feed algorithm refinement, a critical differentiator as AI surpasses rules-based logic.
Strategic mergers are accelerating. AMETEK’s USD 40 million Virtek buyout broadens its footprint in laser-guided assembly while Zebra Technologies’ planned purchase of Photoneo grants immediate entry to area-scan 3D depth capture. Partnerships between software specialists and sensor manufacturers, such as Visionary.ai and Innoviz, demonstrate that competitive advantage is migrating toward full-stack, perception-plus-compute solutions.
Edge-compute architectures are becoming table stakes, evidenced by Endress+Hauser’s collaboration with Sick to embed analytics inside flow-measurement devices. Suppliers that orchestrate hardware, firmware, and spectral analytics within secure, open APIs can secure double-digit service margins even as component ASPs trend lower.
Surface Vision & Inspection Equipment Industry Leaders
-
Omron Corporation
-
Cognex Corporation
-
Isra Vision AG
-
Panasonic Corporation
-
Keyence Corporation
- *Disclaimer: Major Players sorted in no particular order
Surface Vision & Inspection Equipment Market Companies Covered in this Report
- Omron Corporation
- Cognex Corporation
- Keyence Corporation
- Isra Vision AG
- Teledyne DALSA
- Panasonic Corporation
- AMETEK Surface Vision
- Basler AG
- Stemmer Imaging AG
- Matrox Imaging Ltd.
- Edmund Optics Inc.
- Sick AG
- Sony Semiconductor Solutions
- Datalogic S.p.A.
- Shenzhen Sipotek Technology Co., Ltd.
- Daitron Inc.
- Opto Engineering Srl
- FlexFilm Ltd.
- Comvis AG
- Omnitron Sensors
Read Analysis of Surface Vision & Inspection Equipment Companies
Market Opportunities and Future Outlook
Opportunities are expanding where buyers need documented, standardized, and higher-precision inspection performance, pushing suppliers from stand-alone defect flags toward measurable surface characterization and auditable process control. ITU-T Recommendation F.747.16, approved in March 2025, establishes a clearer requirements baseline for 3D machine vision-based surface defect detection services and supports cross-site standardization for global manufacturers. In parallel, ISO 25178-606:2026 (published May 2026) defines design and metrological characteristics for non-contact focus variation instruments for areal surface texture measurement, reinforcing demand for higher-accuracy non-contact methods in applications that already pay for premium optics, calibration discipline, and traceable measurement workflows.
A second opportunity track is the productization of edge AI inspection that reduces integration effort and addresses the skilled-engineer bottleneck highlighted in the market context. In May 2026, Nidec Advance Technology launched its AURCA-series AI-based inspection and measurement solution for semiconductor and printed substrate manufacturing, adding full-color optical inspection with AI defect analysis positioned around yield improvement. In regulated environments, suppliers also face whitespace in validated digital workflows for inspection data and model governance, aligning with documented electronic records and signatures practices used in medical device quality systems, including FDA 21 CFR Part 11-aligned electronic records concepts, and with tighter equipment safety obligations under the EU Machinery Regulation becoming applicable in 2026. These pressures support movement toward unified software environments, traceable reporting, and secure edge deployments that can be replicated across multi-site manufacturing footprints.
Recent Industry Developments in Surface Vision & Inspection Equipment Market
- June 2026: UnitX launched the DeteX AI-powered smart camera at Automate 2026 in Chicago, positioning it as a fast-deploying vision option for factory floors. The release targets deployment friction by packaging imaging and AI into a single device, supporting manufacturers that lack dedicated vision engineering resources.
- May 2026: Cognex announced the general availability of its OneVision collaborative AI vision development environment. Broad availability strengthens a centralized approach to training and deploying AI inspection models across lines and sites, supporting multi-factory standardization of visual quality programs.
- March 2026: Panasonic announced the global licensing launch of its AI Platform for Visual Inspection developed by the Panasonic R&D Center Singapore for infrastructure and production-line quality inspection. The licensing approach broadens access to Panasonic-developed inspection software capabilities and adds competitive pressure on integrated hardware-software offerings.
Surface Vision & Inspection Equipment Market Report Scope and Research Methodology
Market Definition and Coverage
This market covers equipment and software used to visually detect, measure, and classify surface defects and dimensional issues on parts and products during industrial production and handling. It includes camera-based and computer-based vision inspection setups deployed across major end-use industries.
Scope exclusions: Spare parts sold as part of maintenance programs are excluded from the market size.
Segments Covered in This Report
- By Component
- Camera
- Lighting Equipment
- Optics
- Frame Grabbers and Processors
- Software
- Other Components
- By System Type
- 2D Vision Systems
- 3D Vision Systems
- AI-enabled Vision Systems
- By Deployment Mode
- In-line / On-line Inspection
- Off-line Inspection
- Portable / Hand-held Systems
- By Application Industry
- Automotive
- Electrical and Electronics
- Semiconductor and PCB
- Medical and Pharmaceuticals
- Food and Beverage and Packaging
- Metals and Paper
- Postal and Logistics
- Other Industries
- By Geography
- North America
- United States
- Canada
- Mexico
- South America
- Brazil
- Argentina
- Rest of South America
- Europe
- United Kingdom
- Germany
- France
- Italy
- Spain
- Rest of Europe
- Asia Pacific
- China
- Japan
- India
- South Korea
- ASEAN
- Australia
- New Zealand
- Rest of Asia Pacific
- Middle East and Africa
- Middle East
- GCC
- Turkey
- Israel
- Rest of Middle East
- Africa
- South Africa
- Nigeria
- Egypt
- Rest of Africa
- Middle East
- North America
Data Sources, Market Sizing, and Validation
Desk Research
Desk research was used to map the addressable demand pool and to ground the model in observable industrial activity. We referenced public sources such as manufacturing output and industrial production series from national statistics offices, trade and tariff references from the World Customs Organization, technical publications from IEEE and other peer reviewed journals, and patent filings that show the pace of machine vision and imaging innovation. Where helpful, guidelines and updates from standards bodies such as ISO were reviewed to understand inspection and quality management requirements that influence adoption.
To connect that foundation to market sizing, we also reviewed company filings, annual reports, and investor presentations to understand product mix signals and regional exposure, followed by reputed press coverage for capacity expansions and factory automation spending signals. Select paid databases were used only for structured company financials and for patent analytics so that revenue discussions and innovation trends could be cross-checked more consistently. These sources are illustrative, and many other public references were also used to collect data, validate assumptions, and clarify open questions during research.
Primary Interviews and Surveys
Primary work focused on interviews and structured surveys with equipment makers, system integrators, distributors, and end users that run inspection on production lines, including quality teams and plant engineering functions. Since the market is global, adoption patterns were checked across APAC, EMEA, and the Americas, and these discussions were used to confirm typical system configurations (2D versus 3D, in line versus off line), replacement cycles, and how software is bundled or licensed.
Distribution of primary research fieldwork respondents
| Company type | Respondent position | Region |
|---|---|---|
| Top tier: 27% | CXOs: 15% | APAC: 39% |
| Mid tier: 54% | Functional/Unit leaders: 36% | EMEA: 37% |
| Smaller Players: 19% | Managers: 49% | Americas: 24% |
Market-Sizing & Forecasting
Market sizing starts with a top down build where manufacturing automation spend signals and production intensity by industry are used to reconstruct the realistic inspection equipment demand pool by region, then it is filtered through typical penetration levels of machine vision inspection in high defect sensitivity lines. To keep the totals practical, we corroborated the output using selective bottom-up approximations, such as sampled average selling prices for complete systems and key modules (cameras, lighting, optics, frame grabbers) multiplied by estimated shipment volumes, followed by channel checks with integrators.
A few inputs shape the model in a measurable way, including the mix shift toward in line inspection, the adoption of 3D and AI enabled setups where defect complexity is higher, changes in electronics and automotive production throughput, and the cadence of equipment refresh in high utilization factories. Pricing is treated carefully because systems are often bundled with software, so we separate hardware value from software value using interview led split assumptions, and we normalize values into USD using average annual exchange rates for the sizing year.
For forecasting, scenario analysis is used because demand is tied to cyclical factory investments, and the scenarios are anchored on expected industrial output trends, automation program momentum, and the pace of edge AI deployment in inspection workflows. When bottom-up gaps appear in smaller countries or niche end uses, the missing pieces are filled using proxy indicators such as manufacturing value added and export intensity, then re-checked with interview feedback before finalizing growth rates.
Data Validation & Update Cycle
Validation is done through multiple checks so that one data series does not drive the final number. We compare model outputs with independent signals such as industrial production growth, capex cycles in key end use industries, and observed pricing bands for common inspection configurations, then variances are reviewed and corrected with documented logic. Where an outlier is found, respondents are re-contacted to confirm whether it reflects a true market shift or a one-off data artifact.
Before sign-off, the model goes through a multi-step analyst review, including arithmetic checks, assumption sanity checks, and consistency checks across regions and applications. Reports are refreshed annually, and interim updates are triggered when material events occur, such as major regulatory changes, macro shocks affecting factory investment, or step changes in camera and imaging component supply. Right before delivery, a final pass is completed so clients receive the most current view available at that time.
Mordor Intelligence's Surface Vision Inspection Equipment Market Estimate Compared With Other Published Estimates
Published market sizes for surface vision and inspection equipment can look different even when the topic sounds similar, because each publisher applies its own scope and timing choices. Differences usually come from what is counted as equipment versus adjacent services, whether software is treated as part of the market, and which base year exchange rates and inflation assumptions are used.
In this market, the spread is mainly driven by whether spare parts tied to maintenance programs are counted, how hardware and software bundles are split, and whether the estimate leans on an aggressive adoption curve for 3D and AI enabled inspection in all end uses, rather than focusing first on high throughput lines where defect costs are highest. When those assumptions are tightened and checked against system configuration shares and replacement cycles confirmed in interviews, the totals stay closer to the equipment demand pool, which is the approach applied here by Mordor Intelligence.
Benchmark comparison
| Source | Market Size | Gaps in Research Methodology |
|---|---|---|
| Mordor Intelligence | USD 5.09 B (2026) | |
| Industry Publisher A | USD 4.50 B (2024) | Uses an earlier sizing year and may apply different currency timing, and its scope grouping can compress equipment and software bundles in ways that do not always separate complete systems from component level revenues. |
| Global Consultancy B | USD 4.93 B (2025) | Base year and forecast window differ, and the inclusion of broad component categories can lead to overlaps when software and hardware are counted without a consistent bundling split, which shifts the total versus an equipment-only lens. |
The benchmark comparison shows that year selection and scope rules drive most of the differences, not just the growth rate. By keeping inclusions tied to equipment and packaged software value, and by cross-checking adoption and pricing with interview feedback, the final number remains traceable to clear inputs that can be repeated and updated.
Key Questions Answered in the Report
What is the current value of the surface vision and inspection equipment market?
The market generated USD 5.09 billion in 2026 and is projected to reach USD 7.46 billion by 2031.
Which region holds the largest share of the surface vision and inspection equipment market?
Asia Pacific led with 38.40% of global revenue in 2025, driven by large-scale electronics and automotive manufacturing.
Which component segment is expanding the fastest?
AI-enabled vision systems are forecast to grow at a 9.08% CAGR, outpacing all other components through 2031.
Why are battery and solar production lines important for future demand?
ESG mandates require 100% inspection to minimize waste and guarantee safety, pushing battery and solar factories to adopt advanced vision at a 9.25% CAGR.
What is the main restraint hindering wider adoption?
The shortage of skilled vision engineers and the complexity of integrating AI systems with legacy production lines remain the biggest inhibitors to market growth.
How are vendors responding to high upfront system costs?
Equipment-as-a-Service and pay-per-inspection models are emerging, allowing manufacturers to convert capital expenditure into operating expense and de-risk technology adoption.