Sunflower Seed (seed For Sowing) Market Size and Share
Market Overview
| Study Period | 2017 - 2030 |
|---|---|
| Market Size (2025) | USD 1.15 Billion |
| Market Size (2030) | USD 1.52 Billion |
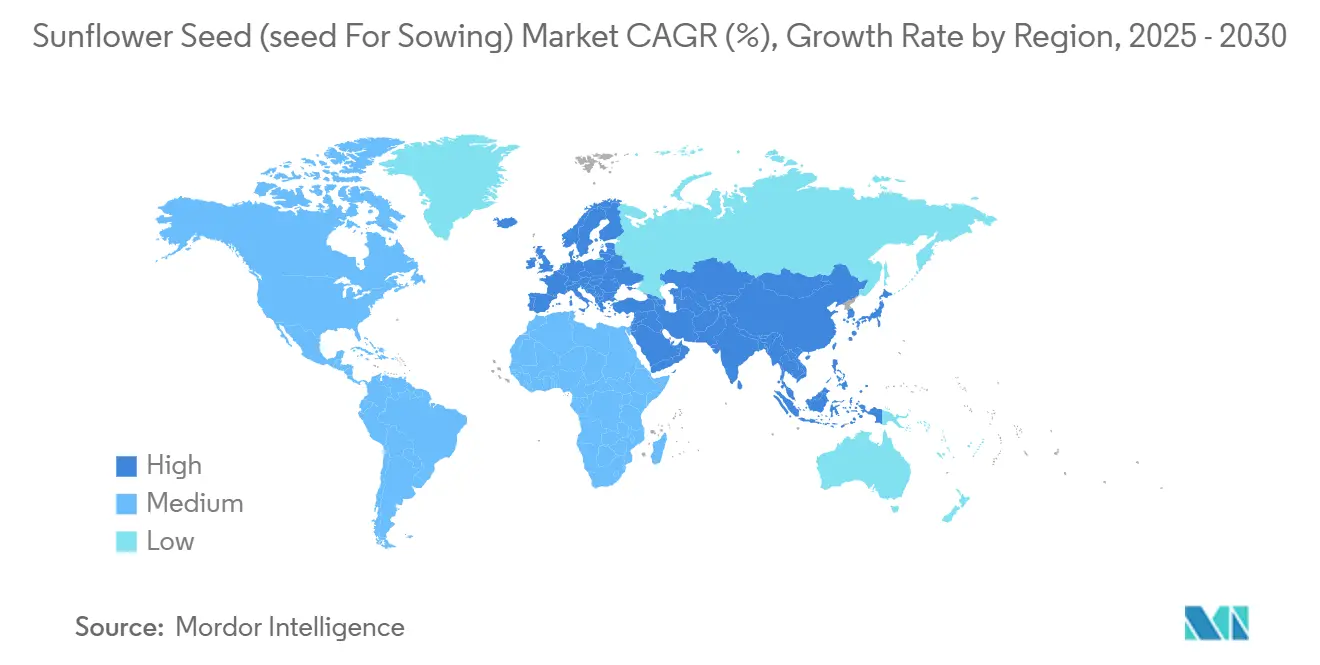
| Growth Rate (2025 - 2030) | 5.63% CAGR |
| Fastest Growing Market | Europe |
| Largest Market | Europe |
| Market Concentration | Medium |
Major Players
*Disclaimer: Major Players sorted in no particular order Image © Mordor Intelligence. Reuse requires attribution under CC BY 4.0. |
|

Sunflower Seed (seed For Sowing) Market Analysis by Mordor Intelligence
The sunflower seed (seed For Sowing) market size reaches USD 1.15 billion in 2025 and is on track to touch USD 1.52 billion by 2030, reflecting a 5.63% CAGR over the forecast period. Robust demand for climate-resilient hybrids, supportive biofuel policies, and widening contract farming frameworks underpin this steady expansion. Hybrid seeds already dominate commercial planting decisions, and evergreen investments in genomic selection shorten breeding cycles, allowing companies to refresh portfolios more rapidly than ever. Simultaneously, European Union renewable energy mandates pull high-oleic varieties into biodiesel channels, while drought-prone regions across the Asia-Pacific and South America pivot acreage toward sunflowers to conserve water and diversify rotations. The convergence of these macro forces positions the sunflower seed market for resilient value creation even amid commodity price swings and phytosanitary complexities.
Key Report Takeaways
- By breeding technology, hybrids led with 91.1% of the sunflower seed market share in 2024, and are forecasted to grow at a CAGR of 5.71% through 2030.
- By geography, Europe accounted for 48.4% of the sunflower seed market share in 2024 and projected the fastest regional CAGR at 6.26% through 2030.
Global Sunflower Seed (seed For Sowing) Market Trends and Insights
Drivers Impact Analysis
| Driver | (~) % Impact on CAGR Forecast | Geographic Relevance | Impact Timeline |
|---|---|---|---|
| Rising adoption of hybrid sunflower seed in high-yield commercial farming | +1.2% | Global, strongest in Europe and North America | Medium term (2-4 years) |
| Expansion of acreage in drought-prone regions favoring sunflower over water-intensive crops | +0.9% | Asia-Pacific core, spill-over to Middle East and Africa and South America | Long term (≥ 4 years) |
| Government biofuel mandates increasing demand for high-oleic sunflower oil | +0.8% | Europe and North America, emerging in Asia-Pacific | Short term (≤ 2 years) |
| Growth of contract farming models with input financing for certified seed | +0.6% | Asia-Pacific, Africa, and South America emerging markets | Medium term (2-4 years) |
| Genomic selection tools shortening breeding cycles for climate-resilient hybrids | +0.5% | Global, led by North America and Europe research and development centers | Long term (≥ 4 years) |
| Carbon-credit programs rewarding oilseed rotation with certified seed traceability | +0.3% | Europe and North America, pilot programs in Australia | Long term (≥ 4 years) |
| Source: Mordor Intelligence | |||
Rising adoption of hybrid sunflower seed in high-yield commercial farming
Commercial farmers are increasingly shifting toward hybrid sunflower varieties due to yield advantages that can exceed 25% compared to open-pollinated alternatives, particularly under optimal growing conditions. This transition is most pronounced in large-scale operations where mechanization and precision agriculture techniques maximize hybrid performance potential. Advanced hybrid breeding programs now incorporate multi-location testing across 15-20 environments annually, enabling seed companies to develop varieties optimized for specific regional conditions and stress tolerance profiles. The economic rationale for hybrid adoption strengthens as farm consolidation increases average operation sizes, allowing fixed seed costs to be amortized across larger acreages. Regulatory influence from OECD (Organisation for Economic Co-operation and Development) seed certification schemes ensures hybrid seed quality standards, supporting farmer confidence in premium-priced varieties.
Expansion of acreage in drought-prone regions favoring sunflower over water-intensive crops
Sunflower cultivation is expanding rapidly in water-stressed agricultural zones where traditional crops face increasing production risks from climate variability. The crop's deep taproot system and efficient water use characteristics make it particularly suitable for semi-arid regions experiencing declining groundwater levels or erratic precipitation patterns. Recent agronomic research demonstrates sunflowers' water use efficiency of 15-20 kg grain per hectare-millimeter of water, significantly outperforming soybeans and corn in moisture-limited environments. This adaptation advantage is driving acreage expansion in Australia's wheat belt, Kazakhstan's steppe regions, and parts of the US Great Plains, where irrigation costs are becoming prohibitive. Government agricultural policies in drought-affected regions increasingly incentivize diversification into drought-tolerant oilseeds through subsidized seed programs and crop insurance adjustments.
Government biofuel mandates increasing demand for high-oleic sunflower oil
Renewable fuel standards across major economies are creating sustained demand for high-oleic sunflower oil, which offers superior oxidative stability for biodiesel production compared to conventional sunflower oil. The European Union's Renewable Energy Directive II mandates 14% renewable energy in transport by 2030, with specific provisions favoring advanced biofuels from non-food crops.[1]Source: European Commission, “Renewable Energy Directive - Targets and Rules,” energy.ec.europa.eu High-oleic varieties command price premiums of USD 50-80 per metric ton over conventional types, incentivizing seed companies to expand breeding programs focused on oleic acid content optimization. Argentina's biodiesel export policies and Brazil's RenovaBio program further amplify demand for specialized sunflower varieties designed for industrial processing applications.
Growth of contract farming models with input financing for certified seed
Contract farming arrangements with integrated input financing are transforming seed distribution channels in emerging markets, particularly where smallholder farmers lack access to formal credit systems. These models typically involve seed companies or agricultural processors providing certified seeds, fertilizers, and technical support in exchange for guaranteed crop purchase agreements at predetermined prices. Recent implementations in India's Telangana state and Kenya's Rift Valley demonstrate how contract farming can increase hybrid seed adoption rates from 15% to 65% within three growing seasons.[2]Source: International Food Policy Research Institute, “Contract Farming in Developing Countries: Impact Assessment,” ifpri.org The financing component removes upfront cost barriers that traditionally prevented smallholders from accessing premium seed varieties, while quality assurance requirements drive demand for certified seed sources.
Restraints Impact Analysis
| Restraint | (~) % Impact on CAGR Forecast | Geographic Relevance | Impact Timeline |
|---|---|---|---|
| Price volatility of competing oilseed crops reducing growers’ seed budgets | -0.7% | Global, most severe in price-sensitive emerging markets | Short term (≤ 2 years) |
| Complex and divergent phytosanitary rules on seed imports and field isolation | -0.5% | Global trade corridors, notably Europe-Asia and Americas-Africa | Medium term (2-4 years) |
| Rising incidence of broomrape races resistant to existing genetic sources | -0.4% | Europe, Middle East, and North Africa sunflower regions | Long term (≥ 4 years) |
| Farm-saved seed in smallholder systems limiting commercial seed penetration | -0.6% | Asia-Pacific, Africa, and parts of South America | Long term (≥ 4 years) |
| Source: Mordor Intelligence | |||
Price volatility of competing oilseed crops reducing growers’ seed budgets
Volatile commodity prices for competing oilseeds create uncertainty in farmer planting decisions, often leading to reduced seed budgets when crop price outlooks deteriorate. Palm oil price fluctuations, which declined 18% in early 2024 before recovering, directly impact sunflower oil demand and consequently affect farmers' willingness to invest in premium seed varieties. Soybean price cycles compound this challenge, as many farmers view soybeans and sunflowers as interchangeable rotation crops, switching based on relative price expectations. This volatility particularly affects emerging market farmers with limited financial buffers, who may defer hybrid seed purchases in favor of lower-cost alternatives during periods of price uncertainty.
Complex and divergent phytosanitary rules on seed imports and field isolation
Increasingly complex seed import regulations and field isolation requirements are fragmenting global seed trade flows, forcing companies to maintain separate breeding programs for different regulatory jurisdictions. The European Union's plant health regulations require 500-meter isolation distances for sunflower seed production fields, significantly increasing land costs and limiting production scalability.[3]Source: European Food Safety Authority, “Plant Health Regulations for Seed Production,” efsa.europa.eu Divergent testing requirements for seed-borne pathogens across countries create additional compliance costs, with some markets requiring up to 18 months of quarantine testing before import approval. These regulatory complexities favor large multinational seed companies with resources to navigate multiple compliance frameworks, potentially limiting market access for innovative smaller players.
Segment Analysis
Hybrid seeds commanded 91.1% of the sunflower seed (seed For Sowing) market share in 2024 and are projected to grow at a 5.71% CAGR, underscoring their entrenched lead. This share translates into the largest portion of the sunflower seed market size for any technology group. Hybrids routinely yield 20-30% more than open-pollinated varieties under mechanized management and respond better to precision nutrient placement. Companies deploy doubled haploid techniques to collapse development timelines, releasing climate-ready material ahead of shifting weather patterns.
Open-pollinated and hybrid-derivative lines find niches among smallholders who prioritize seed-saving traditions. Improved certification schemes boost their genetic purity, yet their gains seldom eclipse hybrid returns under input-intensive systems. The sunflower seed market retains space for these alternatives where affordability trumps outright yield.

Note: Segment shares of all individual segments available upon report purchase
Geography Analysis
Europe holds the largest slice of the sunflower seed (seed For Sowing) market, with a 48.4% share in 2024 and a 6.26% regional CAGR that surpasses the global average. Structured farm supports under the Common Agricultural Policy promote crop diversification, and renewable fuel directives guarantee pull for high-oleic varieties. Ukraine’s infrastructure recovery and Romania’s expansion solidify seed demand, while France, Spain, and Germany maintain near-universal hybrid adoption, banking on robust dealer networks.
Asia-Pacific emerges as the second-largest consumer with fast-rising demand. China’s Inner Mongolia and Xinjiang provinces lift plantings to lessen reliance on imported palm oil. India accelerates hybrid penetration with subsidized seed kits and agronomy training. Australia’s wheat belt swaps declining wheat margins for sunflower, favored by its water-efficient physiology and compatibility with mechanical harvesters.
North America, South America, Africa, and the Middle East round out the market. The United States and Canada focus on confectionery and high-oleic niches for food service. Argentina maintains processing competitiveness, exporting meal and oil with preferential tariffs, while Brazil integrates sunflowers into soybean-corn rotations for soil health. Egypt and South Africa widen sunflower portfolios to reinforce food security, although infrastructural gaps and limited certified seed access temper growth.
Competitive Landscape
The sunflower seed market features moderate concentration: the five largest breeders hold a significant portion of global sales, leaving notable headroom for regional specialists. Firms such as Corteva Agriscience, Land O’Lakes Inc., Nufarm, KWS SAAT SE & Co. KGaA, and Euralis Semences lean on continental research networks that funnel locally adapted hybrids into commercial channels. Patent filings for genomic selection and broomrape resistance rose 23% in 2024, highlighting a technological arms race.
Large companies adopt vertical integration, controlling breeder seed, foundation multiplication, and distribution to steady supply and protect intellectual property. Acquisition of regional breeders grants instant access to endemic germplasm and entrenched retail chains, illustrated by KWS buying Tareks Tohum. Smaller players differentiate through organic certification or tailor-made oil profiles, carving profitable niches without competing head-to-head with multinationals.
Regulatory navigation becomes a strategic moat. Complying with varied phytosanitary mandates requires segregated production, dedicated quality assurance staff, and robust tracing software, costs that smaller entrants find prohibitive. Consequently, scale and geographic diversification confer competitive durability.
Sunflower Seed (seed For Sowing) Industry Leaders
-
Corteva Agriscience
-
Euralis Semences
-
KWS SAAT SE & Co. KGaA
-
Land O’Lakes Inc.
-
Nufarm
- *Disclaimer: Major Players sorted in no particular order

Recent Industry Developments
- October 2025: Corteva Agriscience announced plans to separate its seed and pesticide operations into two independent, publicly traded companies by 2026. This organizational restructuring aims to enable targeted investments and research in seed development, including sunflower hybrids for international markets.
- September 2025: The reintroduction of a high-yielding sunflower variety in Uganda's Lango sub-region aims to strengthen local oilseed production. The Mukwano Group, with government support, implemented this initiative to increase farmer incomes and enhance agro-industrial development. The program aligns with Uganda's Parish Development Model, which focuses on community-based economic growth.
- August 2024: At the 2024 AAPRESID Congress in Argentina, Advanta Seeds Argentina presented its new sunflower hybrids, which feature high oil content, drought tolerance, and disease resistance. The development aims to increase productivity and sustainability for sunflower growers in South America and other regions.
Global Sunflower Seed (seed For Sowing) Market Report Scope
Hybrids, Open Pollinated Varieties & Hybrid Derivatives are covered as segments by Breeding Technology. Africa, Asia-Pacific, Europe, Middle East, North America, South America are covered as segments by Region.| Hybrids | Non-Transgenic Hybrids |
| Open Pollinated Varieties and Hybrid Derivatives |
| Africa | By Breeding Technology | |
| By Country | Egypt | |
| Ethiopia | ||
| Ghana | ||
| Kenya | ||
| Nigeria | ||
| South Africa | ||
| Tanzania | ||
| Rest of Africa | ||
| Asia-Pacific | By Breeding Technology | |
| Australia | ||
| Bangladesh | ||
| China | ||
| India | ||
| Indonesia | ||
| Myanmar | ||
| Pakistan | ||
| Thailand | ||
| Rest of Asia-Pacific | ||
| Europe | By Breeding Technology | |
| France | ||
| Germany | ||
| Italy | ||
| Netherlands | ||
| Poland | ||
| Romania | ||
| Russia | ||
| Spain | ||
| Turkey | ||
| Ukraine | ||
| United Kingdom | ||
| Rest of Europe | ||
| Middle East | By Breeding Technology | |
| Iran | ||
| Rest of Middle East | ||
| North America | By Breeding Technology | |
| Canada | ||
| Mexico | ||
| United States | ||
| South America | By Breeding Technology | |
| Argentina | ||
| Brazil | ||
| Rest of South America | ||
| Breeding Technology | Hybrids | Non-Transgenic Hybrids | |
| Open Pollinated Varieties and Hybrid Derivatives | |||
| Geography | Africa | By Breeding Technology | |
| By Country | Egypt | ||
| Ethiopia | |||
| Ghana | |||
| Kenya | |||
| Nigeria | |||
| South Africa | |||
| Tanzania | |||
| Rest of Africa | |||
| Asia-Pacific | By Breeding Technology | ||
| Australia | |||
| Bangladesh | |||
| China | |||
| India | |||
| Indonesia | |||
| Myanmar | |||
| Pakistan | |||
| Thailand | |||
| Rest of Asia-Pacific | |||
| Europe | By Breeding Technology | ||
| France | |||
| Germany | |||
| Italy | |||
| Netherlands | |||
| Poland | |||
| Romania | |||
| Russia | |||
| Spain | |||
| Turkey | |||
| Ukraine | |||
| United Kingdom | |||
| Rest of Europe | |||
| Middle East | By Breeding Technology | ||
| Iran | |||
| Rest of Middle East | |||
| North America | By Breeding Technology | ||
| Canada | |||
| Mexico | |||
| United States | |||
| South America | By Breeding Technology | ||
| Argentina | |||
| Brazil | |||
| Rest of South America | |||
Market Definition
- Commercial Seed - For the purpose of this study, only commercial seeds have been included as part of the scope. Farm-saved Seeds, which are not commercially labeled are excluded from scope, even though a minor percentage of farm-saved seeds are exchanged commercially among farmers. The scope also excludes vegetatively reproduced crops and plant parts, which may be commercially sold in the market.
- Crop Acreage - While calculating the acreage under different crops, the Gross Cropped Area has been considered. Also known as Area Harvested, according to the Food & Agricultural Organization (FAO), this includes the total area cultivated under a particular crop across seasons.
- Seed Replacement Rate - Seed Replacement Rate is the percentage of area sown out of the total area of crop planted in the season by using certified/quality seeds other than the farm-saved seed.
- Protected Cultivation - The report defines protected cultivation as the process of growing crops in a controlled environment. This includes greenhouses, glasshouses, hydroponics, aeroponics, or any other cultivation system that protects the crop against any abiotic stress. However, cultivation in an open field using plastic mulch is excluded from this definition and is included under open field.
| Keyword | Definition |
|---|---|
| Row Crops | These are usually the field crops which include the different crop categories like grains & cereals, oilseeds, fiber crops like cotton, pulses, and forage crops. |
| Solanaceae | These are the family of flowering plants which includes tomato, chili, eggplants, and other crops. |
| Cucurbits | It represents a gourd family consisting of about 965 species in around 95 genera. The major crops considered for this study include Cucumber & Gherkin, Pumpkin and squash, and other crops. |
| Brassicas | It is a genus of plants in the cabbage and mustard family. It includes crops such as carrots, cabbage, cauliflower & broccoli. |
| Roots & Bulbs | The roots and bulbs segment includes onion, garlic, potato, and other crops. |
| Unclassified Vegetables | This segment in the report includes the crops which don’t belong to any of the above-mentioned categories. These include crops such as okra, asparagus, lettuce, peas, spinach, and others. |
| Hybrid Seed | It is the first generation of the seed produced by controlling cross-pollination and by combining two or more varieties, or species. |
| Transgenic Seed | It is a seed that is genetically modified to contain certain desirable input and/or output traits. |
| Non-Transgenic Seed | The seed produced through cross-pollination without any genetic modification. |
| Open-Pollinated Varieties & Hybrid Derivatives | Open-pollinated varieties produce seeds true to type as they cross-pollinate only with other plants of the same variety. |
| Other Solanaceae | The crops considered under other Solanaceae include bell peppers and other different peppers based on the locality of the respective countries. |
| Other Brassicaceae | The crops considered under other brassicas include radishes, turnips, Brussels sprouts, and kale. |
| Other Roots & Bulbs | The crops considered under other roots & bulbs include Sweet Potatoes and cassava. |
| Other Cucurbits | The crops considered under other cucurbits include gourds (bottle gourd, bitter gourd, ridge gourd, Snake gourd, and others). |
| Other Grains & Cereals | The crops considered under other grains & cereals include Barley, Buck Wheat, Canary Seed, Triticale, Oats, Millets, and Rye. |
| Other Fibre Crops | The crops considered under other fibers include Hemp, Jute, Agave fibers, Flax, Kenaf, Ramie, Abaca, Sisal, and Kapok. |
| Other Oilseeds | The crops considered under other oilseeds include Ground nut, Hempseed, Mustard seed, Castor seeds, safflower seeds, Sesame seeds, and Linseeds. |
| Other Forage Crops | The crops considered under other forages include Napier grass, Oat grass, White clover, Ryegrass, and Timothy. Other forage crops were considered based on the locality of the respective countries. |
| Pulses | Pigeon peas, Lentils, Broad and horse beans, Vetches, Chickpeas, Cowpeas, Lupins, and Bambara beans are the crops considered under pulses. |
| Other Unclassified Vegetables | The crops considered under other unclassified vegetables include Artichokes, Cassava Leaves, Leeks, Chicory, and String beans. |
Research Methodology
Mordor Intelligence follows a four-step methodology in all our reports.
- Step-1: IDENTIFY KEY VARIABLES: In order to build a robust forecasting methodology, the variables and factors identified in Step-1 are tested against available historical market numbers. Through an iterative process, the variables required for market forecast are set and the model is built on the basis of these variables.
- Step-2: Build a Market Model: Market-size estimations for the forecast years are in nominal terms. Inflation is not a part of the pricing, and the average selling price (ASP) is kept constant throughout the forecast period.
- Step-3: Validate and Finalize: In this important step, all market numbers, variables and analyst calls are validated through an extensive network of primary research experts from the market studied. The respondents are selected across levels and functions to generate a holistic picture of the market studied.
- Step-4: Research Outputs: Syndicated Reports, Custom Consulting Assignments, Databases, and Subscription Platforms


