
Sulfur Fertilizer Market Size and Share
Market Overview
| Study Period | 2021 - 2031 |
|---|---|
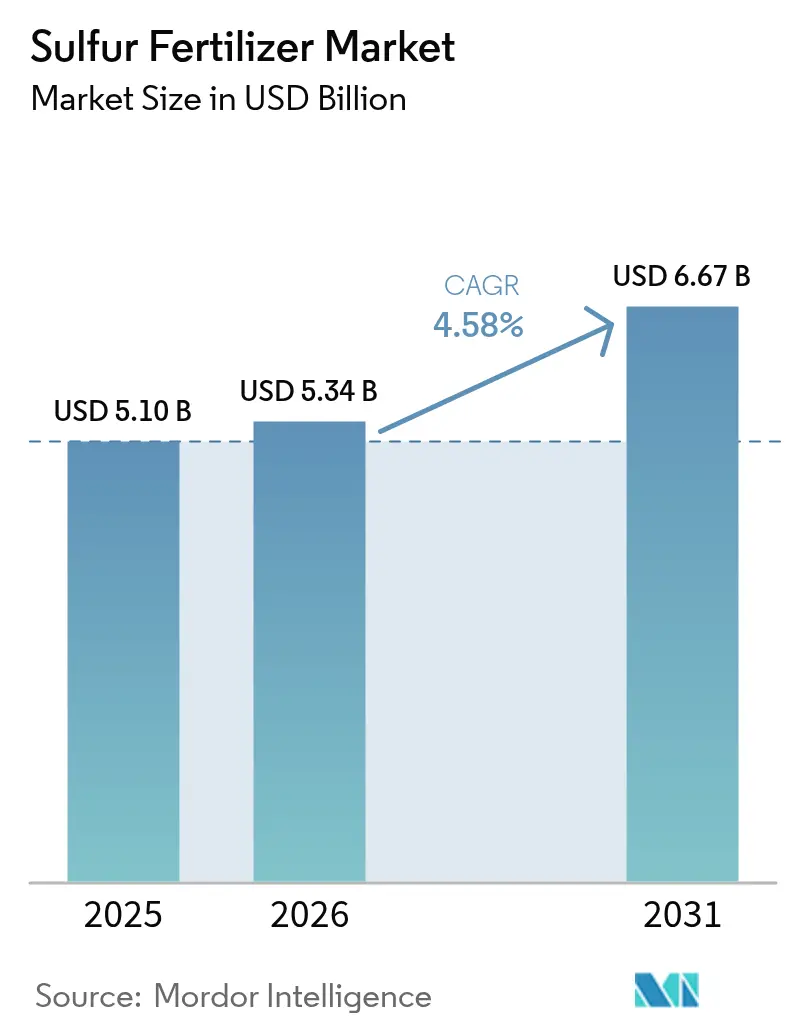
| Market Size (2026) | USD 5.34 Billion |
| Market Size (2031) | USD 6.67 Billion |
| Growth Rate (2026 - 2031) | 4.58 % |
| Fastest Growing Market | Africa |
| Largest Market | Asia Pacific |
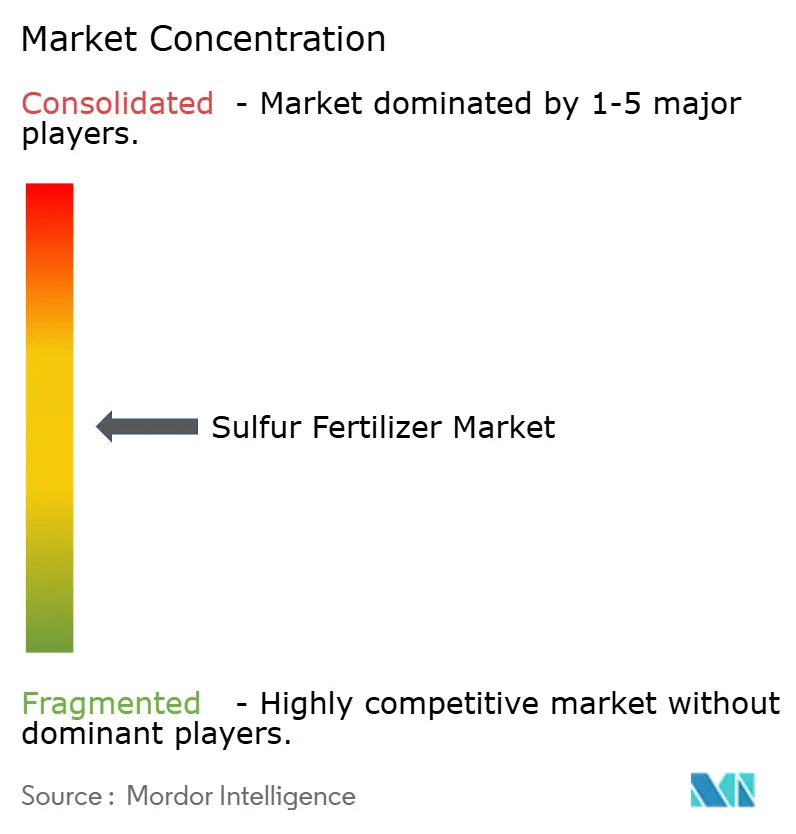
| Market Concentration | Medium |
Major Players *Disclaimer: Major Players sorted in no particular order Image © Mordor Intelligence. Reuse requires attribution under CC BY 4.0. | |
Sulfur Fertilizer Market Analysis by Mordor Intelligence
Sulfur fertilizers market size in 2026 is estimated at USD 5.34 billion, growing from 2025 value of USD 5.1 billion with 2031 projections showing USD 6.67 billion, growing at 4.58% CAGR over 2026-2031. Gains stem from the sharp decline in atmospheric sulfur deposition, which has fallen more than 70% since the 1990s, leaving soils depleted and crops increasingly responsive to applied sulfur. The Asia-Pacific region leads consumption on the back of China’s 48.9 million metric tons annual fertilizer use and India’s expanding precision fertilization programs. Africa represents the fastest-growing regional opportunity as infrastructure upgrades and food-security initiatives accelerate balanced nutrient adoption. Industry momentum is further supported by refinery desulfurization streams that now provide more than 60% of all elemental sulfur used in fertilizer manufacturing, although supply can tighten whenever refining margins compress.
Key Report Takeaways
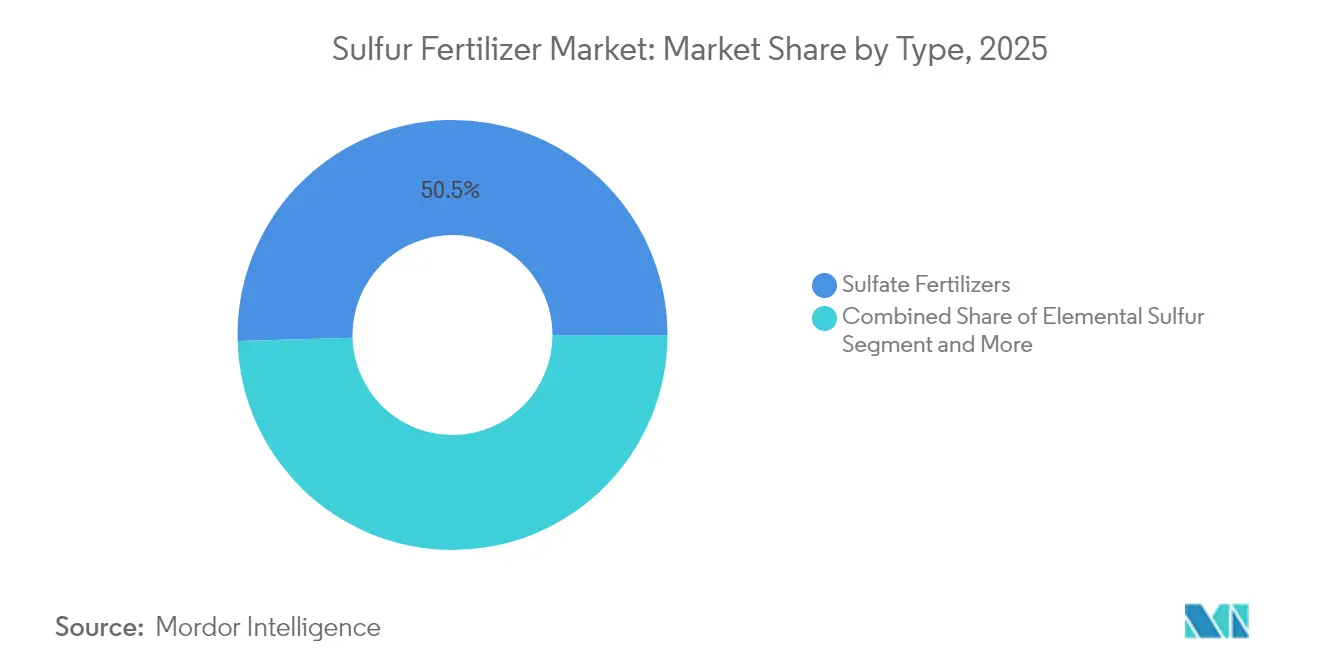
- By type, sulfate fertilizers led with 50.45% of the sulfur fertilizers market share in 2025, while elemental sulfur is projected to grow at a 6.39% CAGR through 2031.
- By form, solid products accounted for 69.25% of the sulfur fertilizers market share in 2025, whereas liquid formulations are advancing at a 6.95% CAGR to 2031.
- By mode of application, soil application captured 59.40% of the sulfur fertilizers market size in 2025, while controlled release and coated granules represent the fastest track at an 7.62% CAGR through 2031.
- By crop, oilseeds and pulses held 39.55% of the sulfur fertilizers market share in 2025, while fruits and vegetables are forecast to expand at a 6.42% CAGR to 2031.
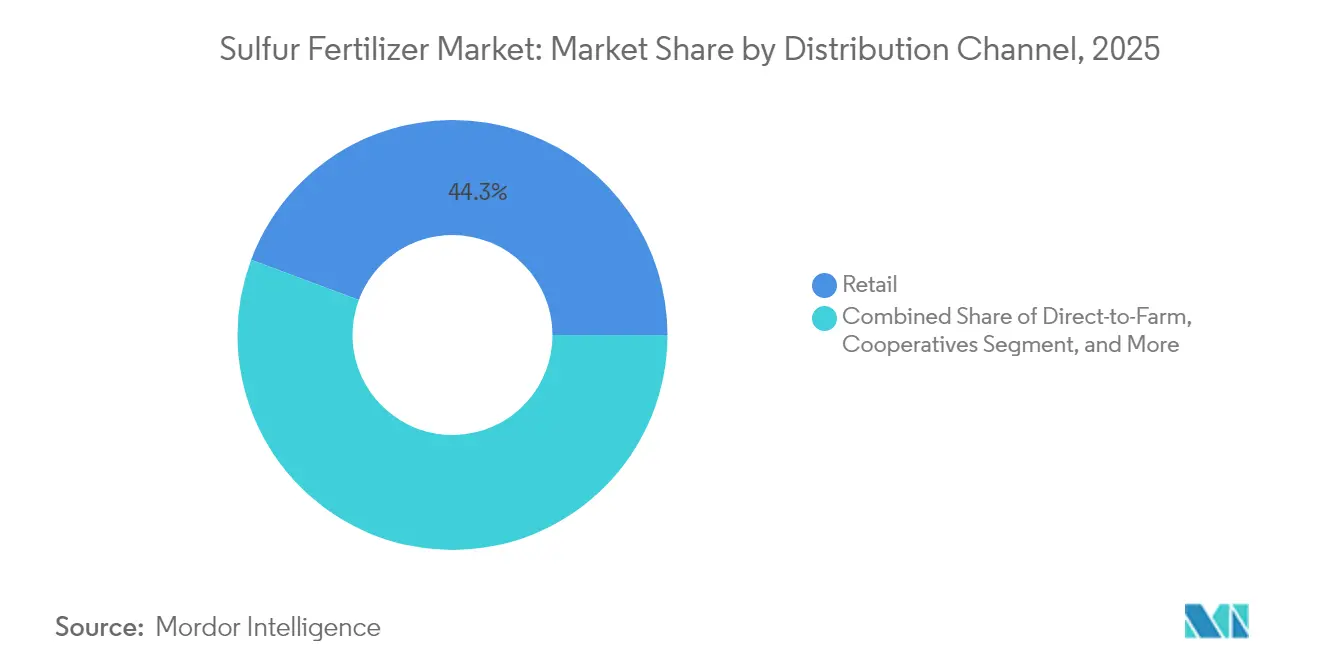
- By distribution channel, retail dealers secured 44.30% of global revenue in 2025, and online platforms are set to grow at a 8.72% CAGR through 2031.
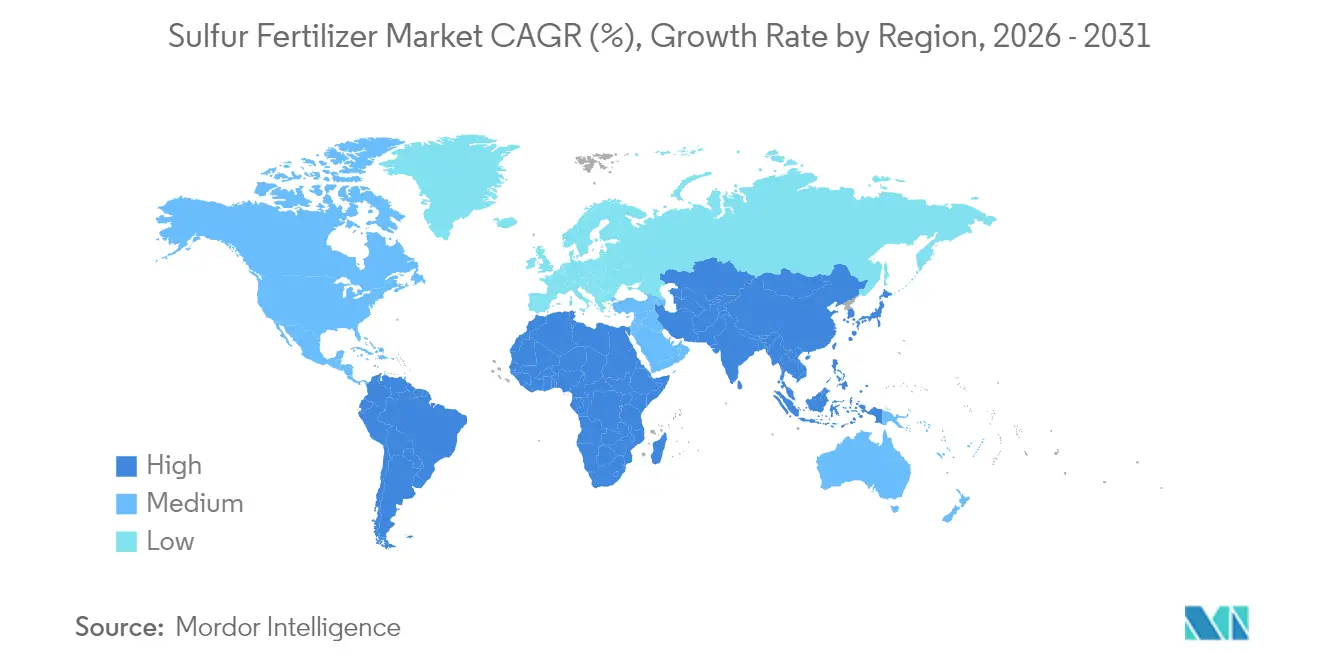
- By geography, Asia-Pacific dominated with a 36.55% share in 2025, and Africa is anticipated to record the fastest growth at a 6.15% CAGR to 2031.
- The top five suppliers controlled 51% of global revenue in 2024, with Nutrien leading at 14% followed by Yara International at 12% and Mosaic at 10%.
Note: Market size and forecast figures in this report are generated using Mordor Intelligence’s proprietary estimation framework, updated with the latest available data and insights as of 2026.
Market Trends and Insights
Drivers Impact Analysis of Sulfur Fertilizer Market*
| Driver | (~) % Impact on CAGR Forecast | Geographic Relevance | Impact Timeline |
|---|---|---|---|
| Sulfur deficiency in soil | +1.2% | Asia-Pacific and North America | Medium term (2-4 years) |
| Rising oilseed acreage and yields | +0.9% | North America, South America, Asia-Pacific | Long term (≥ 4 years) |
| Government incentives for sustainable agriculture | +0.7% | Europe and Asia-Pacific, with spill-over to Africa and South America | Medium term (2-4 years) |
| Adoption of controlled-release sulfur-coated urea | +0.6% | North America and Europe, expanding into Asia-Pacific | Long term (≥ 4 years) |
| Availability of recovered sulfur from desulfurization units | +0.4% | Middle East and North America | Short term (≤ 2 years) |
| AI-based precision nutrient platforms | +0.3% | North America and Europe, early uptake in Asia-Pacific | Long term (≥ 4 years) |
| Source: Mordor Intelligence | |||
Sulfur Deficiency in Soil
Soil tests indicate sulfur levels have fallen 30-50% during the past three decades as air-quality rules removed sulfate aerosols, making sulfur the fourth most yield-limiting nutrient after nitrogen, phosphorus, and potassium. Crops that receive 30-45 kilograms of sulfur per hectare show wheat yield gains of 15-25% together with higher grain protein. Intensively cropped regions with low organic matter are the most vulnerable, and site-specific test kits now allow farmers to map deficiencies before the season begins. This capability is a primary engine for the sulfur fertilizers market because it converts latent nutrient shortages into measurable demand. Yield monitors on commercial corn farms now record site yield drops of up to 18% when leaf sulfur falls below 0.2%, underscoring the economic stakes for large operations. As climate patterns shift rainfall distribution, leaching losses further lower residual sulfur, making annual supplementation a practical necessity.
Rising Oilseed Acreage and Yields
Oilseed crops such as canola and soybean require two to three times more sulfur per unit of nitrogen than cereals, which intensifies fertilizer demand as the global planted area expands. University field trials in Missouri report 8.1 bushel-per-acre soybean gains from 100 pounds of ammonium sulfate, yielding a USD 80 per-acre profit lift after input costs. The economics encourage continued adoption even in mature markets, reinforcing a stable pull-through on sulfur volumes. Global canola acreage is projected to expand by 1.8 million hectares by 2030, amplifying demand for high-sulfur blends in Canada and Australia. Biotech cultivars with higher protein ceilings also pull more sulfur, linking seed genetics directly to fertilizer strategy.
Government Incentives for Sustainable Agriculture
Public programs increasingly tie funding to balanced nutrient plans that include sulfur. For example, the USDA committed USD 517 million to expand domestic fertilizer capacity in 2025, explicitly citing the need for sulfur-enhanced blends.[1]Source: U.S. Environmental Protection Agency, “Sulfate Groundwater Concerns,” epa.gov Europe’s Fertilizer Products Regulation requires full nutrient disclosure, pushing producers toward formulations that show superior use efficiency. Asia-Pacific governments, especially China, are steering subsidies to precision placement tools that optimize sulfur timing, deepening demand in the region. Indonesia granted value-added tax exemptions on sulfur-enhanced fertilizers starting in 2025, lowering farm-gate prices and accelerating adoption. Such policies reinforce a feedback loop where regulatory focus on nutrient efficiency translates into higher market penetration for sulfur-based solutions.
Adoption of Controlled-Release Sulfur-Coated Urea
Sulfur-coated urea improves nitrogen efficiency by 26% compared with uncoated urea while supplying a slow-release stream of plant-available sulfur[2]Source: Technical Bulletin, “Controlled-Release Coatings Improve Urea Efficiency,” acs.org . Farmers gain from fewer passes, lower volatilization, and steadier nutrient curves, aligning with precision-agriculture objectives. Manufacturing advances have lowered coating costs and enhanced durability, helping controlled-release products gain shelf space in both premium and broad-acre channels. University trials in Texas cotton fields show a 9% lint yield lift when sulfur-coated urea is replaced with straight urea during side-dress. Retailers report that year-over-year sales of coated grades rose 14% in 2024, signaling broad acceptance beyond niche users.
Restraints Impact Analysis of Sulfur Fertilizer Market*
| Restraint | (~) % Impact on CAGR Forecast | Geographic Relevance | Impact Timeline |
|---|---|---|---|
| Competition from multi-nutrient specialty fertilizers | −0.8% | North America and Europe | Medium term (2-4 years) |
| Volatility in elemental sulfur prices | −0.6% | Import-dependent markets worldwide | Short term (≤ 2 years) |
| Environmental risk of sulfate leaching into groundwater | −0.4% | Europe and North America, growing in Asia-Pacific | Long term (≥ 4 years) |
| Distribution bottlenecks for prilled elemental sulfur in emerging markets | −0.3% | Africa and parts of Asia-Pacific | Medium term (2-4 years) |
| Source: Mordor Intelligence | |||
Competition from Multi-Nutrient Specialty Fertilizers
Farmers increasingly favor single-pass blends that address multiple deficiencies, which can dilute standalone demand for sulfur. Suppliers are responding by embedding sulfur into broader nutrient packages, but pricing competition and formulation complexity raise barriers for smaller producers. Large distributors bundle mix and match micronutrient packs that include sulfur at lower incremental cost, eroding standalone sales. To stay relevant, sulfur fertilizer suppliers are exploring co-marketing alliances that offer turnkey crop nutrition programs. Such shifts could compress standalone sulfur margins and push consolidation among smaller players.
Volatility in Elemental Sulfur Prices
Contract sulfur traded between USD 69 and USD 116 per metric ton during 2024, and new 25% tariffs on Canadian shipments to the United States effective February 2025 add further unpredictability. Price swings erode budgeting confidence for growers and manufacturers alike, tempering near-term procurement. Forward contracts help insulate manufacturers, but farmers often purchase closer to application season and feel the brunt of price spikes. Volatility also complicates capital planning for new sulfur-beneficiation plants, delaying investments that could stabilize the supply chain. Ultimately, unpredictable input costs ripple down to retail prices, affecting growers' budget allocations for the sulfur fertilizers market.
*Our forecasts treat driver/restraint impacts as directional, not additive. The impact forecasts reflect baseline growth, mix effects, and variable interactions.
Sulfur Fertilizer Market Segment Analysis
By Type:
Sulfate Dominance Faces Elemental ChallengeIn 2025, sulfate fertilizers such as ammonium sulfate, potassium sulfate, and single superphosphate delivered 50.45% of global revenue, reflecting their immediate plant availability and ease of blending. Elemental sulfur, though smaller, is growing faster at a 6.39% CAGR as its higher analysis lowers freight costs and its controlled oxidation fits precision programs. Micronized and pastilled innovations shorten oxidation lag, extending applicability to short-season crops. Split-application strategies combine sulfate for early growth and elemental sulfur for sustained release, underscoring complementary rather than zero-sum demand within the sulfur fertilizers market.
The elemental trend plays into the wider adoption of variable-rate applicators and remote-sensing maps, which rely on higher nutrient density to limit field passes. As sulfur-coated urea and sulfur-bentonite enter mainstream blends, producers that can guarantee uniform particle size and predictable oxidation stand to gain share.


By Form:
Solid Foundation with Liquid InnovationSolid products retained a 69.25% share in 2025, backed by efficient storage and compatibility with conventional spreaders across broad acres. Granulated and prilled formats dominate cooperative blending plants where throughput and shelf life matter. Yet liquid sulfur is advancing at a 6.95% CAGR on the strength of fertigation and foliar programs in high-value horticulture.
Ammonium thiosulfate (12-0-0-26S) typifies liquid momentum, allowing tank mixing with nitrogen solutions and pesticides for single-pass efficiency. Growers appreciate the uniformity in micro-irrigation as well as quicker plant uptake during critical reproductive stages. Vendors are building regional terminals to shorten hauls, which should reduce delivered cost gaps versus solids and widen addressable acreage across the sulfur fertilizers market.
By Mode of Application:
Soil Application Leads Precision RevolutionSoil incorporation generated 59.40% of 2025 demand because it treats underlying deficits and synchronizes with common tillage passes. Broadcasting remains king in cereal systems, although strip-till and banding rise where equipment fleets support precise placement. Fertigation captures a quarter of use, reflecting drip-line expansion in arid zones.
Controlled-release granules are the fastest-growing application approach, climbing at 7.62% CAGR as polymer coatings modulate nutrient loss and extend feeding windows. GPS-guided spreaders layer sulfur at variable rates tied to remote-sensed biomass indices, cutting overlaps, and runoff. Integrated decision-support tools further reinforce the efficiency case, deepening penetration within the sulfur fertilizers market.
By Distribution Channel:
Retail Networks Navigate Digital DisruptionTraditional retail dealers held a 44.30% share in 2025 through agronomic advice and local inventory. Direct-to-farm bulk contracts serve the largest growers and secure a 30.55% share. Cooperatives maintained 20.05% on the strength of member rebates and regional storage.
E-commerce, although just 5.10% today, is the fastest-growing route at 8.72% CAGR, as online platforms bring transparent pricing and integrated logistics. Digital storefronts increasingly tie into soil-test databases and weather feeds to recommend tailored sulfur blends, a feature likely to accelerate product turnover and expand the sulfur fertilizers market size for specialized formulations.
By Crop Type:
Oilseeds Drive Protein AgricultureOilseeds and pulses absorbed 39.55% of the worldwide sulfur tonnage in 2025 because sulfur underpins oil quality and protein synthesis. Canola responds visibly to sulfur top-dress, with yield lifts averaging 8-15% where deficiencies emerge. Wheat, rice, and maize still represent considerable volume, but cereals’ growth pace lags as acreage stabilizes in many bread-basket regions.
Fruits and vegetables, the fastest-expanding crop segment at 6.42% CAGR, profit from sulfur’s role in flavor compounds, shelf life, and antioxidant profiles. Specialty growers are quick adopters of foliar sulfur and drip-injection routines, aided by premium returns that justify higher per-acre inputs. Turf and ornamentals remain steady niche outlets within the sulfur fertilizers industry, where sulfur assists in color, density, and pH correction.
Geography Analysis
APAC Sulfur Fertilizer Market
Asia-Pacific led the sulfur fertilizers market with a 36.55% share in 2025. China’s fertilizer intensity remains above global norms, and efforts to curb excess nitrogen spur the adoption of balanced NPK-S regimens that sustain yields while reducing losses. India’s shift toward precision spreaders and state subsidies for soil health cards pushes sulfur deeper into standard practice. Southeast Asian nations are raising demand through palm oil estates and double-cropped rice, whereas developed economies such as Japan seek ultra-low chloride options for high-value produce. Regional growth of 5.35% CAGR through 2031 is anchored by policy alignment with climate-smart agriculture goals.
Africa Sulfur Fertilizer Market
Africa is the fastest-growing region at 6.15% CAGR. Soil surveys indicate sulfur scarcity in many sub-Saharan zones, and governments now couple fertilizer subsidies with extension services that promote balanced nutrition. Ethiopia’s domestic complex under construction post-GERD will cut import reliance, while South Africa’s commercial farms already leverage elemental sulfur blends to manage alkaline soils. Distribution challenges persist, yet donor-backed corridor projects and private blending hubs aim to improve last-mile reach, brightening prospects for the sulfur fertilizers market.
North America and Europe Sulfur Fertilizer Market
North America posts a steady 3.94% CAGR as the United States channels 8.2 million metric tons of recovered sulfur each year from refineries into phosphate and ammonium sulfate production. Recent tariffs on Canadian sulfur inject short-term tightness, but abundant domestic gas and refinery networks anchor supply. Precision agronomy, cover-crop adoption, and sustainability certifications fuel incremental demand. Europe, at 3.07% CAGR, balances stringent water-quality directives with the need to uphold crop protein levels, making controlled-release sulfur variants attractive.

Regulatory Landscape
Sulfur fertilizer regulation focuses on product composition disclosure, labeling, and standardized analytical verification at the point of sale. In the United States, state fertilizer programs (for example, Colorado Department of Agriculture rules under 8 CCR 1202-4 and Florida Rule 5E-1.024) require validated lab methods such as AOAC Official Method 980.02 to substantiate sulfur guarantees, while California maintains its own fertilizer law and regulations that govern product registration, inspection, and enforcement.
Trade and supply policy has also become a swing factor for sulfur-based inputs. In March 2026, the Russian Federation extended a temporary ban on industrial sulfur exports through June 30, 2026, aimed at stabilizing domestic raw material availability for fertilizer production. In May 2026, the EU adopted Council Regulation (EU) 2026/1181 to suspend Common Customs Tariff duties for selected fertilizer inputs and certain nitrogen-based fertilizers to diversify sourcing. In July 2026, the USDA opened the FY 2026 Fertilizer Investment and Expansion for Long-term Domestic Supply (FIELDS) program, supporting investments that include sulfur-related fertilizer manufacturing capacity.
Competitive Landscape
The sulfur fertilizers market is moderately concentrated, with the top five suppliers capturing 51% of 2024 revenue. Nutrien leads at 14%, leveraging integrated potash, nitrogen, and sulfur assets together with the world’s largest agricultural retail chain. Yara International follows at 12% through its sulfuric-acid backbone and specialty fertilizer branding. Mosaic commands 10%, supported by captive sulfur in its phosphate complexes.
Corporate strategy pivots on sustainability and digital agronomy. Low-carbon ammonia pilots and Yara’s Green Fertilizer roadmap address buyers seeking reduced scope-three emissions. Controlled-release launches are common, with Tiger-Sul expanding sulfur-bentonite capacity and Tessenderlo Kerley scaling liquid thiosulfates.
Supply resilience efforts are equally prominent. CF Industries inked a low-carbon ammonia joint venture slated for 2029 start-up, securing feedstock optionality. K plus S raised USD 540 million in five-year notes during 2024 to fund South America expansion. CHS invested in river-terminal throughput to de-bottleneck Mississippi flows, reminding us that logistics, as much as chemistry, shapes a competitive edge in the sulfur fertilizers market.
Sulfur Fertilizer Industry Leaders
Nutrien Ltd.
Yara International ASA
The Mosaic Company
CF Industries Holdings Inc.
K+S AG
- *Disclaimer: Major Players sorted in no particular order
Sulfur Fertilizer Market Companies Covered in this Report
- Nutrien Ltd.
- Yara International ASA
- The Mosaic Company
- K+S AG
- Israel Chemicals Ltd.
- Haifa Chemicals Ltd.
- Nufarm Limited
- Koch Industries Inc.
- CF Industries Holdings Inc.
- OCP S.A.
- BASF SE
- Sinochem Holdings Corp. Ltd.
- Saudi Arabian Fertilizer Company (SAFCO) (Saudi Basic Industries Corporation (SABIC))
- Tiger-Sul Products LLC (Tessenderlo Group)
- TogliattiAzot PJSC (Uralchem Group)

Market Opportunities and Future Outlook
Supply-security actions and onshore capability upgrades are creating room for sulfur fertilizer producers to secure feedstocks and broaden product formats. In India, Coromandel International started trial production in March 2026 at new sulfuric acid and phosphoric acid plants in Kakinada (2,000 t/day sulfuric acid and 650 t/day phosphoric acid). This backward-integration example supports more reliable sulfate fertilizer and sulfur-bearing blend output for a large domestic market, where precision fertilization programs continue to expand.
Differentiation is also shifting toward technology-led improvements as suppliers seek to reduce oxidation lag (elemental) and improve nutrient efficiency (coated/controlled release), while sulfur availability tightens at times. In Canada, Sultech Global Innovation Corp announced plans in July 2026 with Canlin Energy for an Alberta facility designed to produce 50,000 tonnes per year of micronised sulfur, supported by a grant from Emissions Reduction Alberta. The initiative targets higher-value sulfur forms beyond commodity sulfate salts, while recent operational interruptions linked to sulfur shortages (for example, Mosaic actions in Brazil tied to sulfur availability) are pushing buyers and blenders toward diversified sourcing, more resilient logistics, and product mixes that combine readily available sulfate fertilizers with improved elemental sulfur formats for specific crop timing and application systems.
Recent Industry Developments in Sulfur Fertilizer Market
- July 2026: Yara International ASA acquired the Gulf Coast Ammonia production facility in Texas City, Texas from GCA Holdings LLC for USD 1.3 billion, adding 1.3 million tonnes of annual ammonia capacity. The acquisition strengthens Yara's North American production footprint and improves integration options for sulfur-containing nitrogen fertilizers and specialty blends sold through its regional channels.
- May 2026: The Mosaic Company withdrew its 2026 phosphate production guidance (previously at least 7 million tonnes) amid ongoing input supply constraints. The decision highlighted raw-material sensitivity across integrated fertilizer chains, where sulfur availability affects acid and downstream fertilizer output planning.
- September 2024: Haifa Group and Deepak Fertilizers signed a long-term collaboration to scale advanced sulfur-containing plant-nutrition solutions across India and build localized blending capability. The partnership supports portfolio expansion in a market where balanced nutrient programs are driving wider adoption of sulfur-bearing fertilizers across crop segments.


Sulfur Fertilizer Market Report Scope and Research Methodology
Market Definition and Coverage
For this study, the sulfur fertilizer market is defined as the value of agricultural fertilizer products where sulfur is intentionally supplied as a plant nutrient, across major crop systems and common application methods.
Scope exclusions: Industrial sulfur uses (such as chemical processing inputs) and sulfur that appears only as an incidental nutrient in general NPK blends are excluded.
Segments Covered in This Report
- By Type
- Sulfate Fertilizers
- Ammonium Sulfate
- Potassium Sulfate
- Calcium Sulfate (Gypsum)
- Single Superphosphate
- Elemental Sulfur
- Micronized Sulfur
- Prilled/Pastilled Sulfur
- Sulfate of Micronutrients
- Zinc Sulfate
- Magnesium Sulfate
- Others
- Others (Sulfur-coated Urea, Sulfur Bentonite)
- Sulfate Fertilizers
- By Form
- Solid
- Liquid
- By Mode of Application
- Soil Application
- Fertigation
- Foliar Spray
- Controlled-Release/Coated Granules
- By Crop Type
- Cereals and Grains
- Oilseeds and Pulses
- Fruits and Vegetables
- Turf and Ornamentals
- Others
- By Distribution Channel
- Direct-to-Farm
- Retail Dealers
- Cooperatives
- Online Platforms
- By Geography
- North America
- United States
- Canada
- Mexico
- Rest of North America
- Europe
- Germany
- United Kingdom
- France
- Russia
- Spain
- Rest of Europe
- Asia-Pacific
- China
- Japan
- India
- South Korea
- Rest of Asia-Pacific
- South America
- Brazil
- Argentina
- Rest of South America
- Middle East
- Saudi Arabia
- United Arab Emirates
- Rest of Middle East
- Africa
- South Africa
- Egypt
- Rest of Africa
- North America
Data Sources, Market Sizing, and Validation
Desk Research
We start by building a clean fact base on sulfur deficiency drivers, planted area patterns, and fertilizer use practices that explain where sulfur nutrition is actively managed. Public sources are used to keep inputs traceable, such as FAOSTAT for crop area and production, USDA and Economic Research Service publications for fertilizer use context, fertilizer and agronomy statistics from the International Fertilizer Association and similar associations, and national agriculture ministries and statistics offices for country notes.
To connect demand with supply, trade and production signals are reviewed through sources such as UN Comtrade, customs statistics portals, and technical publications and peer reviewed journals that discuss sulfur uptake and sulfate versus elemental performance. We also scan company filings, investor presentations, and credible press releases to understand capacity changes, product positioning, and pricing direction. Where useful, we lean on paid subscriptions for company financials and intelligence, import and export shipment databases, and patent databases to cross-check product activity and commercialization timing. The desk sources listed here are illustrative, and many other public references were also used for data collection, validation, and clarification.
Primary Interviews and Surveys
Next, we validate key assumptions through expert interviews and structured surveys with manufacturers, distributors, agronomists, and large farm operators, so the model reflects real purchase behavior and not just theoretical nutrient needs. For a global market like sulfur fertilizers, we ensure coverage across major consuming regions. The interviews are used to confirm typical application rates, switching triggers between sulfate and elemental forms, and realistic price bands by country and crop.
Distribution of primary research fieldwork respondents
| Company type | Respondent position | Region |
|---|---|---|
| Top tier: 36% | CXOs: 14% | APAC: 43% |
| Mid tier: 49% | Functional/Unit leaders: 38% | EMEA: 36% |
| Smaller Players: 15% | Managers: 48% | Americas: 21% |
Market-Sizing & Forecasting
Sizing is built using a top-down demand pool reconstruction, where crop area by region is mapped to nutrient removal and likely sulfur-deficient soils, then converted into a realistic treated share based on farmer practices. The value outcome is computed using product form mixes (sulfates, elemental, liquids, and coated products), typical application intensity ranges, and average selling price ladders that reflect grade, concentration, and local blending economics.
To keep the totals honest, we corroborate results with selective bottom-up approximations, including supplier and channel checks on high-volume grades like ammonium sulfate and potassium sulfate, and sampled ASP times volume logic in key importing countries. Inputs that matter in this market include crop mix shifts toward oilseeds and high-value horticulture, sulfur deposition trends that influence deficiency, regional fertilizer affordability and subsidy cues, trade flows for sulfur and sulfate materials, and seasonality around planting windows that impacts in-year purchasing.
For forecasting, we mainly use scenario analysis supported by simple regression checks, where drivers like crop area, fertilizer intensity, and sulfur deficiency prevalence are stress-tested under conservative and more active adoption cases. When a country lacks clear public usage indicators, gaps are handled by using proxy benchmarks from similar agronomy and cropping systems, then adjusted after expert validation.
Data Validation & Update Cycle
Our estimates are checked through triangulation across independent demand signals, trade and production movement, and expert feedback, so no single data series drives the final number. Outliers are flagged through variance checks by region, by product form, and by implied per-hectare spend, then reviewed before sign-off.
The report is refreshed annually, and interim updates are made when material events occur, such as major capacity additions, trade disruptions, or sharp price moves in sulfur and sulfate inputs. Before delivery, a final analyst pass is completed to recheck assumptions and align currency timing, so clients receive the latest updated view.
Mordor Intelligence's Sulfur Fertilizer Market Estimate Compared With Other Published Estimates
Published market sizes for sulfur fertilizers often vary because each publisher draws the product boundary and pricing basis a bit differently, and the year used as the starting point also shifts the headline number. Differences also come from how demand is linked to crop area, soil sulfur deficiency signals, and the mix between sulfate salts and elemental or liquid forms.
Gypsum that is sold mainly as a soil conditioner sits outside Mordor Intelligence's scope for this market, which tends to reduce totals versus estimates that fold in broader soil amendment revenue. Other gaps are typically created when a study reports factory-gate values versus channel selling prices, applies aggressive adoption assumptions for sulfur nutrition programs, or uses a slower refresh cadence for prices and crop area baselines, which can matter in years with input cost swings.
Benchmark comparison
| Source | Market Size | Gaps in Research Methodology |
|---|---|---|
| Mordor Intelligence | USD 5.34 B (2026) | |
| Industry Research Publisher A | USD 4.80 B (2025) | Uses an earlier base year and a slower growth view, and it can understate value when price ladders for sulfate grades and specialty sulfur products are not updated to current season pricing. |
| Global Publisher B | USD 4.87 B (2025) | Reports factory-gate values and can differ on what is counted as fertilizer versus broader soil improvement products, which shifts the total even when volume direction is similar. |
Taken together, the spread is mostly explained by scope inclusions around adjacent soil amendment revenue, the pricing point selected in the value chain, and which year anchors the calculation. By tying the market to crop-area driven demand indicators and then cross-checking with trade and supplier signals, we keep the estimate repeatable and easy to reconcile across regions.


Key Questions Answered in the Report
What is the current value of the sulfur fertilizers market?
The sulfur fertilizers market reached USD 5.34 billion in 2026.
Which region leads to global demand?
Asia-Pacific holds the largest share at 36.55% of sales thanks to intensive agriculture in China and India.
Why are elemental sulfur products growing faster than sulfates?
Elemental sulfur offers high nutrient concentration, lower freight cost per unit, and controlled-release properties that fit precision farming.
How do refinery operations influence sulfur fertilizer supply?
Refineries recover more than 60% of elemental sulfur. Shifts in crude throughput or margins directly affect fertilizer feedstock availability.
What technology trends are reshaping sulfur fertilizer use?
Controlled-release coatings and AI-guided precision platforms improve nutrient efficiency and lower environmental losses.
How consolidated is the supplier base?
The top five companies account for 51% of global volume, reflecting moderate concentration with room for regional and niche competitors.
Page last updated on:


 Your data is secure and never sold or shared.


