
Sugar-Free Food and Beverage Market Size and Share
Market Overview
| Study Period | 2022 - 2031 |
|---|---|
| Market Size (2026) | USD 72.98 Billion |
| Market Size (2031) | USD 107.94 Billion |
| Growth Rate (2026 - 2031) | 8.15 % |
| Fastest Growing Market | Asia Pacific |
| Largest Market | North America |
| Market Concentration | Medium |
Major Players *Disclaimer: Major Players sorted in no particular order Image © Mordor Intelligence. Reuse requires attribution under CC BY 4.0. | |
Sugar-Free Food and Beverage Market Analysis by Mordor Intelligence
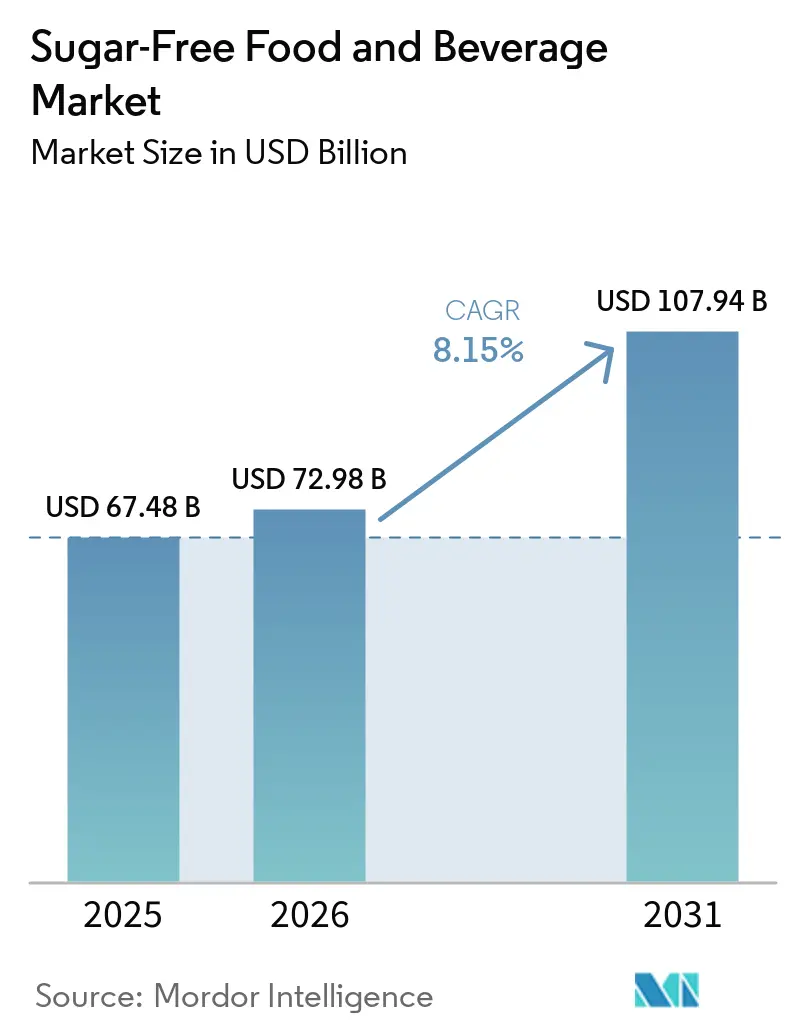
The sugar-free food and beverages market size is expected to grow from USD 67.48 billion in 2025 to USD 72.98 billion in 2026 and is forecast to reach USD 107.94 billion by 2031 at 8.15% CAGR over 2026-2031. Ongoing diabetes escalation, wider adoption of fiscal sugar controls, and continuous ingredient innovation drive this upward trajectory. Beverage reformulations remain vigorous as 54 nations deploy sugar taxes that favor zero-calorie recipes and spur portfolio diversification. Personal nutrition technology[1], especially continuous glucose monitors linked to diet apps, brings new product personalization pathways. Governments also accelerate approvals for natural high-intensity sweeteners, lowering development risks and attracting fresh capital. Meanwhile, retailers enlarge private-label ranges, leveraging trust and aggressive shelf pricing to expand value creation across every demographic pocket.
Key Report Takeaways
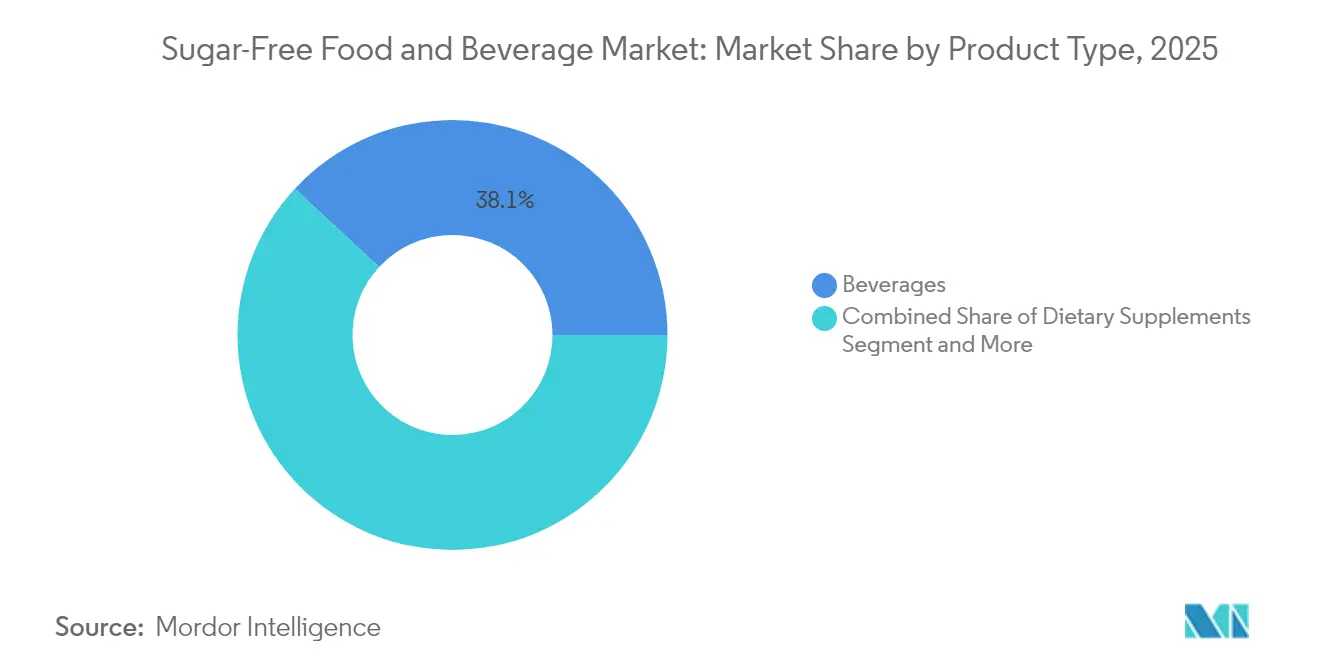
- By product category, beverages held 38.10% of the sugar-free food and beverages market share in 2025; dietary supplements recorded the fastest expansion at a 9.59% CAGR to 2031.
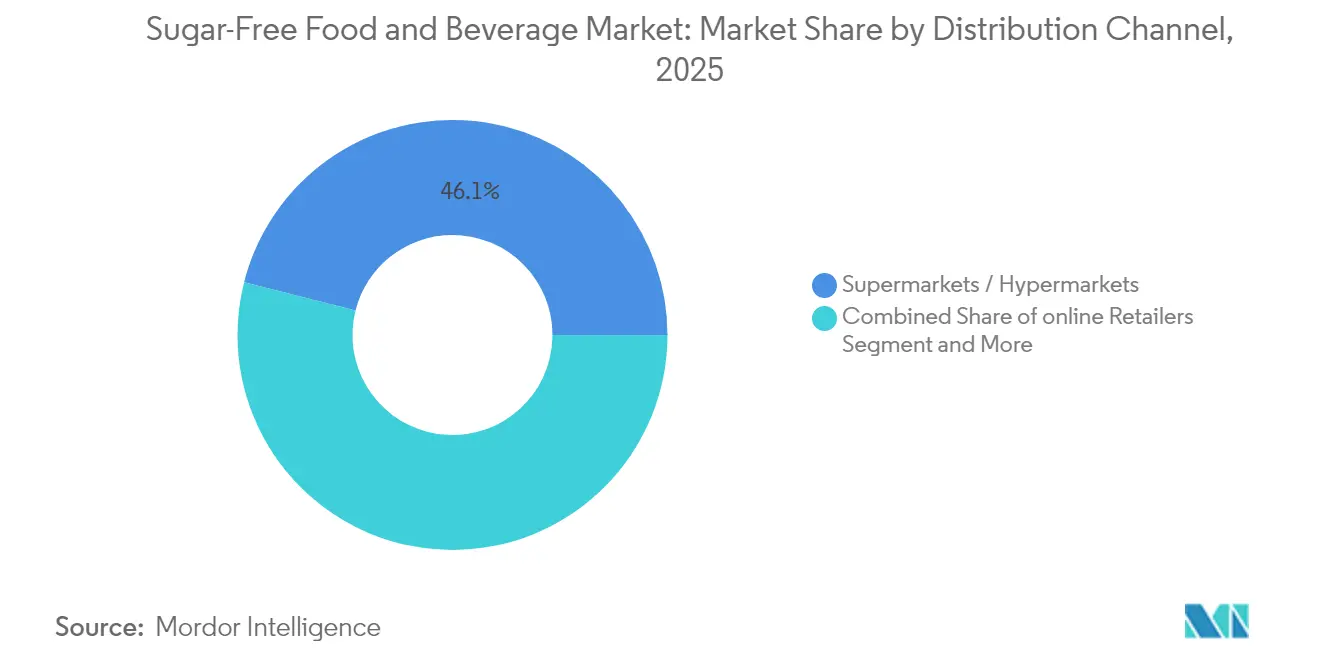
- By distribution channel, supermarkets and hypermarkets captured 46.05% of the sugar-free food and beverages market size in 2025, while online retail advances at an 11.12% CAGR through 2031.
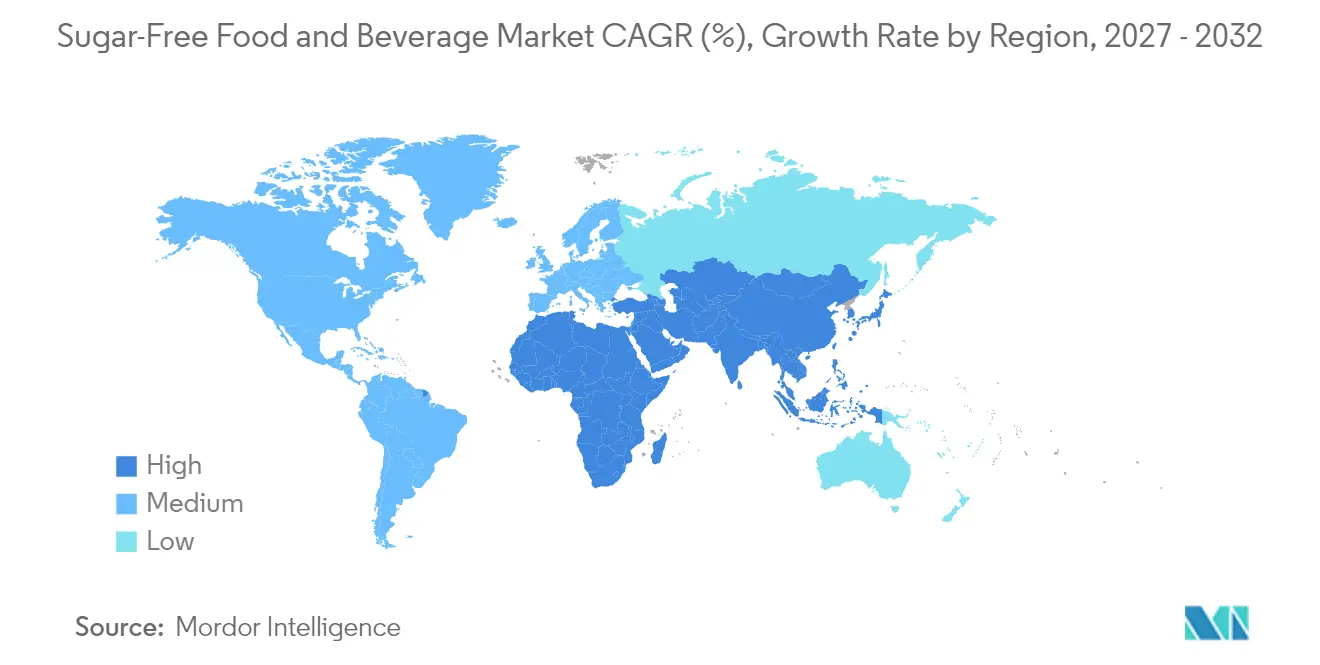
- By geography, North America led with a 32.05% share of the sugar-free food and beverages market size in 2025; Asia-Pacific is advancing at an 8.62% CAGR through 2031.
Note: Market size and forecast figures in this report are generated using Mordor Intelligence’s proprietary estimation framework, updated with the latest available data and insights as of 2026.
Market Trends and Insights
Drivers Impact Analysis of Sugar-Free Food and Beverage Market*
| Driver | % Impact on CAGR Forecast | Geographic Relevance | Impact Timeline |
|---|---|---|---|
| Diabetes & obesity prevalence fuels demand | +2.1% | Global, with highest impact in APAC and North America | Long term (≥ 4 years) |
| Global sugar-tax legislation accelerates reformulations | +1.8% | Global, with 54 countries implementing policies | Medium term (2-4 years) |
| Continuous product innovation in natural high-intensity sweeteners | +1.3% | North America & EU leading, expanding to APAC | Medium term (2-4 years) |
| Retailer private-label expansion in sugar-free SKUs | +0.9% | North America & Europe primarily | Short term (≤ 2 years) |
| Wearable CGM-driven dietary personalization | +0.7% | North America and developed APAC markets | Long term (≥ 4 years) |
| AI-driven e-commerce merchandising for low-sugar products | +0.5% | Global, concentrated in digitally mature markets | Short term (≤ 2 years) |
| Source: Mordor Intelligence | |||
Diabetes & Obesity Prevalence Fuels Demand
World diabetes cases have quadrupled since 1990 and now exceed 800 million adults, firmly embedding sugar reduction within public health priorities. Population-wide dietary interventions rank high in national action plans as the economic burden of metabolic disorders climbs. In the Asia-Pacific region, forward projections indicate 1.31 billion diabetes cases by 2050, keeping demand for sugar-free alternatives resilient even during economic cycles. Employers and insurers increasingly subsidize low-sugar meals in cafeterias and wellness programs to mitigate productivity losses. Low- and middle-income economies will host nearly 79% of global obesity by 2035, expanding the target consumer base for accessible formulations[2]. This demographic momentum, combined with a structural shift toward preventive care, guarantees enduring demand across all income brackets.
Global Sugar-Tax Legislation Accelerates Reformulations
Sugar-sweetened beverage levies install a clear financial incentive for manufacturers to reformulate existing recipes rather than pay higher tax rates. The U.K. Soft Drinks Industry Levy triggered a 43.7% reduction in average sugar per liter across taxed beverages, while South Africa’s Health Promotion Levy drove a 29% fall in fizzy drink purchases. Mexico’s decade-old excise tax continues to deliver a 37% volume decline, demonstrating durable public health gains. Yet only seven of 19 MENA economies have adopted similar laws, highlighting untapped legislative white space. As more nations refine levy structures to penalize sugar grams rather than volume alone, reformulation races quicken and multinational firms streamline global ingredient standards to avoid multi-jurisdictional complexity.
Continuous Product Innovation in Natural High-Intensity Sweeteners
Regulatory green lights for novel sweeteners widen formulation toolkits and help brands answer clean-label expectations. Australia and New Zealand approved D-allulose in August 2024, cementing an Oceania staging ground for broader Asia rollouts. The European Food Safety Authority is evaluating monk fruit extract and has already endorsed several new stevia fractions, signaling growing openness to plant-derived sweetness[3]. Enzymatic bioconversion lowers production costs for rebaudioside D and M, improving flavor profiles close to sucrose without bitterness. Lower input expense, combined with scale efficiencies, narrows the historic price premium that limited adoption in mainstream categories.
Retailer Private-Label Expansion in Sugar-Free SKUs
Major supermarket chains deploy dedicated “better-for-you” aisles that spotlight store-brand sugar-free snacks, beverages, and bakery mixes. Private-label margins often eclipse branded lines by 300–400 basis points, encouraging retailers to fund in-house R&D teams and rapid sensory testing pipelines. Consumer trust rises as retailers back quality claims with loyalty-card discounts and digital nutrition scorecards. Quick procurement cycles mean private-label ranges react faster to ingredient breakthroughs, compelling national brands to intensify innovation cadence to preserve shelf presence. This dynamic fosters an iterative race that widens assortment choice, especially among shoppers who seek value without sacrificing perceived health benefits.
Restraints Impact Analysis of Sugar-Free Food and Beverage Market*
| Restraint | % Impact on CAGR Forecast | Geographic Relevance | Impact Timeline |
|---|---|---|---|
| Premium pricing versus sugared counterparts | -1.4% | Global, with highest impact in price-sensitive emerging markets | Medium term (2-4 years) |
| Clean-label backlash against some artificial sweeteners | -0.8% | North America & Europe primarily | Short term (≤ 2 years) |
| Supply volatility of rare plant-based sweeteners | -0.6% | Global, concentrated in natural sweetener segments | Medium term (2-4 years) |
| Sensory "flavor fatigue" limiting repeat purchases | -0.4% | Global, varies by product category | Long term (≥ 4 years) |
| Source: Mordor Intelligence | |||
Premium Pricing Versus Sugared Counterparts
Sugar-free recipes still command 15–30% shelf premiums because alternative sweeteners need specialized processing lines, smaller batch runs, and stringent compliance protocols. Macroeconomic headwinds, especially currency swings in emerging markets, amplify sticker shocks relative to subsidized conventional products. Price-elastic demographic cohorts hesitate to trial sugar-free options when household budgets tighten, stalling penetration in lower middle-income segments. Manufacturers must either scale volumes or co-invest with retail partners in value packs to soften cost barriers.
Clean-Label Backlash Against Some Artificial Sweeteners
Consumer sentiment pivots quickly when viral posts question the safety of specific artificial sweeteners, even when scientific consensus affirms their use. Brands reliant on sucralose or aspartame face periodic sales dips until narrative control is regained through transparent sourcing and third-party validations. The upcoming Dietary Guidelines for Americans 2025 edition will target zero added sugars, which could intensify scrutiny of all non-nutritive sweeteners and pressure reformulation roadmaps. Companies diversify ingredient stacks to hedge against sudden sentiment shifts, raising development costs.
*Our forecasts treat driver/restraint impacts as directional, not additive. The impact forecasts reflect baseline growth, mix effects, and variable interactions.
Sugar-Free Food and Beverage Market Segment Analysis
By Product Type:
Beverages Retain Leadership While Supplements Scale QuicklyBeverages accounted for 38.10% of the sugar-free food and beverages market share in 2025, buoyed by aggressive reformulations triggered by national sugar levies that penalize excess grams rather than total volume. Flagship cola brands extend zero-sugar variants into seasonal flavor drops, sustaining double-digit volume gains that illustrate sustained mass acceptance. Ready-to-drink teas and enhanced waters add incremental shelf presence, leveraging clean-label botanicals and nootropic claims that complement sugar elimination goals. The segment’s robust cold-chain infrastructure and established promotional calendars ease nationwide rollouts, tightening incumbent moats. In 2025, beverages added USD 2.6 billion to overall category value, validating a strategic focus on flavor innovations over entirely new sub-categories.
Dietary supplements recorded the highest 9.59% CAGR through 2031, fueled by clinician endorsements that position sugar-free formulations as adjunct tools for glycemic modulation. Functional powders fortified with chromium, zinc, and plant polyphenols accelerate mainstream uptake among gym-goers aiming for metabolic flexibility. Partnerships with CGM manufacturers enable digital bundle offers that align supplement dosage reminders with glucose alerts. Although volumes remain smaller, average unit prices are triple those of beverages, lifting segment profitability. Rapid soft-gel format adaptations further expand addressable demographics, including elderly consumers seeking easy ingestion solutions. Manufacturers collaborate with medical associations to secure endorsement seals, amplifying credibility and shelf pull.

By Distribution Channel:
Supermarkets Dominate While Online Retail SurgesSupermarkets and hypermarkets controlled 46.05% of the sugar-free food and beverages market size in 2025, capitalizing on expansive end-cap displays and in-store tastings that educate shoppers on flavor parity with sugared counterparts. Dual placement—main aisles and dedicated health sections—maximizes visibility, while loyalty-card analytics feed real-time coupon personalization for sugar-free SKUs. Promotional tie-ins with community health screenings reinforce retailer authority in wellness merchandising. As inflation moderates, shoppers flock back to physical stores for bulk buys, sustaining foot traffic that benefits impulse trial of innovative low-sugar snacks. Yet shelf competition intensifies as private-label ranges proliferate, squeezing secondary brands unless they secure themed gondola deals.
Online retail, advancing at an 11.12% CAGR, thrives on algorithmic cross-selling that aligns sugar-free purchases with self-reported health objectives inside app profiles. Filter tools that isolate “no added sugar” tags compress search friction and boost basket share. Subscription models offering regular shipment of staple items like tabletop sweeteners and meal-replacement shakes elevate lifetime customer value. Seamless mobile payments and same-day delivery in urban zones remove historic barriers for frozen and chilled sugar-free goods, encouraging experimentation beyond ambient categories. Online marketplaces also democratize entry for micro-brands that rely on influencer marketing and limited direct-to-consumer runs, diversifying the overall product landscape.
Geography Analysis
North America and APAC Sugar-Free Food and Beverage Market
In 2025, North America led the sugar-free food and beverages market with a 32.05% share, driven by mature regulatory frameworks, widespread product familiarity, and insurance-supported nutrition counseling that promotes sugar avoidance. Retailers distinctly segment artificial and natural sweetener products, enabling targeted promotions for specific consumer groups. Sustainable packaging initiatives by regional suppliers align with eco-conscious consumer values, justifying premium pricing. Additionally, the U.S.-Mexico-Canada Agreement has simplified labeling for zero-sugar claims, streamlining tri-national logistics. Meanwhile, Asia-Pacific recorded the fastest growth with an 8.62% CAGR projected through 2031. Rising urbanization and middle-class incomes are fueling demand for premium sugar-free products, including confectionery and dairy alternatives. Programs like Singapore’s Nutri-Grade, which links sugar thresholds to colored labels, are encouraging manufacturers to reformulate products for favorable ratings. China’s "Healthy China" plan signals stricter sugar regulations, while localized flavor innovations, such as monk fruit beverages in China and stevia-sweetened yuzu tonics in Japan, enhance cultural relevance and address taste concerns.
EMEA and South America Sugar-Free Food and Beverage Market
Europe maintains steady mid-single-digit growth, supported by EFSA’s stringent approval protocols that build consumer trust in sweetener claims. The region’s push for front-of-pack traffic-light labeling is steering consumers toward healthier, low-sugar options. In South America, sugar taxation is gaining momentum, with Brazil considering a tiered levy inspired by Mexico’s model, which could accelerate reformulations. In the Middle East and Africa, increasing awareness of non-communicable diseases, combined with low taxation coverage, presents an opportunity for policy changes that could boost market value. These regional dynamics collectively highlight the evolving landscape of the global sugar-free food and beverages market.
Regulatory Landscape
Sugar-free claims and reformulation priorities are being shaped by a mix of fiscal tools, labeling expectations, and ingredient approvals across major markets. A key global anchor is the expanding footprint of sugar-sweetened beverage (SSB) taxation, with the market context noting 54 countries deploying sugar taxes that favor lower-sugar or zero-calorie recipes. In parallel, the World Health Organization published its global report on the use of SSB taxes (2025) in January 2026, reinforcing standardized policy approaches and measurement across jurisdictions.
In Europe, the European Food Safety Authority (EFSA) continues to act as a gatekeeper for novel sweeteners and stevia fractions, influencing what can be used in sugar-free formulations and how products are positioned. The UK is also tightening the compliance backdrop for manufacturers: the government has indicated it will publish technical legislation in 2026 tied to reforms of the Soft Drinks Industry Levy, including lowering the sugar threshold to 4.5g per 100 ml with an effective date of 1 January 2028, extending reformulation runways for beverages and adjacent drink categories. Intergovernmental standard setting is also active, with the FAO/WHO Codex Alimentarius Commission adopting new standards at its forty-ninth session in July 2026, supporting longer-term harmonization in definitions and labeling practices that underpin sugar-reduction and sugar-free positioning.
Competitive Landscape
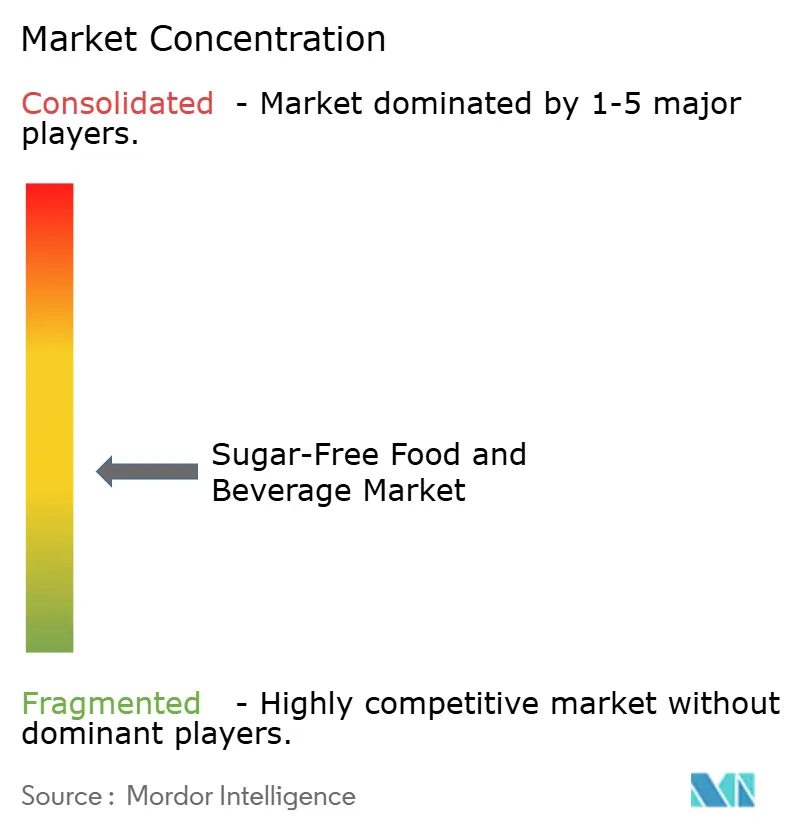
The sector, with a concentration index of 4 out of 10, reflects moderate fragmentation, balancing competition between global leaders and agile challengers. Coca-Cola capitalizes on its distribution network to promote Zero Sugar extensions across sparkling, sports, and mixer lines, supported by a 65% shift to digital advertising targeting health-conscious micro-segments. PepsiCo expands its zero-sugar offerings in key franchises like Mountain Dew and Gatorade, focusing on flavor parity to address trial hesitations. Mars's USD 35.9 billion acquisition of Kellanova highlights a strategic pivot toward healthier snacking, integrating bar and cereal brands with its chocolate portfolio to enhance R&D synergies. Emerging brands, such as Zevia, leverage natural sweeteners and eco-friendly sourcing to attract Millennials and Gen Z, with Zevia surpassing 1.9 billion cans sold using stevia and monk fruit. Private-label brands add pricing pressure but maintain category momentum through high rotation rates and frequent flavor updates. Additionally, Abbott's partnership linking its FreeStyle Libre CGM with Medtronic’s insulin pumps strengthens brand loyalty by connecting medical devices with dietary products.
Rising ingredient regulations are increasing barriers to entry, as novel sweeteners require extensive safety dossiers and multi-year investments, favoring established players with regulatory expertise. However, multinationals are fostering innovation by hosting contests that allow start-ups to pitch functional sweetening technologies, offering opportunities for niche disruptors to scale globally through licensing. These dynamics, combined with the sector's focus on health-driven innovation and technological integration, are shaping the competitive landscape and driving growth across key markets.
Sugar-Free Food and Beverage Industry Leaders
-
The Coca-Cola Company
-
PepsiCo Inc.
-
Nestlé S.A.
-
Mondelēz International Inc.
-
Mars Incorporated
- *Disclaimer: Major Players sorted in no particular order
Sugar-Free Food and Beverage Market Companies Covered in this Report
- The Hershey Company
- Nestle S.A.
- Kellanova
- Mars Incorporated
- PepsiCo Inc.
- The Coca-Cola Company
- The Kraft Heinz Company
- Hostess Brands Inc.
- Mondel?z International Inc.
- Strauss Group Ltd.
- Danone S.A.
- General Mills Inc.
- Abbott Laboratories
- Chobani LLC
- Lakanto (Saraya Co.)
- Unilever plc
- Conagra Brands Inc.
- Tate & Lyle plc
- No Sugar Company Inc.
- Kind LLC
Market Opportunities and Future Outlook
Opportunities are widening where policy-driven sugar reduction intersects with ingredient innovation and scalable manufacturing. Public procurement and institutional channels provide a clear demand lever: the USDA Food and Nutrition Service implemented product-based added sugar limits for school meals at the start of the 2025-26 school year, tightening formulation requirements for categories such as breakfast cereals and yogurt while expanding availability of compliant sugar-free or no-added-sugar alternatives. In the UK, HFSS advertising restrictions that came into force on January 5, 2026 (9pm watershed on broadcast TV and 24-hour online paid-for advertising restrictions) are pushing brand-building toward reformulated portfolios and permissible claims, which reinforces the commercial value of lower-sugar SKUs.
On the supply side, investments in sweetener technology and regional capabilities are creating new platforms for taste parity and cost reduction. ADM announced a USD 26 million expansion at its Erlanger, Kentucky, flavor facility in January 2026 to strengthen reformulation-support capabilities, including added raw material handling capacity, in line with accelerating demand for sugar reduction across beverages, dairy, and snacks. Precision fermentation and sweet-protein pathways are moving into commercial buildout, highlighted by Pentasweet breaking ground in March 2026 on a commercial-scale brazzein production facility in Lithuania and Manus commencing commercial-scale production of fermentation-derived monk fruit sweetener at its Augusta BioFacility in Georgia in July 2026. These moves broaden the ingredient toolkit beyond legacy high-intensity sweeteners, supporting cleaner-label positioning while helping address the market restraint of premium pricing through scale and supply-chain resilience.
Recent Industry Developments in Sugar-Free Food and Beverage Market
- June 2026: Nestle S.A. agreed to acquire the remaining 51% stake in yfood Labs GmbH to reach full ownership of the ready-to-drink meal and powder provider. The acquisition strengthens Nestle's position in convenient nutrition formats where no-added-sugar and reduced-sugar variants are increasingly used to support weight-management and metabolic health needs. Full control also supports faster portfolio decisions and cross-category innovation using Nestle's R&D and distribution scale.
- May 2025: PepsiCo Inc. completed its acquisition of functional soda brand poppi after announcing the definitive agreement earlier in 2025. Bringing poppi in-house gives PepsiCo a scaled platform in better-for-you carbonation that aligns with low-sugar and functional positioning, complementing its existing zero-sugar and reformulated beverage efforts. The acquisition also intensifies competitive pressure in prebiotic and low-sugar soda sets where incumbents and challengers compete for shelf space.
- September 2024: Nestle launched Vital Pursuit in the United States, introducing portioned meals designed for GLP-1 users and outlining expansion into adjacent nutrition occasions including no-added-sugar protein beverages. The launch ties sugar reduction to the fast-growing weight-management ecosystem and supports new merchandising and bundling approaches across retail and e-commerce. It also signals broader innovation focus on products that deliver satiety and macronutrient targets without added sugars.
Sugar-Free Food and Beverage Market Report Scope and Research Methodology
Market Definition and Coverage
For this study, the market covers packaged foods and non-alcoholic beverages that are marketed as sugar-free and are formulated to meet common label thresholds (typically less than 0.5 g sugars per serving), across retail and foodservice channels.
Scope exclusions: Products that are reduced-sugar, no-added-sugar, or regular items with standard sugar content are excluded even if they are positioned as better-for-you.
Segments Covered in This Report
- By Product Type
- Beverages
- Carbonated Soft Drinks
- Functional Drinks
- Juices & RTD Tea / Coffee
- Dairy & Dairy Alternatives
- Milk Drinks
- Yogurt
- Ice Cream
- Confectionery
- Chocolate
- Gum & Mints
- Bakery Products
- Dietary Supplements
- Savory Snacks
- Others
- Beverages
- By Distribution Channel
- Supermarkets / Hypermarkets
- Convenience & Grocery Stores
- Specialty Health and Wellness Stores
- Online Retail
- Others
- By Geography
- North America
- United States
- Canada
- Mexico
- Rest of North America
- Europe
- United Kingdom
- Germany
- France
- Italy
- Spain
- Russia
- Rest of Europe
- Asia-Pacific
- China
- Japan
- India
- Australia
- South-East Asia
- Rest of Asia-Pacific
- South America
- Brazil
- Argentina
- Rest of South America
- Middle East & Africa
- Saudi Arabia
- South Africa
- UAE
- Rest of MEA
- North America
Data Sources, Market Sizing, and Validation
Desk Research
Desk work starts with building the fact base on what qualifies as sugar-free labeling and how the category is reported in official and industry datasets. We typically refer to sources such as the US FDA labeling guidance, USDA food availability and nutrient-related data series, the World Health Organization and CDC sugar and diabetes indicators, and FAO food balance sheets to understand demand drivers and diet shifts.
We also review company annual reports, investor decks, product press releases, and retailer communications to map category moves, pricing posture, and channel momentum. For cross-checking trade flows and ingredient exposure, an import and export shipment-level database and a patent database are used selectively, mainly to validate directionally where innovation and supply links are moving. These examples are not exhaustive, and many other public sources were also consulted for data collection, validation, and research clarification.
Primary Interviews and Surveys
Primary work focuses on validating what desk sources cannot show cleanly, such as how sugar-free claims translate into sell-through, which channels are most responsive, and how price premiums are evolving by category. We speak with manufacturers, ingredient participants, distributors, retailers, and foodservice-linked stakeholders across APAC, EMEA, and the Americas, and we re-check assumptions when responses point to a different adoption curve than published indicators suggest.
Distribution of primary research fieldwork respondents
| Company type | Respondent position | Region |
|---|---|---|
| Top tier: 35% | CXOs: 13% | APAC: 42% |
| Mid tier: 47% | Functional/Unit leaders: 28% | EMEA: 32% |
| Smaller Players: 18% | Managers: 59% | Americas: 26% |
Market-Sizing & Forecasting
Sizing is built by using a top-down approach where packaged food and non-alcoholic beverage consumption, retail sales signals, and category-level penetration are used to reconstruct the sugar-free demand pool by region, and then split into food and beverage buckets using observed mix patterns. Once that shape is set, we corroborate totals using selective bottom-up approximations, including sampled brand and channel price points, typical pack sizes, and volume proxies from category checks, which are then adjusted where gaps show up.
Inputs that matter for this market include the share of consumers actively reducing sugar, diabetes and obesity prevalence trends, sugar tax and labeling enforcement intensity, price premium versus regular equivalents, and distribution momentum across modern trade, pharmacy-led retail, and online. Forecasts are then run using scenario analysis supported by a lighter multivariate view, where changes in health indicators, regulatory pressure, and real price movements are stress-tested with what industry participants expect to hold. When a subcategory lacks reliable public splits, we use conservative bridging assumptions and only expand them after primary feedback supports the step-change.
Data Validation & Update Cycle
Model outputs are checked against independent signals like regional packaged food and beverage growth, observed pricing ranges, and adoption patterns seen in channel discussions. If a country or category shows an outlier jump, we revisit definitions, currency timing, and penetration assumptions, and then re-contact sources when the variance cannot be explained with documented evidence.
Before sign-off, the work goes through multi-step analyst review so that calculation logic, unit consistency, and year alignment are confirmed. Reports are refreshed annually, and interim updates are done when material events occur, such as major labeling changes or large shifts in sugar tax coverage. Right before delivery, we do a fresh pass to ensure the latest public releases and market moves are reflected.
Mordor Intelligence's Sugar Free Food and Beverage Market Size Compared Against Other Published Estimates
Published market sizes for sugar-free food and beverages often differ because each publisher draws the line differently on what qualifies as sugar-free, which channels are counted, and whether the number is tied to products or to ingredients that enable sugar reduction.
The biggest gap drivers in this category are usually the labeling rule applied (for example, strict sugar-free thresholds versus looser no-added-sugar buckets), the treatment of dietary supplements and functional formats, and how pricing is normalized across regions when exchange rates and inflation move. The spread is also influenced by refresh timing and whether the model is anchored to consumer adoption indicators or to broad packaged food totals, and these modeling choices are made explicit in the approach used by Mordor Intelligence.
Benchmark comparison
| Source | Market Size | Gaps in Research Methodology |
|---|---|---|
| Mordor Intelligence | USD 72.98 B (2026) | |
| Industry Publisher A | USD 19.80 B (2024) | Uses a much smaller reported base that likely reflects a narrower definition of sugar-free, fewer included product types, and limited transparency on threshold rules and channel coverage, which can materially compress the addressable value. |
| Industry Publisher B | USD 38.40 B (2025) | Shows mixed figures across the same page and relies on broad segment groupings that may blend sugar-free with adjacent claims, and that can shift the total depending on which edition or scope variant is being referenced. |
Looking across the three figures, most of the variance can be traced to definition discipline, which categories are kept in scope, and how consistently the publisher ties value to observable demand signals. By keeping assumptions tied to clear labeling thresholds, channel reality checks, and repeatable steps, the estimate stays easier to reconcile and update as new data points emerge.
Key Questions Answered in the Report
How large is the sugar-free food and beverages market in 2026?
The category is valued at USD 72.98 billion in 2026 with an 8.15% CAGR outlook to 2031.
Which product segment leads sales?
Beverages hold the top position with 38.10% share of 2025 revenue.
Which region is expanding fastest?
Asia-Pacific posts the highest growth at 8.62% CAGR through 2031 as health policies and incomes rise.
What drives consumer demand for sugar-free products?
Rising diabetes prevalence, sugar taxes, and advances in natural sweeteners sustain demand momentum.
How are retailers supporting market growth?
Supermarkets expand private-label ranges and deploy data-driven promotions, while online platforms personalize recommendations and subscription models.