
Submarine Optical Fiber Cable Market Size and Share
Market Overview
| Study Period | 2020 - 2031 |
|---|---|
| Market Size (2026) | USD 5.89 Billion |
| Market Size (2031) | USD 9.87 Billion |
| Growth Rate (2026 - 2031) | 10.87% CAGR |
| Fastest Growing Market | Asia Pacific |
| Largest Market | North America |
| Market Concentration | Medium |
Major Players *Disclaimer: Major Players sorted in no particular order Image © Mordor Intelligence. Reuse requires attribution under CC BY 4.0. | |
Submarine Optical Fiber Cable Market Analysis by Mordor Intelligence
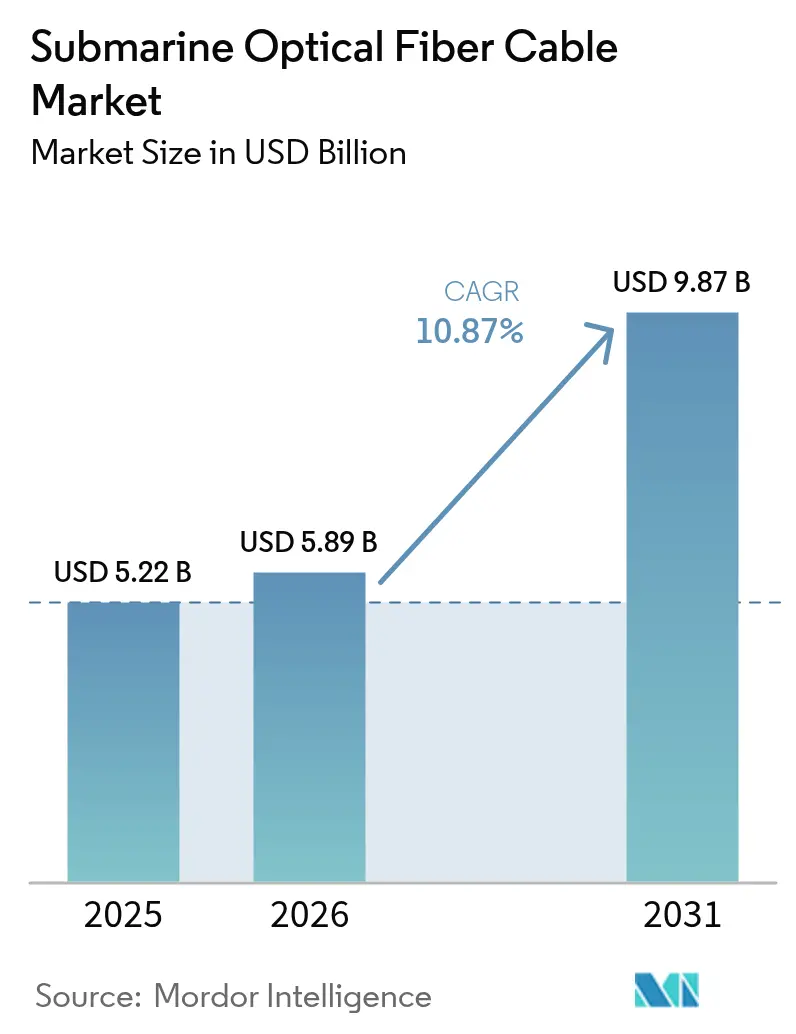
The Submarine Optical Fiber Cable Market size is projected to be USD 5.22 billion in 2025, USD 5.89 billion in 2026, and reach USD 9.87 billion by 2031, growing at a CAGR of 10.87% from 2026 to 2031.
A shift toward privately owned, high-capacity systems is redefining the global connectivity fabric as hyperscale cloud platforms bypass congested carrier-neutral routes, lock in predictable bandwidth costs, and meet the latency requirements of artificial-intelligence applications. Operators are extending cable life through 800 GbE upgrades that raise wavelength rates fourfold while deferring disruptive refurbishments. Demand for rapid-response repair fleets has intensified after a rise in cable-cut incidents, and auxiliary marine services are now expanding faster than hardware sales. Innovation in multi-core and space-division-multiplexing (SDM) fiber points to a long-term capacity roadmap able to support 680 Tbit-s systems demonstrated in 2025
Key Report Takeaways
- By component, wet-plant equipment led with 51.32% revenue share in 2025, while auxiliary and marine services are accelerating at an 11.69% CAGR to 2031.
- By cable type, single-mode fiber accounted for 66.32% of the submarine optical fiber cable market share in 2025, whereas SDM/multi-core architectures are projected to grow at a 11.43% CAGR through 2031.
- By client type, telecom operators accounted for 43.76% of revenue in 2025, yet content and hyperscale cloud providers represent the fastest-growing segment, with an 11.84% CAGR to 2031.
- By capacity design, 16-60 Tbit-s systems commanded 49.19% of the submarine optical fiber cable market share in 2025, while systems rated above 60 Tbit-s are projected to log the fastest growth at an 11.37% CAGR through 2031.
- By geography, Asia-Pacific generated 33.21% of 2025 revenue, while Africa is forecast to advance at a 11.83% CAGR driven by new hyperscale-backed cables.
Note: Market size and forecast figures in this report are generated using Mordor Intelligence’s proprietary estimation framework, updated with the latest available data and insights as of 2026.
Global Submarine Optical Fiber Cable Market Trends and Insights
Drivers Impact Analysis*
| Driver | (~) % Impact on CAGR Forecast | Geographic Relevance | Impact Timeline |
|---|---|---|---|
| Hyperscale Cloud and OTT Investment in Private Cables | +2.8% | North America, Europe, Asia-Pacific | Medium term (2-4 years) |
| Rapid 400 GbE and 800 GbE Upgrade Cycle Among Carriers | +2.3% | Middle East and Asia-Pacific | Short term (≤ 2 years) |
| Growing Smartphone Penetration and Rising Internet Bandwidth Demand | +1.9% | Asia-Pacific, Africa, South America | Long term (≥ 4 years) |
| Increasing Fiber Connectivity in Emerging Regions | +1.6% | Africa, South America, Southeast Asia | Long term (≥ 4 years) |
| Push Toward Low-Latency Trans-polar Routes | +1.2% | Arctic corridors | Medium term (2-4 years) |
| Offshore Wind Farms Adopting Hybrid Power-Data Cables | +0.9% | Europe, Asia-Pacific | Long term (≥ 4 years) |
| Source: Mordor Intelligence | |||


Hyperscale Cloud and OTT Investment in Private Cables
Content platforms now commission the majority of new trans-oceanic systems. Meta’s 2Africa and Waterworth programs together exceed 90,000 km of route length and secure end-to-end ownership, eliminating bandwidth-lease negotiations.[1]Meta Platforms, “Introducing Waterworth, Our Longest Subsea Cable System,” meta.com Google activated the Dhivaru link between Singapore and the Maldives in 2025 to ensure low-latency replication for AI model training. Amazon obtained landing rights in Ireland for a 100 Tbit-s trans-Atlantic route scheduled for 2027. These moves channel multi-billion-dollar capital flows directly to fiber manufacturers, reshaping supplier power dynamics. Telecom groups respond by repositioning as wholesale landlords rather than end-to-end owners.
Rapid 400 GbE and 800 GbE Upgrade Cycle Among Carriers
Coherent pluggable optics let operators quadruple wavelength throughput on legacy cables. Omantel proved the economics in 2025 by lifting each channel to 800 Gbps with Ciena’s WaveLogic 6 and deferring a USD 200 million rip-and-replace project by at least five years.[2]Ciena Corporation, “WaveLogic 6 Powers Omantel 800 Gb s Upgrade,” ciena.com Altibox has already validated 1.6 Tbit-s single-wavelength trials, hinting at commercial adoption before 2028. Adoption of ITU-T G.654.E low-attenuation fiber in 60% of 2025 tenders further extends span lengths, lowering amplifier counts and operating power budgets.
Growing Smartphone Penetration and Rising Internet Bandwidth Demand
Asia-Pacific monthly mobile data usage climbed to 120 exabytes in 2025, driven by 5G rollouts in India and Indonesia, lifting average per-user consumption above 20 GB.[3]GSMA Intelligence, “Mobile Data Traffic Outlook 2026,” gsma.com Video streaming and cloud gaming dominate traffic and rely on subsea fiber for 99% of intercontinental bandwidth. New assets, such as SEA-ME-WE-6, added 126 Tbit-s to India in 2025, yet even with even utilization, it still peaks at 70%. The shift from text to video means demand now grows faster than subscriber numbers, requiring continuous capacity augmentation even in saturated smartphone markets.
Increasing Fiber Connectivity in Emerging Regions
African and South American governments are joining forces to co-finance subsea projects, aiming to sidestep the high costs of satellite backhauls. In 2024, Nigeria's Equiano made its debut, bringing a whopping 144 Tbit/s of capacity and slashing wholesale prices by 40% in just half a year. Meanwhile, Brazil's Seabras-2 route not only reduced latency to Europe but also spurred the establishment of new content-delivery nodes. While multilateral lenders step in to fill funding gaps, especially when commercial returns extend beyond 7 years, the GDP gains from digital-service exports more than make up for it.
Restraints Impact Analysis*
| Restraint | (~) % Impact on CAGR Forecast | Geographic Relevance | Impact Timeline |
|---|---|---|---|
| High Maintenance and Repair-Ship Costs | −1.4% | Global, remote routes | Short term (≤ 2 years) |
| Growing Investment in LEO Satellite Constellations | −1.1% | Rural North America, Africa, island nations | Medium term (2-4 years) |
| Geopolitical Cable-Landing Permit Delays | −0.8% | South China Sea, Red Sea, Baltic Sea | Short term (≤ 2 years) |
| Fiber-Optic Theft and Vandalism in Shallow Waters | −0.5% | Mediterranean, Malacca Strait, West Africa | Medium term (2-4 years) |
| Source: Mordor Intelligence | |||
High Maintenance and Repair-Ship Costs
Deep-water repairs typically range from USD 1 million to 3 million. This cost is influenced by daily vessel charter rates, which hover between USD 0.1 million and 0.3 million, and the unpredictable nature of multi-week weather windows. With only 60 dedicated repair ships available globally, the industry faces significant bottlenecks, especially when multiple vessels encounter faults simultaneously. In 2025, insurers responded to these challenges by increasing premiums by as much as 30% for corridors deemed high-risk. In light of these rising costs and potential downtimes, operators have begun pre-booking standby contracts. While this strategy adds an extra 5-8% to their project budgets, it significantly mitigates the risk of extended downtimes.
Growing Investment in LEO Satellite Constellations
SpaceX’s Starlink exceeded 7,000 satellites by 2025 and delivers 25-50 ms latency, narrowing the performance gap with some subsea paths.[4]SpaceX, “Starlink Network Statistics,” spacex.com Rural consumers, facing the high costs of fiber backhaul, are increasingly turning to satellite broadband, even if each satellite manages only a few tens of gigabits. In response, subsea operators, feeling the pinch of price pressures in these less populated areas, are shifting their focus. They're now emphasizing enterprise-grade Service Level Agreements (SLAs) – a feature that satellites have yet to fully offer.
*Our forecasts treat driver/restraint impacts as directional, not additive. The impact forecasts reflect baseline growth, mix effects, and variable interactions.
Segment Analysis
By Component: Marine Services Gain Share as Protection Needs Rise
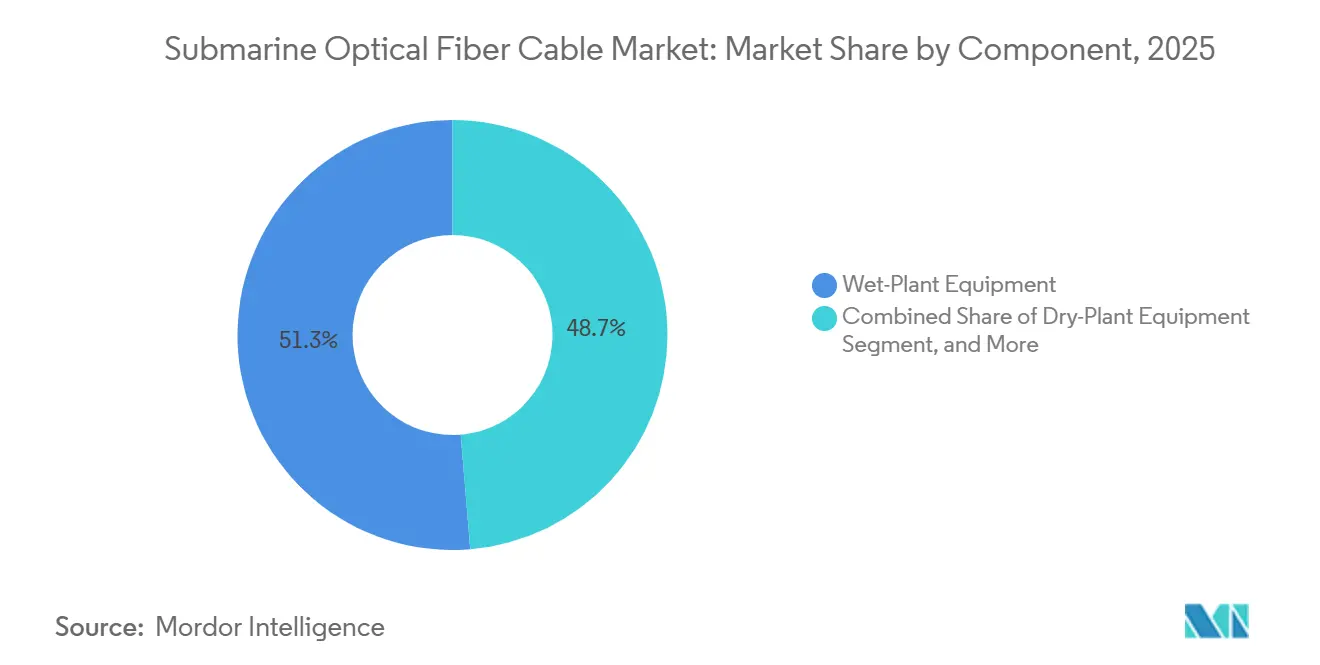
The submarine optical fiber cable market size for wet-plant equipment stood at USD 2.67 billion in 2025, equal to 51.32% of overall revenue, as repeaters and branching units remain the single largest cost block. Yet auxiliary and marine services are growing at 11.69% annually because operators in conflict-prone corridors purchase round-the-clock repair coverage and seabed route audits. That service-centric shift increases recurring revenue and cushions suppliers against the lumpiness of turnkey hardware contracts.
Dry-plant equipment, namely optical line terminals and monitoring platforms, faces commoditization as hyperscalers demand open architectures that disaggregate transport electronics from wet-plant vendors. Smaller niches, including distributed acoustic sensing units that repurpose the fiber itself as a vibration sensor, have emerged after National Grid’s 2024 deployment proved 15% turbine-downtime savings for offshore wind projects. Across components, suppliers diversify into hybrid power-data cables to tap an adjacent USD 500 million addressable pool by 2030.


By Cable Type: SDM and Multi-core Architectures Approach Commercial Readiness
Single-mode designs held 66.32% of 2025 revenue, but multi-core and SDM fiber posted the highest growth at 11.43% as NEC’s 22-core demonstration reached 680 Tbit-s on a single fiber pair. Early deployments remain inside data-center campuses, yet splicing-cost declines to below USD 10,000 per joint, anticipated by 2027, will unlock long-haul adoption. The ITU-T G.654.E low-attenuation specification underpins most new tender documents, enabling amplifier spacing of 400 km and trimming repeater counts by 40% versus legacy G.652.D.
Multimode fiber persists for short offshore-platform hops under 10 km but continues to cede share as single-mode prices fall. Suppliers funnel R&D toward hollow-core variants that promise sub-latency propagation and could complement SDM in the next decade if manufacturing yields stabilize.
By Client Type: Hyperscalers Reshape Demand Patterns
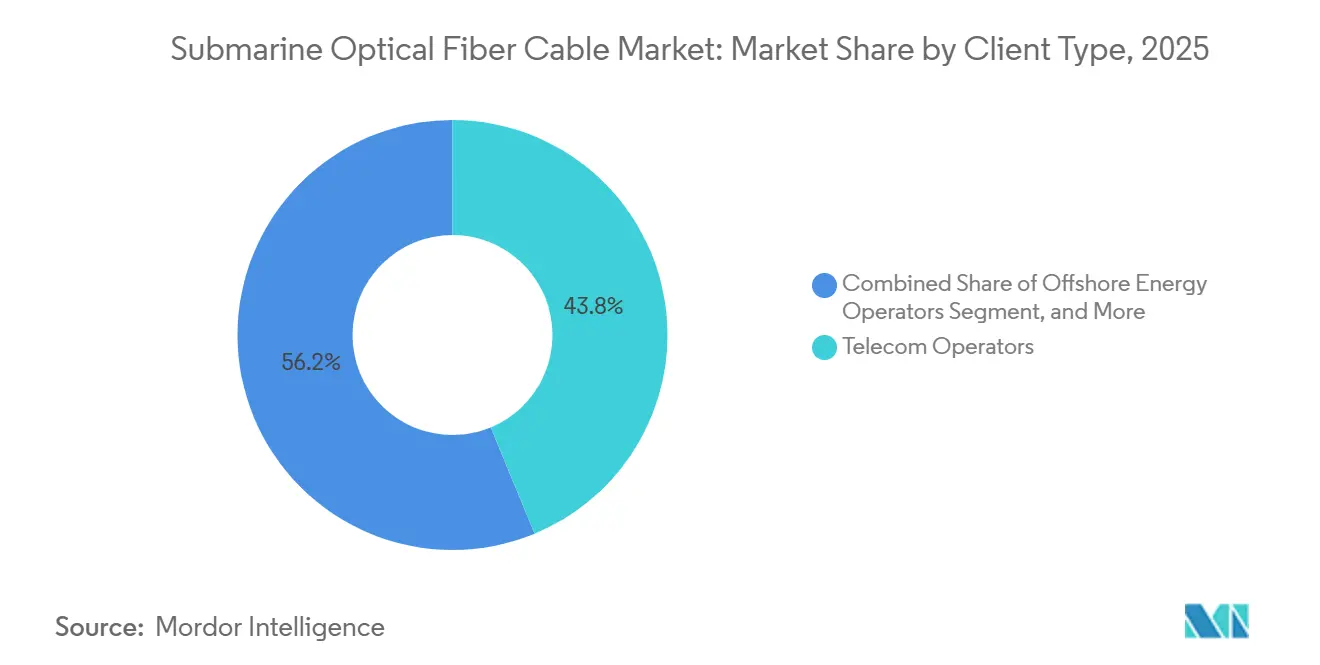
Telecom operators still accounted for 43.76% of 2025 spend, but their share will erode as Meta, Google, Amazon, and Microsoft adopt end-to-end ownership models that bypass wholesale bandwidth markets. Content and cloud providers logged an 11.84% CAGR and already sponsor more than half of announced trans-Pacific projects. Government research networks maintain stable but modest volumes, as exemplified by NORDUnet’s Polar Connect lane, which delivered 10 Tbit/s for Arctic science in 2025.
Offshore energy producers increasingly request custom SLAs that integrate power-cable telemetry. Equinor deployed a 100 Gbps link to its Johan Sverdrup platform in 2024, confirming that real-time reservoir analytics lower personnel exposure and lift uptime. Suppliers now market modular kits that adapt to both hyperscale mega-projects and boutique industrial deployments.
By Capacity Design: Ultra-High Ratings Become Baseline
More than half of new RFPs in 2025 demanded ≥60 Tbit/s systems to future-proof against 8K video, XR collaboration, and AI cluster replication. The submarine optical fiber cable market size for the >60 Tbit-s class is projected to climb at an 11.37% CAGR, while <16 Tbit-s proposals have virtually disappeared from global tenders. Coherent-pluggable progress lets designers meet 60 Tbit-s with only 12 fiber pairs running 800 Gb/s wavelengths, cutting diameter and easing right-of-way congestion.
Because incremental fiber-pair additions during initial lay cost only 10-15% of total capex, CFOs now favor maximum initial capacity to avoid multi-year permitting cycles for mid-life expansion. The practice elevates up-front capital intensity but extends economic lifespan to 20-25 years, aligning depreciation with revenue trajectories.
Geography Analysis
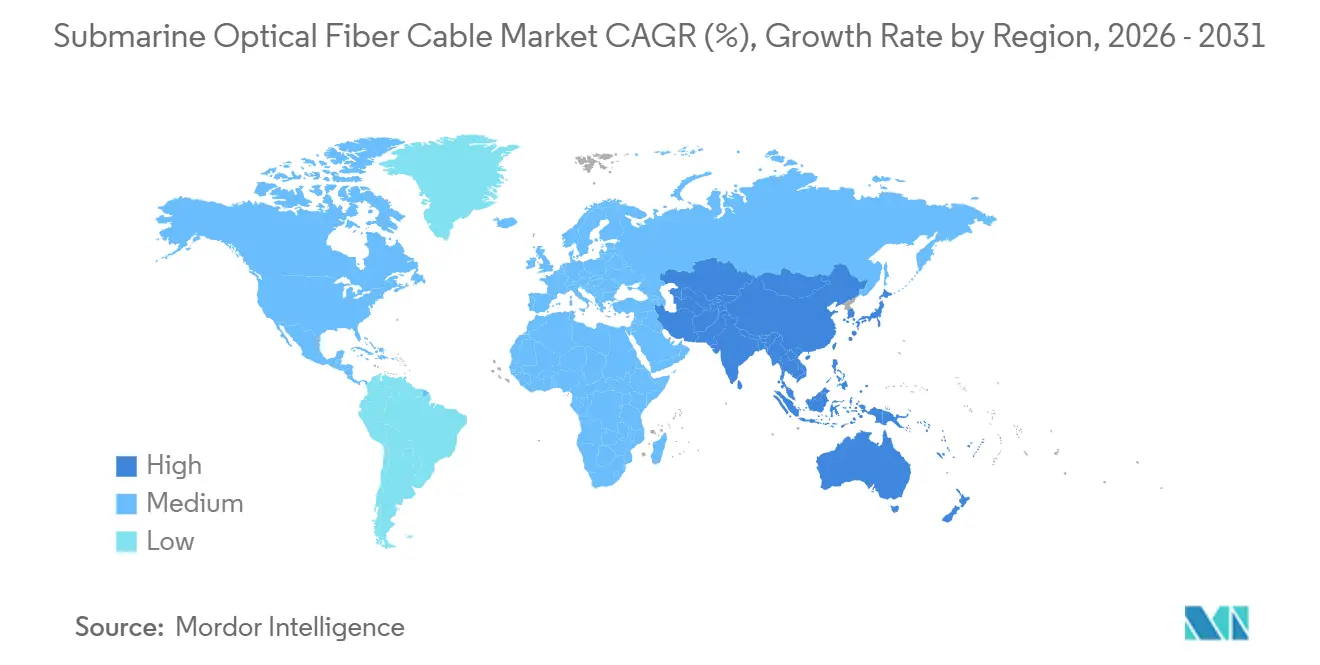
Asia-Pacific led the submarine optical fiber cable market with 33.21% revenue in 2025, driven by the SEA-ME-WE-6’s Mumbai landing and Japan’s USD 300 million JUNO route, which secures disaster-recovery links for Tokyo enterprises. China’s manufacturers remain active but face political headwinds in Australia and the United States, rerouting traffic through Singapore and Hong Kong to comply with national-security screening requirements.
Africa delivers the fastest growth at 11.83% CAGR through 2031. Meta’s 2Africa system now spans the continent with 180 Tbit-s of capacity across 33 landings, slashing wholesale Mbps prices by double digits in Nigeria, Kenya, and South Africa. Lower tariffs stimulate local data-center builds and cloud on-ramp deployments that were impossible under satellite-backed terabit ceilings.
North America sees steady replacement demand as early-2000s cables reach end of life and are upgraded to 800 GbE wavelengths. Europe’s permitting cycle grew longer after Brexit split licensing regimes for cross-Channel landings, while strict EU environmental reviews add 12-18 months to Mediterranean routes. South America diversifies away from its Miami choke point via Brazil-Portugal links such as Seabras-2, creating alternate corridors that lower single-point-failure risk. Middle Eastern traffic remains transit-heavy; operators now deploy Red Sea protection loops to hedge against disruption, and insurers levy higher premiums on Suez passages. Emerging trans-polar routes promise 30% latency cuts between Asia and Europe once Far North Fiber’s 14,000 km link activates in late 2026..

Regulatory Landscape
Regulation for submarine optical fiber cable systems is tightening around national security, supply-chain visibility, and operational resilience, with licensing and ongoing compliance increasingly extending beyond initial landing permissions. In the United States, the FCC advanced a review and update of submarine cable landing license rules and procedures in 2025, and has since emphasized routine conditions covering physical and cybersecurity risk-management expectations, along with operator reporting obligations. This has raised compliance workloads for cable owners, landing-station operators, and SLTE stakeholders.
Internationally, coordination is moving toward common practices that shorten repair and restoration time while protecting routes. The ITU convened the Porto Submarine Cable Resilience Summit in February 2026 to promote cooperation on permitting, maintenance, and repair processes. Industry bodies such as the International Cable Protection Committee (ICPC) also continue to standardize seabed-route survey and protection practices, which feed into how projects are engineered and how nearshore risks (anchoring, fishing, and shallow-water interference) are managed.
Value Chain Analysis
The value chain spans optical fiber and specialty materials, cable manufacture, wet-plant system integration (repeaters, branching units, and undersea system design), marine installation, and dry-plant/SLTE and power-feeding equipment at landing stations. System integration and turnkey delivery remain concentrated among a limited set of suppliers, with established players providing end-to-end wet-plant integration and associated project management for long-haul builds. Component specialists in coherent optics and open line systems increasingly influence dry-plant choices as buyers disaggregate electronics from the wet plant.
Marine operations are a critical bottleneck, shaped by the limited global fleet of specialized cable-laying and repair vessels. Operators have also started pre-booking standby repair coverage after higher incident rates and rising insurance costs. As a result, buyers including hyperscalers and regional consortia are reserving manufacturing slots and vessels earlier in the planning cycle, structuring procurement around long lead items. This is also lifting the role of auxiliary and marine service providers in monitoring, route surveys, and rapid-response repair readiness.
Competitive Landscape
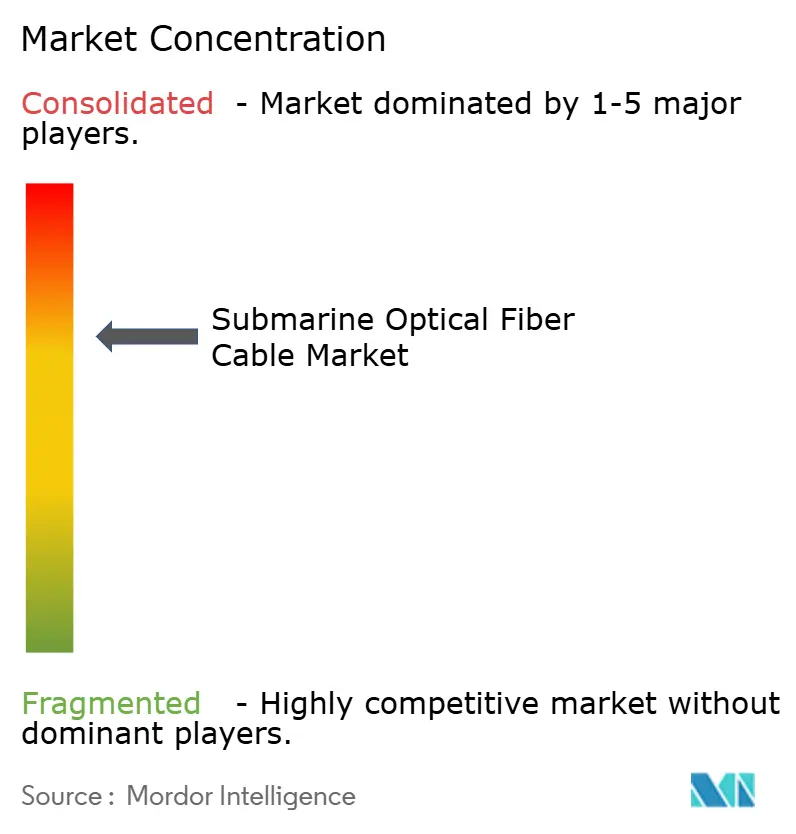
Three vendors, Alcatel Submarine Networks, SubCom, and HMN Technologies, control roughly 60% of global manufacturing capacity, rendering the arena moderately consolidated. Alcatel’s Blue-Raman amplification lengthens repeater spacing to 500 km and trims hardware outlays 15% on ultra-long hauls. SubCom focuses on Arctic-capable vessels and won the USD 500 million Arctic Way contract linking Norway to Alaska in 2027. HMN serves Chinese-financed corridors across the South China Sea and the Indian Ocean but remains constrained by landing permit rejections in several Western markets.
Regional challengers, notably S.B. Submarine Systems in Bangladesh and PT Communication Cable Systems Indonesia, win localized installation jobs through in-country flag-fleets and rapid licensing turnarounds. Global Marine Group and Orange Marine pivot from episodic lay projects to recurring monitoring subscriptions using machine-learning analytics that predict sheath fatigue and anchor-drag threats. Component specialists such as Ciena and Infinera benefit from the open-line-system trend that decouples electronics from wet-plant consortia, allowing carriers to refresh transponders without touching seabed assets.
Patent filings show momentum in hollow-core and multi-core glass, suggesting that material science rather than digital signal processing will unlock the next order-of-magnitude capacity jump. Regulators under the International Cable Protection Committee (ICPC) have standardized seabed-route surveys, compressing differentiation on project engineering and heightening price competition on commoditized segments.
Submarine Optical Fiber Cable Industry Leaders
Alcatel Submarine Networks Ltd
Global Marine Group
HMN Technologies Co., Ltd.
IT International Telecom Inc.
SubCom, LLC
- *Disclaimer: Major Players sorted in no particular order

Market Opportunities and Future Outlook
Whitespace is opening as new private and consortium systems get financed to bypass congested hubs and build more direct corridors between AI and cloud demand centers. In 2026, named initiatives reflected this shift: Datawave Networks entered a binding investment and financing agreement with Cerberus Capital Management affiliates to advance the Singapore-India-Gulf (SING) subsea cable system. In parallel, a Microsoft, Lightstorm, Singtel, and Tata Communications-led consortium announced the 3,600 km I-2SEA cable linking India, Malaysia, and Singapore, with NEC named as the primary system supplier. Together, these projects support demand for high fiber-pair count designs and for supply-chain capacity capable of delivering turnkey builds within longer lead-time realities.
Technology and operations also create near-term room for commercialization around capacity density and lifecycle extension. In March 2026, NTT reported a 192-core multicore submarine cable system, pointing to a pathway for higher throughput per cable footprint. Operators are already extending asset life via 800 GbE upgrades that defer major replacement capex, including Omantel's use of Ciena WaveLogic 6. At the same time, higher incident rates, the rising cost and scarcity of repair ships, and higher insurance premiums increase demand for monitoring, route auditing, and standby repair arrangements. This is supporting growth in auxiliary and marine services as a recurring layer around the installed base.
Recent Industry Developments
- July 2026: A consortium including Microsoft, Lightstorm, Singtel, and Tata Communications announced the 3,600 km I-2SEA submarine cable system connecting India, Malaysia, and Singapore, with NEC named as the primary system supplier. The project targets an additional high-capacity corridor for cloud and AI traffic between South Asia and Southeast Asia, reinforcing demand for new-build wet-plant equipment and early procurement of installation resources.
- March 2026: Alcatel Submarine Networks announced an approximately EUR 100 million investment plan over 2026-2028 to modernize its industrial production facilities in Calais (France) and Greenwich (UK). The capex program strengthens manufacturing readiness for higher-volume, higher-complexity systems, which is material as buyers secure production slots earlier amid longer lead times.
- December 2025: Keppel Infrastructure Fund and a co-investor completed the acquisition of 100% of Global Marine Group. The ownership change consolidates marine services and cable lifecycle capabilities under a broader digital infrastructure platform, supporting scale in installation, monitoring, and repair activities as operators increase spending on resilience and standby coverage.


Research Methodology Framework and Report Scope
Market Definition and Coverage
This market covers the revenue tied to supplying and deploying submarine optical fiber cable systems that carry data through undersea routes. It includes wet plant, dry plant, and supporting marine services that are directly required to deliver the link.
Scope exclusions: It excludes purely terrestrial fiber networks, satellite connectivity, and routine onshore network operations that do not require an undersea cable system.
Segmentation Overview
- By Component
- Wet-Plant Equipment
- Dry-Plant Equipment
- Auxiliary and Marine Services
- Other Components
- By Cable Type
- Single-mode Fiber
- Multimode Fiber
- SDM / Multi-core Fiber
- By Client Type
- Telecom Operators
- Content and Hyperscale Cloud Providers
- Government and Research Networks
- Offshore Energy Operators
- Other Clinet Types
- By Capacity Design
- less than or equal to 16 Tbps Systems
- 16 - 60 Tbps Systems
- above 60 Tbps Systems
- By Geography
- North America
- United States
- Canada
- South America
- Brazil
- Argentina
- Rest of South America
- Europe
- Germany
- France
- United Kingdom
- Rest of Europe
- Asia-Pacific
- China
- India
- Japan
- Australia
- Rest of Asia-Pacific
- Middle East
- Saudi Arabia
- United Arab Emirates
- Turkey
- Rest of Middle East
- Africa
- South Africa
- Egypt
- Nigeria
- Rest of Africa
- North America
Data Sources, Market Sizing, and Validation
Desk Research
Desk work started with building the project and demand context using public sources such as ITU statistics, World Bank and OECD digital indicators, national telecom regulator releases, and cable landing station information published by port or communications authorities. We also reviewed public procurement portals and government connectivity programs to understand which routes were being prioritized and which timelines looked realistic.
To translate activity into a value model, we relied on company annual reports, investor presentations, and press releases that discuss subsea awards, backlogs, and capacity additions. In parallel, we used paid subscriptions for company financials and intelligence, patent databases, and shipment level import and export checks where available for cable and related components. These desk sources are not exhaustive, and many other references were used for data collection, validation, and clarification during the study.
Primary Interviews and Surveys
Primary discussions were used to confirm what is counted as a complete undersea system, and to sanity check pricing logic across cable types, repeaters, and installation scopes. We spoke with a mix of system suppliers, marine service stakeholders, network operators, and procurement and engineering roles across major build regions so the model inputs could be adjusted to match on-the-ground realities.
Distribution of primary research fieldwork respondents
| Company type | Respondent position | Region |
|---|---|---|
| Top tier: 39% | CXOs: 14% | APAC: 48% |
| Mid tier: 47% | Functional/Unit leaders: 42% | EMEA: 31% |
| Smaller Players: 14% | Managers: 44% | Americas: 21% |
Market-Sizing & Forecasting
The market size is built mainly using a top-down approach where global subsea bandwidth demand, new route announcements, and cable system commissioning schedules are used to reconstruct the annual spend pool. The totals are then cross-checked through selective bottom-up approximations, such as sampled project values from public awards, typical system length ranges, and indicative ASPs for wet plant and dry plant content, and then adjusted when the two views disagree.
Inputs tracked in the model include announced and under construction cable systems by route, estimated route length and the repeaters needed, design capacity bands (for example, less than or equal to 16 Tbps, 16 to 60 Tbps, and above 60 Tbps), demand growth proxies like international bandwidth and cloud traffic, and marine installation vessel availability that can shift delivery timing. When data gaps exist for private awards or undisclosed contract values, we use bounded ranges informed by similar route profiles and validate them with interview feedback.
For forecasting, scenario analysis is used because timing slippages are common in subsea projects and can move revenue between years. Assumptions for new builds and upgrades were stress tested using expert views on permitting lead times, supply constraints for key components, and expected refresh cycles for older systems.
Data Validation & Update Cycle
Model outputs are validated using multiple checks, including comparing implied spend per kilometer against known project benchmarks, reviewing capacity additions versus traffic indicators, and testing whether the regional split matches observed build pipelines. Any large variance triggers a re-check of route timing, scope boundaries, and currency conversion assumptions, followed by a second round of confirmation with selected respondents.
Before publication, the work goes through stepwise analyst reviews focused on outliers, year-on-year jumps, and consistency between drivers and results. Reports are refreshed annually, and interim updates are completed when material events occur such as major project cancellations, large new route commitments, or supply chain disruptions. Right before delivery, a final pass is done so clients get the most current view that can be traced back to clear inputs.
Mordor Intelligence's Submarine Optical Fiber Cable Market Size Compared With Other Published Estimates
Published market numbers for submarine optical fiber cables can look far apart because the boundary of what is counted is not always the same, and the year when projects are recognized can also vary. We see gaps most often when studies blend adjacent scopes, use different assumptions for project timing, or apply a price curve that is not anchored to observable deal signals.
Announced cable system pipelines, commissioning timelines, and publicly disclosed award values are the evidence checks that keep the Mordor Intelligence 2026 estimate tied to delivered system scope instead of broader network infrastructure spend. Differences also come from whether marine services are fully included, how upgrades versus new builds are treated, and whether FX rates are locked to an average year rate or a point-in-time conversion, which can shift the USD total.
Benchmark comparison
| Source | Market Size | Gaps in Research Methodology |
|---|---|---|
| Mordor Intelligence | USD 5.89 B (2026) | |
| Global Publisher A | USD 21.69 B (2025) | Uses a much broader spend boundary that appears to include wider telecom infrastructure and related hardware categories beyond undersea system delivery, and it follows a longer horizon where timing is less tied to commissioning schedules. |
| Industry Publisher B | USD 13.19 B (2025) | Likely blends installation methods and end-use spending with cable system revenue, and it may recognize multi-year project value earlier in the cycle rather than allocating revenue to build and delivery periods. |
The table shows that most of the spread is explained by scope boundaries and revenue timing, not by a different view of demand direction. By tying the model to project pipelines, capacity design signals, and realistic delivery constraints, the sizing stays easier to replicate and to audit year to year.


Key Questions Answered in the Report
What is the expected value of the submarine optical fiber cable market in 2031?
It is forecast to reach USD 9.87 billion by 2031, growing at a 10.87% CAGR from 2026.
Which segment shows the fastest growth within the submarine optical fiber cable market?
Auxiliary and marine services, advancing at an 11.69% CAGR as operators prioritize rapid-response repair and seabed-route consulting.
Why are hyperscale cloud companies building their own cables?
Private ownership secures predictable bandwidth, reduces latency for AI workloads, and eliminates recurring lease fees, supporting long-term cost efficiency.
How does SDM / multi-core fiber improve capacity?
By placing multiple cores in a single strand, SDM lifts total throughput ten-fold over current single-mode designs, enabling 680 Tbit-s systems validated by NEC in 2025.
What makes Africa the fastest-growing region for subsea cables?
New systems such as 2Africa and Equiano deliver high-capacity, low-cost bandwidth that stimulates cloud adoption and data-center construction across the continent.
Do LEO satellites threaten the subsea cable business?
Satellites offer useful rural backhaul but lack the terabit-scale capacity of fiber, so they complement rather than replace undersea infrastructure.
Page last updated on:


