
Submarine Cable Systems Market Size and Share
Market Overview
| Study Period | 2020 - 2031 |
|---|---|
| Market Size (2026) | USD 16.37 Billion |
| Market Size (2031) | USD 26.41 Billion |
| Growth Rate (2026 - 2031) | 10.03% CAGR |
| Fastest Growing Market | North America |
| Largest Market | Asia Pacific |
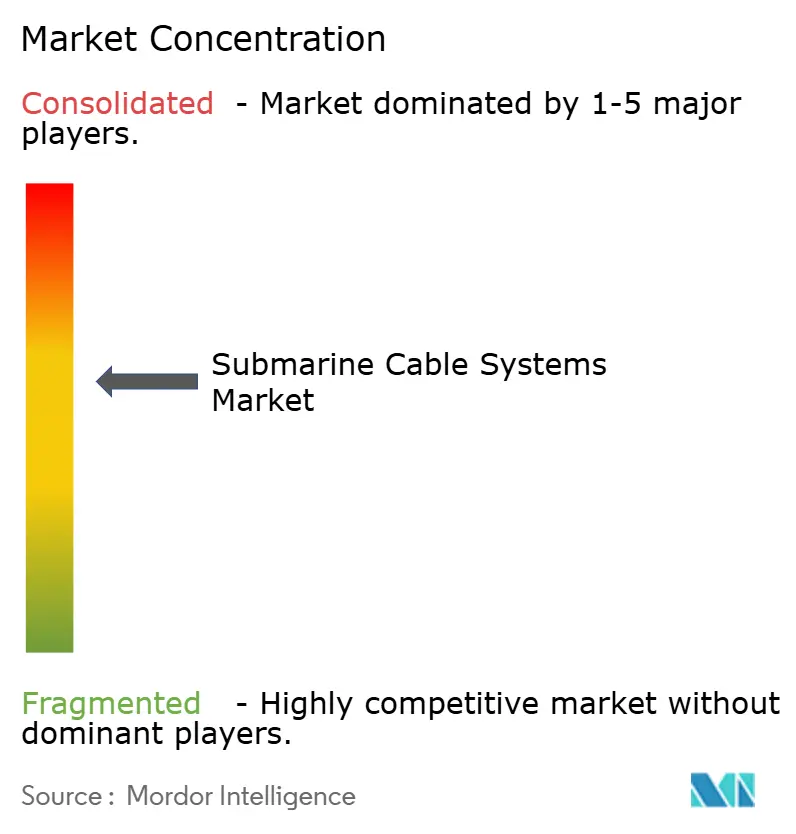
| Market Concentration | Medium |
Major Players *Disclaimer: Major Players sorted in no particular order Image © Mordor Intelligence. Reuse requires attribution under CC BY 4.0. | |
Submarine Cable Systems Market Analysis by Mordor Intelligence
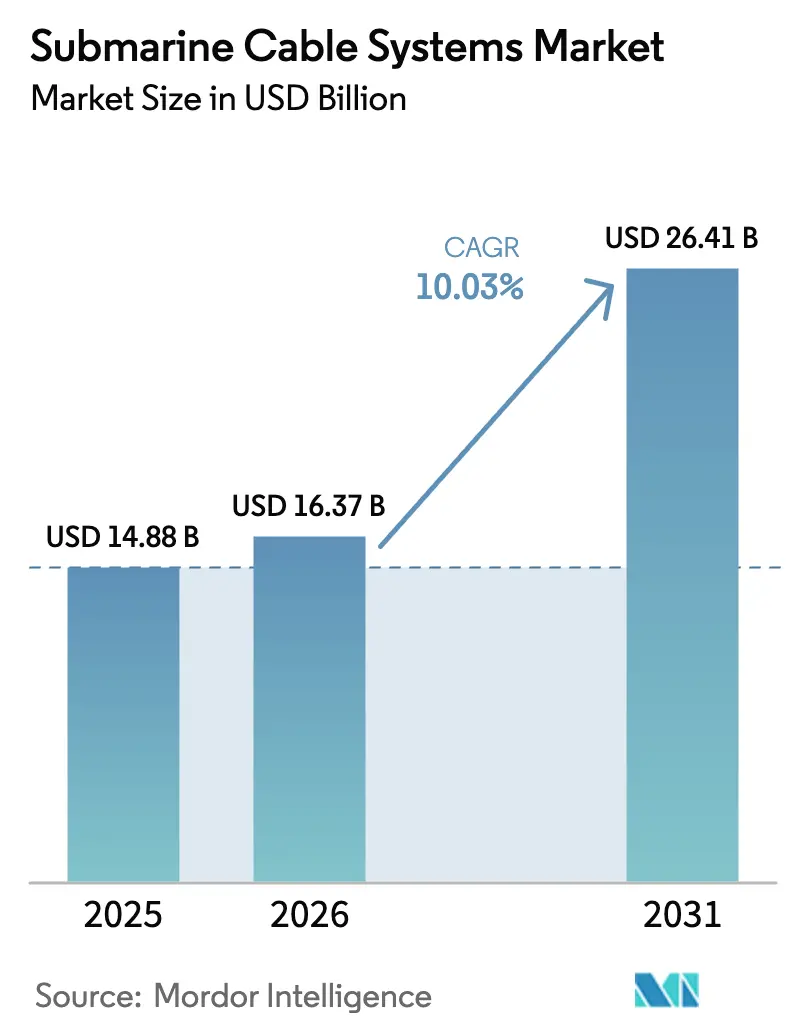
The submarine cable systems market size was valued at USD 14.88 billion in 2025 and estimated to grow from USD 16.37 billion in 2026 to reach USD 26.41 billion by 2031, at a CAGR of 10.03% during the forecast period (2026-2031). Hyperscaler-funded trans-oceanic routes, offshore wind export cables, and governments’ push for resilient digital corridors are the primary drivers of this expansion. Next-generation space-division multiplexing (SDM) architecture lowers cost-per-terabit ratios and supports record fiber-pair counts, while the redeployment of retired cables strengthens redundancy for small island nations. Supply-chain tightness for high-voltage conductors and specialized repeaters remains the chief growth challenge, yet forward contracts from cloud and renewable-energy players continue to de-risk new factory investments. Competitive intensity is building as Chinese vendors scale globally and hyperscalers embrace single-ownership models that compress deployment cycles.
Key Report Takeaways
- By product type, wet-plant equipment led with 67.65% of the submarine cable systems market share in 2025, while dry-plant gear lags amid price commoditization.
- By ownership model, consortium systems held 54.12% of the submarine cable systems market size in 2025, yet single-ownership projects post the fastest 13.32% CAGR through 2031.
- By application, offshore wind export cables accounted for 37.55% of the submarine cable systems market size for power-related links in 2025 and are forecast to expand at a 14.65% CAGR between 2026-2031.
- By Fiber-Pair Count, 9-16 Fiber Paris accounted for 44.85% of the submarine cable systems market size in 2025, yet ≥ 25 FP (SDM) projects post the fastest 18.62% CAGR through 2031.
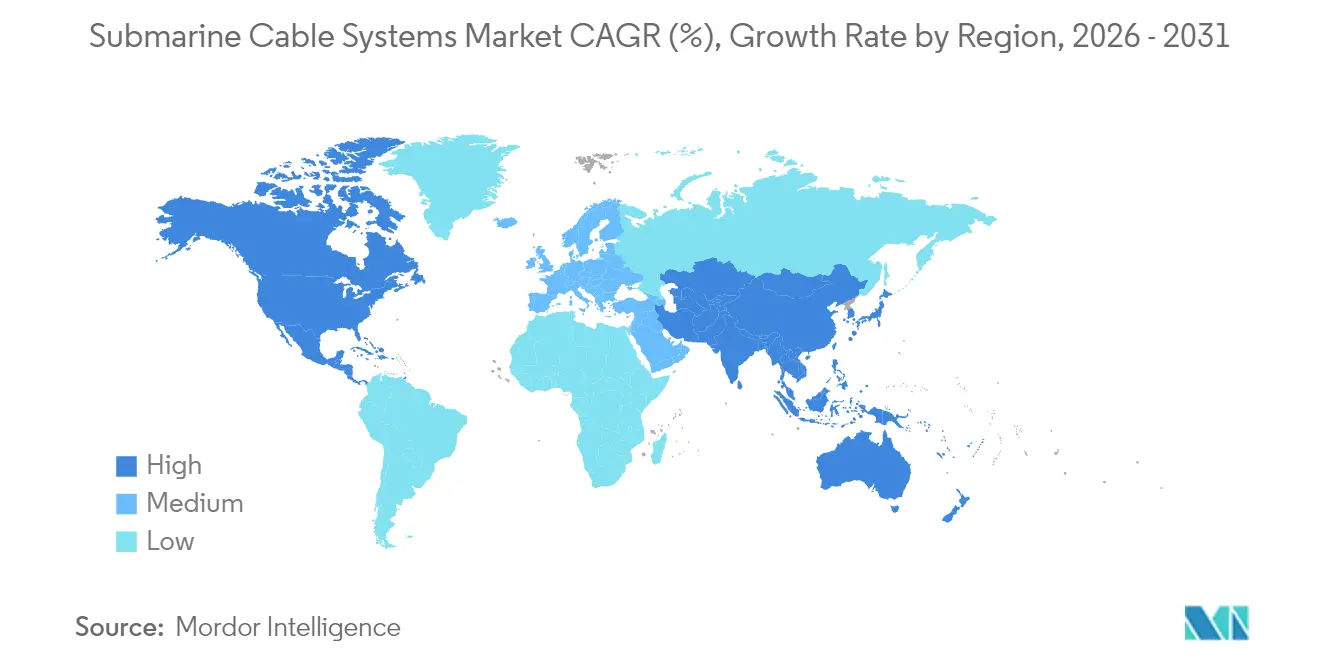
- By geography, North America captured 29.12% revenue share of the submarine cable systems market in 2025; Asia-Pacific is advancing at a 12.45% CAGR through 2031.
Note: Market size and forecast figures in this report are generated using Mordor Intelligence’s proprietary estimation framework, updated with the latest available data and insights as of 2026.
Market Trends and Insights
Drivers Impact Analysis of Submarine Cable Systems Market*
| Driver | (~) % Impact on CAGR Forecast | Geographic Relevance | Impact Timeline |
|---|---|---|---|
| Hyperscaler-led bandwidth demand boom | +2.8% | Global; US–Asia-Pacific corridors | Medium term (2-4 years) |
| Rapid cable construction for emerging region connectivity | +1.9% | Africa, Southeast Asia, Pacific Islands | Long term (≥ 4 years) |
| Offshore wind-farm export-cable surge | +2.1% | Europe, North America, Asian coasts | Medium term (2-4 years) |
| SDM and ≥32-fiber-pair technology lowering $/Tb | +1.5% | Global hyperscaler networks | Long term (≥ 4 years) |
| Redeployment of retired cables to underserved islands | +0.7% | Pacific and Caribbean islands | Short term (≤ 2 years) |
| Green-finance incentives for low-carbon repeaters | +0.9% | Europe, North America | Medium term (2-4 years) |
| Source: Mordor Intelligence | |||
Hyperscaler-led bandwidth demand boom
Capacity requirements for artificial-intelligence workloads and real-time cloud applications have propelled companies such as Google and Meta to self-fund trans-oceanic systems. Google’s Pacific Connect program, featuring the Proa and Taihei cables, exemplifies this shift by adding multi-terabit links across the Pacific without operator consortia. Meta’s Project Waterworth spans 50,000 km over five continents with 24 fiber pairs, underscoring hyperscalers’ preference for control and rapid upgrade paths. These projects accelerate deployment schedules, standardize SDM architectures, and now represent almost half of all new global builds initiated since 2021.
Rapid cable construction for emerging-region connectivity
The digital-infrastructure gap in Africa and Southeast Asia is narrowing as regional operators, development banks, and cloud providers co-finance high-capacity routes. OMS Group’s MIST cable exceeds 216 Tbps and links India, Malaysia, Singapore, and Thailand by 2027[1] OMS Group, “MIST Subsea System Fact Sheet,” omsgroup.com. West-Africa outages in 2024 exposed single-point failures, prompting governments to back redundancy corridors and pay for expedited repair services, thereby lifting long-term demand for additional wet-plant units and marine-installation vessels.
Offshore wind-farm export-cable surge
Europe’s 70 GW German offshore-wind roadmap and the United Kingdom’s Eastern Green Link 2 project are emblematic of how decarbonization targets convert directly into submarine-cable demand. Prysmian secured EUR 5 billion in turnkey contracts that cover 4,400 km of ±525 kV power cables to connect offshore turbines to onshore grids. Similar tendencies in the United States reflect the Inflation Reduction Act’s incentives, positioning high-voltage subsea links as a second profit pillar for cable makers historically focused on telecom traffic.
SDM and ≥32-fiber-pair technology lowering USD /Tb costs
Google’s Dunant system showed the commercial practicality of SDM by transmitting 250 Tbps through 12 fiber pairs, while NEC and NTT demonstrated a 7,280 km run on 12-core multicore fiber, quadrupling capacity without enlarging the cable diameter. Declining cost-per-terabit is enabling single-ownership builds and fostering new data-center interconnect routes that bypass legacy choke points.
Restraints Impact Analysis of Submarine Cable Systems Market*
| Restraint | (~) % Impact on CAGR Forecast | Geographic Relevance | Impact Timeline |
|---|---|---|---|
| Data-sovereignty legislation complicating landing licences | -1.4% | US-China, EU coastal states | Short term (≤ 2 years) |
| Geopolitical vetoes on routes and vendors | -1.8% | Asia-Pacific, European frontiers | Medium term (2-4 years) |
| Long permitting cycles and ESG push-back on near-shore routes | -1.1% | Europe, North America | Medium term (2-4 years) |
| Global fiber and repeater supply-chain crunch | -2.3% | Global hubs | Short term (≤ 2 years) |
| Source: Mordor Intelligence | |||
Data-sovereignty legislation complicates landing licences
Revisions to the United States Federal Communications Commission submarine-line rules now mandate three-year reporting of ownership and security practices, tightening the approval window for new landings. Parallel data-localization statutes in India and Indonesia require in-country traffic termination, forcing architectural redesigns that elevate network complexity and cost.
Global fiber and repeater supply-chain crunch
High-voltage conductor factories and erbium-doped amplifier plants report order books filled through 2027. LS Cable and System’s new Virginia facility, slated for completion in 2026, reflects the multi-year capital cycles needed to add capacity. Component scarcity most severely delays SDM systems with ≥25 fiber pairs, pushing lead times beyond 36 months and tempering near-term revenue growth despite robust demand.
*Our forecasts treat driver/restraint impacts as directional, not additive. The impact forecasts reflect baseline growth, mix effects, and variable interactions.
Submarine Cable Systems Market Segment Analysis
By Type:
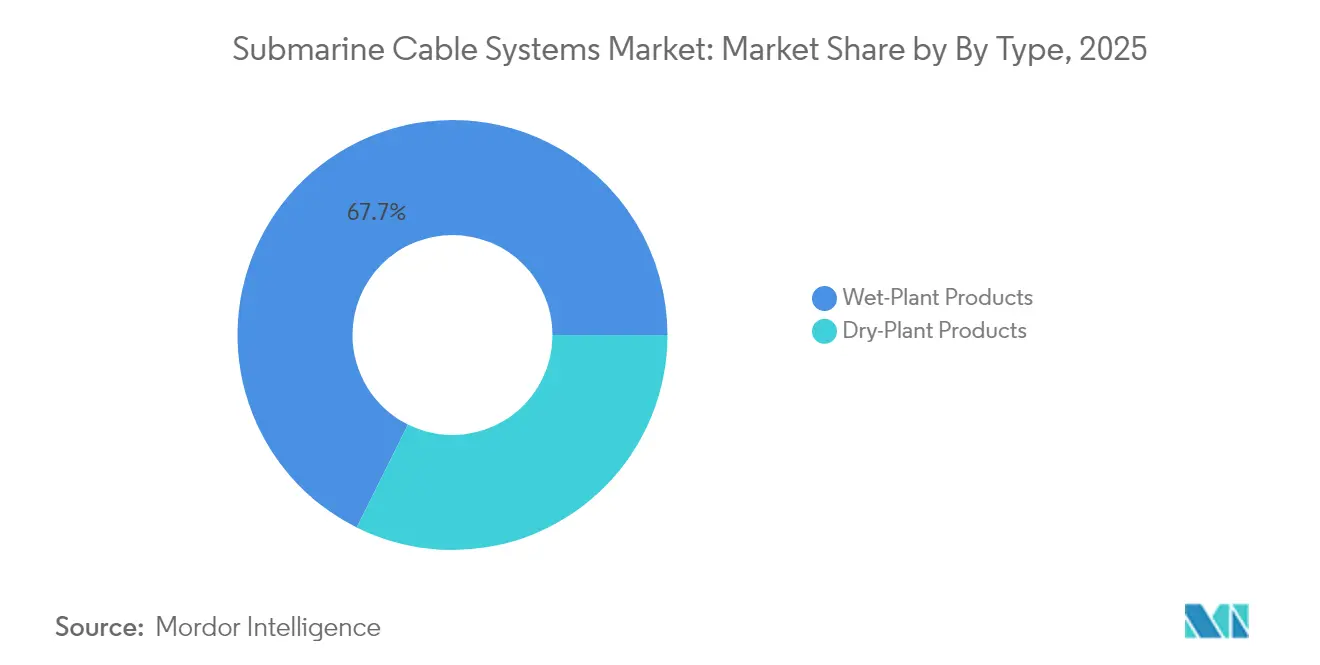
Wet-Plant Dominance Drives Market ValueWet-plant gear—repeaters, branching units, and SDM-ready optical amplifiers—accounted for 67.65% revenue in 2025. This sub-segment is projected to climb at a 10.62% CAGR through 2031 as operators favor ultra-long-haul routes that rely on sophisticated regeneration electronics. The submarine cable systems market size for wet-plant products translates to USD 10.07 billion in 2025 and is on track for USD 18.45 billion by the decade’s close. High engineering barriers shelter incumbents, delivering stable pricing even as component costs rise.
Intelligent wet-plant offerings such as ASN’s SMART cable—with integrated seafloor climate sensors—open new multi-agency funding channels. Dry-plant equipment, covering shore-end terminals and power-feed equipment, captures the balance but endures margin compression as hyperscalers design in-house landing-station hardware. Standardization by the Open Cable initiative further dilutes proprietary advantages in the dry-segment.


By Ownership Type:
Single Ownership Models Reshape Industry StructureConsortium projects remained the largest share contributor at 54.12% in 2025, anchored by traditional carrier collaborations on trans-Atlantic links. Nevertheless, single-ownership ventures are expanding fastest at a 13.32% CAGR, underpinned by cloud-provider CAPEX strategies. The submarine cable systems market size allocated to single-owner builds is estimated at USD 6.83 billion in 2025, climbing to USD 14.46 billion by 2031, a reflection of aggressive self-build roadmaps.
Single-party control accelerates decision cycles and permits bespoke SDM designs with >32 fiber pairs, charting new capacity highs. Development-bank-backed systems, although small in volume, unlock connectivity for price-sensitive African and Pacific Island corridors where commercial returns alone are inadequate and where public-sector de-risking is essential.
By Application:
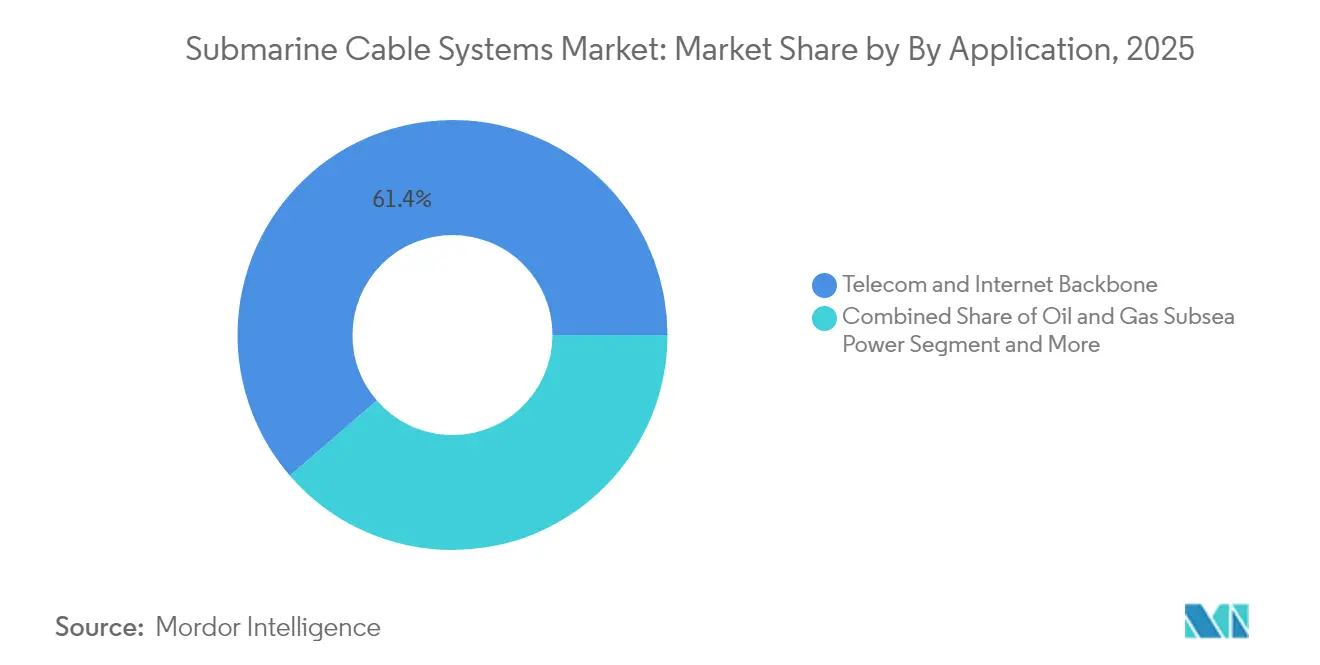
Offshore Wind Cables Lead Growth AccelerationTelecom and internet backbone purposes still dominate, absorbing 61.35% of 2025 spending, but renewable-energy export cables now post the strongest growth. Offshore wind export links are forecast to outstrip classic telecom demand, lifting their share to nearly 20% by 2031. Europe’s corridor of ±525 kV interconnectors exemplifies the pivot in the submarine cable systems market.
Array cables within wind farms increasingly ship with built-in fiber strands for turbine SCADA data, blending power and telecom functionality. Government surveillance and scientific networks, such as the Pacific Tamtam SMART cable, are niche but growing, leveraging blended finance that couples security budgets with climate-research funds.
By Fiber-Pair Count:
SDM Technology Drives Premium-Segment GrowthCables configured with 9-16 pairs held 44.85% of 2025 capacity deployments, meeting most mid-ocean route needs. However, ≥25-pair SDM systems are expanding at 18.62% CAGR, spurred by AI-heavy data-center traffic. The submarine cable systems market share of these premium builds is expected to touch 21.6% by 2031, up from 11.35% in 2025. Constraints arise from limited multicore fiber draw capacity, but multi-year purchase agreements signed by cloud providers are underwriting new pull-towers and coating lines.
Lower pair-count links remain vital for regional hops and redundancy paths where extreme throughput is unnecessary. Suppliers therefore balance line-up breadth, offering both SDM-ready and conventional designs to avoid ceding mid-market territory.
Geography Analysis
North America Submarine Cable Systems Market
North America commanded 29.12% of global revenue in 2025, driven by US-centric hyperscaler activity and the early adoption of SDM architecture. Projects such as Pacific Connect and the 24-pair Bifrost system keep trans-Pacific corridors at the forefront of capacity upgrades. Domestic content rules encourage onshore manufacturing; LS Cable’s Virginia site and Prysmian’s Maryland investment will collectively add more than 25,000 t of annual core-conductor output by 2027.
APAC Submarine Cable Systems Market
Asia-Pacific represents the fastest-growing region with a 12.45% CAGR. China’s contractors delivered over 100,000 km of wet-plant in 2024, chasing a 60% global share target by 2025. India is pivoting into a regional hub through the India-Asia Xpress, while Japan’s alliances with US cloud firms bring landing diversity to Micronesia and Guam. Rising digital-economy indices across ASEAN economies guarantee multi-route demand for at least the next decade.
EMEA and South America Submarine Cable Systems Market
The twin engines of offshore-wind megaprojects and multi-gigawatt energy interconnectors buoy Europe’s market. The Eastern Green Link 2 alone will lay 500 km of 525 kV cable and is expected online in 2029. Middle East and Africa benefit from strategic junction status between continents; Africa’s East2West cable plan secures development-bank finance to reduce single-route exposure. South America remains small yet strategic: Google’s Humboldt cable will offer the first direct South-Pacific link to Asia, reshaping Chile’s connectivity map.

Regulatory Landscape
Submarine cable systems operate under a mix of telecom licensing, coastal and seabed permits, and critical-infrastructure security obligations that vary by landing country. In the United States, the Federal Communications Commission (FCC) adopted a Second Report and Order on June 25, 2026. The update expands submarine cable licensing compliance by extending requirements to owners and operators of Submarine Line Terminal Equipment (SLTE), and it requires certifications tied to cybersecurity and physical security risk management plans. The FCC also defined 10 national security standards that can create a presumption against referral to the executive-branch Team Telecom review process.
In Europe, governance is more fragmented across member states, but EU-level frameworks are raising baseline resilience and security expectations for operators and landing-station ecosystems. NIS2, the Critical Entities Resilience (CER) Directive, and the Cable Security Toolbox are reinforcing obligations around risk management and continuity planning, while national models differ materially. For example, France has pursued a more state-integrated posture versus more private-sector-led approaches in some Nordic markets, which affects landing approvals, vendor scrutiny, and routing choices.
Value Chain Analysis
The value chain starts with optical fiber and conductor inputs, then moves through cable design and manufacturing, wet-plant equipment (repeaters, branching units, amplifiers), marine installation, and lifecycle operations such as maintenance, fault localization, and repair. Wet-plant system integration remains concentrated, with four primary integrators frequently referenced in global delivery capacity: SubCom (USA), Alcatel Submarine Networks (France), HMN Technologies (China), and NEC (Japan). This concentration can translate into long lead times when multi-route build programs overlap.
Marine installation and maintenance act as a major constraint point. Specialized cable-laying vessels are limited (about 60 globally, with an average fleet age around 25 years), and projects require tight coordination between the system supplier and marine contractors. Recent project structures show how these partnerships shape delivery, including the selection of Elettra Tlc for marine operations on the GreenMed system and ASEAN Cableship Pte Ltd supporting I-2SEA, while landing parties and local civil works providers influence schedule risk at shore ends where permitting and corridor access can dominate critical paths.
Competitive Landscape
The submarine cable systems industry features high entry barriers due to deep-sea installation know-how, lengthy type-approval cycles, and capital-intensive wet-plant factories. Alcatel Submarine Networks, NEC Corporation, and SubCom collectively controlled more than 60% of wet-plant revenue in 2024. Alcatel’s recent transfer into French state ownership underscores governments’ heightened interest in safeguarding critical subsea infrastructure.
Chinese challengers HMN Tech and Hengtong Optic-Electric leverage competitive pricing, Belt-and-Road diplomacy, and rapid domestic scaling to penetrate emerging markets. HMN delivered 16,000 km of cable in 2024, including the Pakistan-East Africa route, and reports a pipeline that could double output by 2027. Western incumbents counter through SDM-centric RandD and value-added features such as integrated environmental sensors and predictive analytics for repeater health.
Hyperscaler self-ownership tilts bargaining power. Google and Meta now source cable designs directly, contracting manufacturers on build-to-print terms that compress margins but offer volume certainty. Ancillary ecosystem players—Global Marine, Orange Marine, and NTT’s submarine-maintenance arm—benefit from rising repair call-outs caused by both accidental fishing incidents and deliberate sabotage events.
Submarine Cable Systems Industry Leaders
Alcatel Submarine Networks
NEC Corporation
Prysmian S.p.A.
SubCom, LLC
Hengtong Optic-Electric Co., Ltd.
- *Disclaimer: Major Players sorted in no particular order
Submarine Cable Systems Market Companies Covered in this Report
- Alcatel Submarine Networks SAS
- NEC Corporation
- Prysmian S.p.A. (Submarine Telecom and Power Cables BU)
- SubCom, LLC
- Hengtong Optic-Electric Co., Ltd.
- HMN Tech Co., Ltd. (Huawei Marine)
- Nexans S.A.
- Fujitsu Limited
- NTT Communications Corporation
- Google LLC
- Sumitomo Electric Industries, Ltd.
- Global Marine Systems Limited
- Orange Marine S.A.S.
- JDR Cable Systems Ltd.
- Zhongtian Technology Submarine Cable Co., Ltd.
- BW Digital Pte. Ltd. (Hawaiki)
- Padtec Holding S.A.
- Xtera, Inc.
- Orient Cable (NBO) Co., Ltd.
- Cable and Wireless Marine Service Ltd.

Market Opportunities and Future Outlook
Route diversification and security-driven architecture changes are creating whitespace for new builds that emphasize dual landings, additional branch points, and faster repair readiness, particularly after outage events exposed single-route fragility in emerging regions. Active corridor build-out includes the 3,600 km I-2SEA system linking India, Malaysia, and Singapore (with NEC as supplier), along with landing-readiness work progressing in Japan for Meta-backed Candle system activity. Together, these efforts point to Southeast Asia and North Asia as focal areas for incremental wet-plant demand and landing-station upgrades.
On the power side, offshore wind export projects and cross-border interconnectors continue to pull submarine power cable and HVDC system work into the same supplier ecosystem that serves telecom routes. That overlap expands addressable demand for high-voltage subsea conductors and turnkey installation. Prysmian advancing major interconnector programs such as the ELMED Italy-Tunisia link (notice to proceed issued in 2026) and a large framework agreement for Greek island interconnections with IPTO highlights how grid modernization and island connections translate into multi-year order visibility. At the same time, these programs tighten shared bottlenecks in vessels, factories, and specialized components that also feed long-haul telecom builds.
Recent Industry Developments in Submarine Cable Systems Market
- July 2026: NEC Corporation announced signing of supply contract for I-2SEA submarine fiber-optic cable (3,600 km) connecting India, Malaysia, and Singapore. The launch expands high-capacity trans-oceanic fiber routes and strengthens NEC's leadership in long-haul SDM deployments. The contract win signals growing hyperscaler demand for reliable, scalable subsea capacity across Asia.
- June 2026: Prysmian Group received notice to proceed for ELMED Italy - Tunisia submarine electrical interconnector. The project advances HVDC cross-border power links and expands Prysmian's HVDC deployment footprint. The initiative supports Europe North Africa energy integration and grid modernization efforts.
- June 2026: Prysmian Group awarded framework agreement with IPTO for development of submarine/land-based interconnections for the Dodecanese and North Aegean islands. The expansion strengthens HVDC interconnections in Greek island networks and ensures long-term regional energy resilience. It secures an end-to-end interconnection framework and supports grid modernization.


Submarine Cable Systems Market Report Scope and Research Methodology
Market Definition and Coverage
For this report, the market covers the total value of submarine cabling systems deployed undersea to transmit data and/or power, including the main system equipment and the related delivery and installation activity that brings a route into service.
Scope exclusions: We exclude inland terrestrial cabling, onshore-only grid equipment, and the value of telecom or electricity services carried over the cables.
Segments Covered in This Report
- By Type
- Wet-Plant Products
- Dry-Plant Products
- By Ownership Type
- Consortium / Multiple-Ownership System
- Single-Ownership (Private) System
- Multilateral Development-Bank-Backed System
- By Application
- Telecom and Internet Backbone
- Offshore Wind Power Export and Array Cables
- Oil and Gas Subsea Power / Comms
- Government and Defense Surveillance
- Scientific and Research Networks
- By Fiber-Pair Count
- Less Than 8 Fiber Pairs
- 9 - 16 Fiber Pairs
- 17 - 24 Fiber Pairs
- ? 25 Fiber Pairs (SDM)
- By Geography
- North America
- United States
- Canada
- Mexico
- South America
- Brazil
- Argentina
- Rest of South America
- Europe
- United Kingdom
- Germany
- France
- Italy
- Spain
- Nordics
- Rest of Europe
- Middle East and Africa
- Middle East
- Saudi Arabia
- United Arab Emirates
- Turkey
- Rest of Middle East
- Africa
- South Africa
- Egypt
- Nigeria
- Rest of Africa
- Middle East
- Asia-Pacific
- China
- India
- Japan
- South Korea
- ASEAN
- Australia
- New Zealand
- Rest of Asia-Pacific
- North America
Data Sources, Market Sizing, and Validation
Desk Research
Desk research was used to set the market boundary, build a demand map, and cross-check timing for major route announcements and offshore grid plans. We relied on public sources such as International Telecommunication Union (ITU) statistics, International Cable Protection Committee (ICPC) guidance and publications, World Bank connectivity indicators, and national regulators and energy agencies that publish interconnector updates and offshore wind schedules.
To translate activity into value, we also used company filings and investor presentations, project press releases, and reputable maritime and telecom press that document route lengths, landing points, and commissioning timelines. Where needed, paid subscriptions were used for company financials and intelligence, patent databases, and shipment-level trade data to sanity check equipment flows and pricing ranges. The sources listed here are illustrative only, and many other public and paid references were reviewed for data collection, validation, and clarification.
Primary Interviews and Surveys
Primary interviews focused on validating what is actually being built and how contracts are priced across new builds, upgrades, and maintenance cycles. We spoke with a mix of system suppliers, marine service providers, cable owners, and engineering teams, which helped confirm route-level assumptions, factory capacity utilization assumptions, and realistic timelines by region.
Because this is a global market, input coverage was balanced across APAC, EMEA, and the Americas, so the final model reflects differences in build intensity, permitting cycles, and offshore energy buildouts.
Distribution of primary research fieldwork respondents
| Company type | Respondent position | Region |
|---|---|---|
| Top tier: 38% | CXOs: 16% | APAC: 46% |
| Mid tier: 46% | Functional/Unit leaders: 24% | EMEA: 33% |
| Smaller Players: 16% | Managers: 60% | Americas: 21% |
Market-Sizing & Forecasting
Sizing starts from a top-down rebuild of annual deployment value using route additions and upgrades, expected cable length by ocean basin, and the mix of telecom versus power projects. When the build plan is reconstructed from these signals, the market total is reached, and then checked using selective bottom-up approximations such as sampled contract values, typical system price per kilometer, and supplier revenue exposure where it is disclosed.
Key model inputs include announced and planned route kilometers, landing station additions, repeater and branching unit intensity by route design, offshore wind capacity additions tied to export cable needs, and lead times for specialized vessels and factory slots. For forecasts, scenario analysis is used because the pipeline is sensitive to permitting delays, project financing, and sudden capacity tightness, and then assumptions are adjusted based on what interviewees see in near-term tendering and booking activity. When project information is incomplete, gaps are handled by using comparable routes (distance, water depth, and design complexity) and applying conservative ranges that are narrowed during validation.
Data Validation & Update Cycle
Outputs are validated through triangulation across project trackers, public announcements, and the pricing logic implied by recent contract awards, followed by internal checks for unusual jumps in regional totals or component shares. If a route count, assumed length, or price progression creates a variance that does not match observed signals, the assumption is revisited, and when needed, sources are re-contacted to confirm what changed.
Reports are refreshed annually, and interim updates are made when material events occur, such as major route cancellations, step changes in offshore wind targets, or large new capacity additions at cable factories. Before delivery, an analyst completes a fresh review pass so clients receive an updated view aligned with the latest available information.
Mordor Intelligence's Submarine Cabling Systems Market Sizing Compared With Other Published Estimates
Published market values can differ a lot in this space because some studies count only telecom fiber systems, some fold in broader offshore power cabling, and many apply different ways to value installation, upgrades, and ongoing operating activity.
Contract award timing, route length disclosures, and the split between wet-plant and dry-plant equipment are practical gap drivers, and they influence the implied price per kilometer and the year in which revenue is recognized. Repeatable checks such as commissioning dates, factory slot availability, and regional offshore wind build schedules also shift the base case that is reported, especially when currency timing and inflation assumptions differ across studies.
Benchmark comparison
| Source | Market Size | Gaps in Research Methodology |
|---|---|---|
| Mordor Intelligence | USD 14.88 B (2025) | |
| Industry Press Release A | USD 18.20 B (2024) | This figure is positioned as a broader submarine cable system value and may pull telecom and power activity into one pool with limited clarity on wet-plant and dry-plant splits, which can inflate the counted scope for a single year. |
| Telecom Forecast Publisher B | USD 7.96 B (2023) | This estimate is specific to submarine fiber-optic telecoms cables and explicitly includes investment plus operating and maintenance spend, so it does not represent power cabling and may treat system boundaries differently than an equipment and deployment focused model. |
Route-level commissioning checks, cable-length disclosures, and observed booking activity for factory and vessel capacity are the evidence that tie Mordor Intelligence to a defined build and upgrade pipeline, which keeps the 2025 value aligned to what can be delivered within realistic schedules. The spread across publishers is therefore mainly explained by how wide the scope is (telecom-only versus combined telecom and power) and whether operating activity is counted alongside new system delivery.


Key Questions Answered in the Report
What is the projected value of the submarine cable systems market in 2031?
The market is forecast to reach USD 26.41 billion by 2031, registering a 10.03% CAGR from 2026.
Which region will grow the fastest over 2026-2031?
Asia-Pacific is expected to post a 12.45% CAGR, driven by China’s Digital Silk Road projects and Southeast Asia’s connectivity upgrades.
Why are hyperscalers shifting to single-ownership cable models?
Single ownership grants end-to-end network control, accelerates deployment, and enables customized SDM designs suited to cloud-scale data throughput.
How are offshore wind projects influencing demand for subsea cables?
Energy-export links for large wind farms require high-voltage submarine conductors, a segment growing at 14.65% CAGR as countries pursue decarbonization.
What technological advances are most impactful for future capacity?
Space-division multiplexing and ≥32-fiber-pair designs lower cost-per-terabit and push achievable capacities beyond 400 Tbps on a single route.
Page last updated on:






