Market Overview
| Study Period | 2019 - 2031 |
|---|---|
| Base Year For Estimation | 2025 |
| Forecast Data Period | 2026 - 2031 |
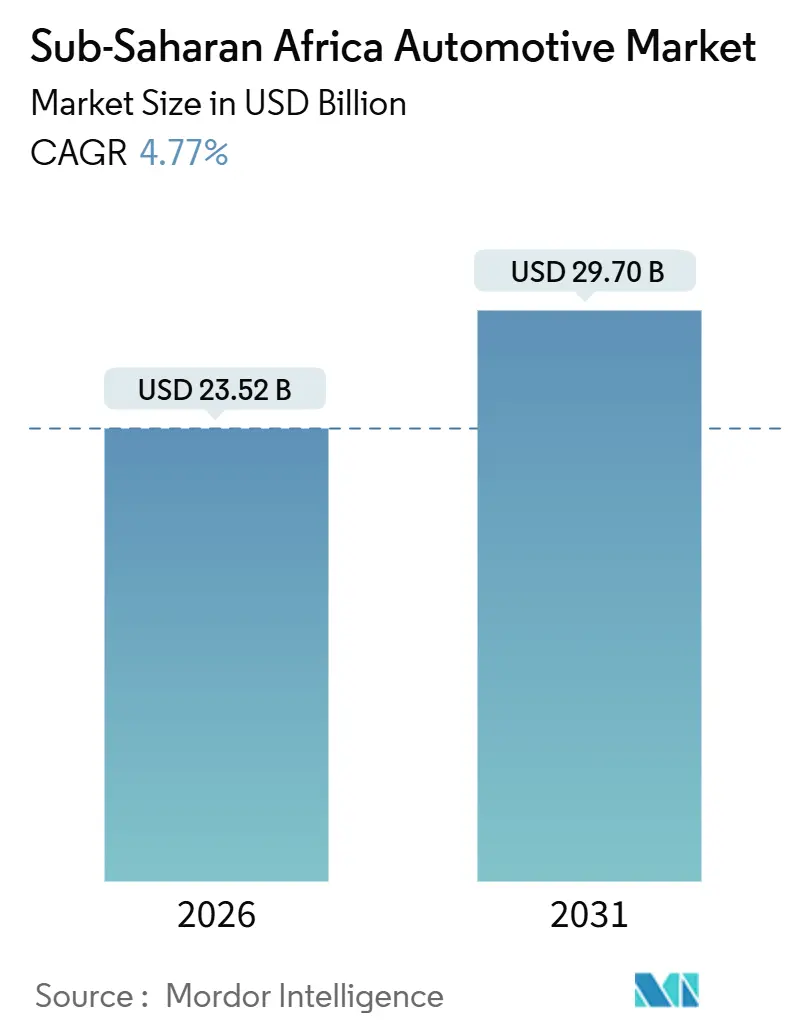
| Market Size (2026) | USD 23.52 Billion |
| Market Size (2031) | USD 29.70 Billion |
| Growth Rate (2026 - 2031) | 4.77% CAGR |
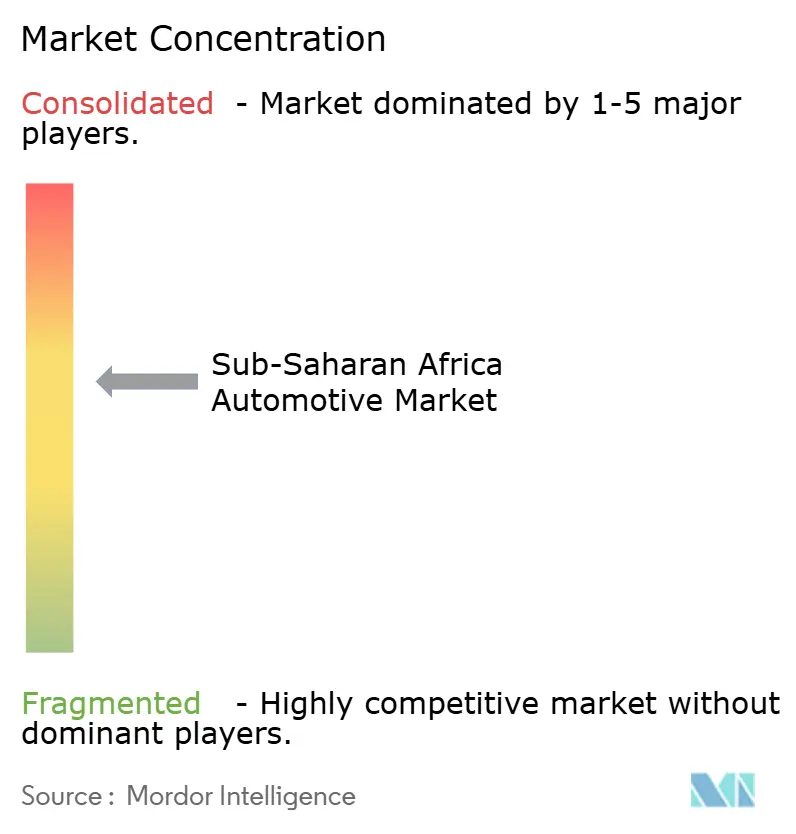
| Market Concentration | Medium |
Major Players *Disclaimer: Major Players sorted in no particular order Image © Mordor Intelligence. Reuse requires attribution under CC BY 4.0. | |
Sub-Saharan Africa Automotive Market Analysis by Mordor Intelligence
The Sub-Saharan Africa automotive market size in 2026 is estimated at USD 23.52 billion, growing from the 2025 value of USD 22.45 billion, with projections for 2031 showing USD 29.7 billion, representing a 4.77% CAGR over the 2026-2031 period. Accelerating urbanization, surging ride-hailing fleets, and government incentives for local assembly collectively sustain momentum despite persistent currency volatility and infrastructure gaps. Electrification initiatives in Ethiopia and South Africa signal a structurally diversifying demand mix, while diesel platforms remain dominant because of established fuel logistics and service networks. Grey-import activity continues to temper authorized-dealer volumes, yet structured fleet financing programs unlock new-vehicle penetration among ride-hailing operators. Strategic OEM partnerships with local assemblers, supported by AfCFTA tariff reductions, reinforce regional supply-chain integration.
Key Report Takeaways
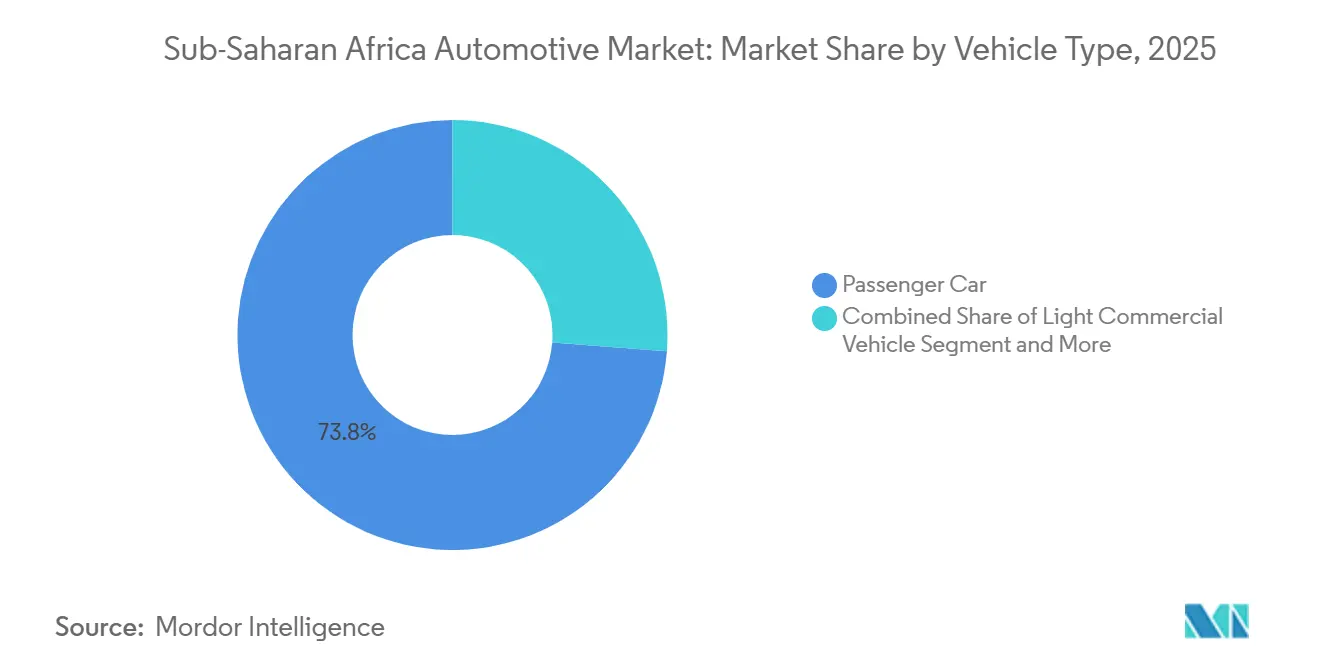
- By vehicle type, Passenger Cars led with 73.80% of the Sub-Saharan Africa automotive market share in 2025 and are expected to expand at a 5.56% CAGR through 2031.
- By fuel type, Diesel led with 54.60% of the Sub-Saharan Africa automotive market share in 2025 and is expected to expand at a 6.02% CAGR through 2031.
- By propulsion technology, Internal Combustion Engine platforms held 88.60% of the Sub-Saharan Africa automotive market size in 2025, whereas Battery Electric Vehicles are advancing at a 19.10% CAGR through 2031.
- By sales channel, OEM-authorized dealers captured 65.10% of the Sub-Saharan Africa automotive market share in 2025; grey imports recorded the highest projected CAGR at 6.92% through 2031.
- By geography, South Africa accounted for 43.90% of the Sub-Saharan Africa automotive market share in 2025, while Kenya is forecasted to expand at a 6.62% CAGR to 2031, becoming the fastest-growing country market.
Note: Market size and forecast figures in this report are generated using Mordor Intelligence’s proprietary estimation framework, updated with the latest available data and insights as of January 2026.
Sub-Saharan Africa Automotive Market Trends and Insights
Drivers Impact Analysis
| Driver | (~) % Impact on CAGR Forecast | Geographic Relevance | Impact Timeline |
|---|---|---|---|
| Middle Class Income and Urbanization | +1.2% | Nigeria, Kenya, Ghana | Long term (≥ 4 years) |
| Ride-Hailing Accelerates Fleet Renewal | +0.8% | Nigeria, Kenya, South Africa, Ghana | Medium term (2-4 years) |
| Incentives Boost CKD/SKD Assembly | +0.9% | Ghana, South Africa, Ethiopia, Nigeria | Medium term (2-4 years) |
| Upgraded Roads Improve Connectivity | +0.7% | Kenya, Nigeria, Tanzania, Angola | Long term (≥ 4 years) |
| AfCFTA Reduces Trade Tariffs | +0.6% | SSA-wide with early EAC and ECOWAS gains | Long term (≥ 4 years) |
| Micro-EV Imports Fill Niche | +0.5% | South Africa, Kenya, Nigeria | Short term (≤ 2 years) |
| Source: Mordor Intelligence | |||


Rising Middle-Class Income and Urbanization
An annual 4.1% urban-population uptick shifts purchasing power toward metropolitan nodes where dealer networks, financing options, and aftermarket services coalesce. Middle-income households in Nigeria, Kenya, and Ghana gravitate towards affordable models, intensifying competition between Chinese and Indian OEMs. Compact SUVs and hatchbacks hold favor for maneuverability in congested corridors, whereas peri-urban consumers rely on incoming used stock propelled by rising urban trade-in flows. Lenders follow employment clusters, resulting in cities above 1 million inhabitants offering up to five times more car-loan products than rural districts. Although local-currency depreciation erodes import affordability, wage growth linked to extractive sectors partially offsets price pressure, sustaining demand.
Surge of Ride-Hailing Platforms Accelerating Fleet Renewal
Structured fleet-financing programs from providers such as Moove enable ride-hailing drivers to bypass conventional credit hurdles, lifting multi-year baseline demand for the Sub-Saharan Africa automotive market. Ride-hailing vehicles operate 8-12 hours daily, roughly quadrupling private-use utilization, which shortens replacement cycles to 3-4 years. This predictable cadence enables OEMs to align inventory planning with platform procurement schedules, thereby protecting volumes when consumer sentiment declines. Nigeria, Kenya, and South Africa collectively host over 450,000 active ride-hailing drivers as of 2025, and platform expansion into secondary cities deepens the addressable demand. Government agencies increasingly recognize such fleets as catalysts for formalizing transport services, offering duty rebates on low-emission vehicles deployed for ride-hailing in Ethiopia and Ghana. Resultant fleet growth moderates the risk of limited retail financing reach in many markets.
Government CKD/SKD Assembly Incentives
Fiscal stimuli ranging from eight-year import-duty holidays on EVs in Ghana to South Africa’s 150% EV-production tax deduction transform import-dependent markets into nascent manufacturing hubs. Ethiopia’s 5% duty on partially assembled EVs flips landed-cost equations in favor of local assembly. The resulting plant pipeline will add more than 65,000 units of annual capacity between 2025 and 2028, creating skilled jobs and generating supplier spillovers. Successful implementation relies on parallel investments in logistics and workforce upskilling. Countries that tie incentives to minimum local-content thresholds also spur component localization, thereby anchoring longer-term industrial competitiveness.
Infrastructure Upgrades Improving Road Connectivity
Recent highway and bridge investments have lowered operating costs and reduced journey times, expanding the realistic travel radius for personal and commercial mobility across regional corridors. The USD 15.6 billion Abidjan–Lagos Highway, scheduled for phased completion between 2026 and 2030, is expected to halve the end-to-end transit duration, spurring demand for cross-border logistics in light commercial vehicles. Kenya’s 27 km Nairobi Expressway reduced airport-to-central-business-district travel from 60 minutes to 15 minutes, prompting a 12% rise in daily vehicle counts on adjoining roads within one year of its opening. Better road surfaces cut fleet maintenance expenses by up to 18%, encouraging faster replacement cycles among ride-hailing and delivery operators. Dealers along rehabilitated trunk highways record double-digit showroom traffic growth as formerly remote towns gain dependable access. Governments also pair these projects with stricter weigh-bridge and emissions checks, pushing demand toward newer vehicles that meet updated axle-load and environmental standards.
Restraint Impact Analysis
| Restraint | (~) % Impact on CAGR Forecast | Geographic Relevance | Impact Timeline |
|---|---|---|---|
| Used Car Imports Dominate | -1.1% | Kenya, Nigeria, Ghana, Tanzania | Short term (≤ 2 years) |
| Limited Credit Access, High Rates | -0.9% | Nigeria, Angola, Zambia | Medium term (2-4 years) |
| Volatile Currency Inflates Costs | -0.8% | Nigeria, Angola, Ghana, Zambia | Short term (≤ 2 years) |
| Fragmented Homologation Standards | -0.4% | ECOWAS, EAC coordination challenges | Long term (≥ 4 years) |
| Source: Mordor Intelligence | |||
Dominance of Used-Car Imports
Used vehicles represented 83% of all light-duty vehicle registrations across Sub-Saharan Africa in 2024, according to the African Association of Automotive Manufacturers [1]“SSA Vehicle Market Commentary 2025,” African Association of Automotive Manufacturers, aaamafrica.com. South African Revenue Service customs data show that price gaps of 45-60% between used and new models tilt buyer preference. This disparity is magnified whenever local-currency depreciation inflates showroom prices. Projected deregistrations of ICE cars in wealthier economies could add 15 million exportable units annually by 2030, prolonging the region’s high-emission fleet unless stricter import-quality rules take hold. UNECE roadworthiness protocols aim to stem sub-standard flows, but uneven enforcement across border posts still dilutes effectiveness.
Limited Consumer Credit Access and High Interest Rates
Vehicle-loan penetration averaged 12% across major markets in 2024, constrained by thin credit files and volatile currencies. Central Bank of Nigeria data place the average auto-loan rate at 24.6% in Q1 2025 [2]“Monetary & Credit Statistics Q1 2025,” Central Bank of Nigeria, cbn.gov.ng, while the Bank of Ghana lists 28.1%. Down-payment requirements range from 30-50%, and tenors rarely exceed five years, limiting eligibility for vehicles priced above USD 20,000. Lenders mitigate default risk by demanding collateral beyond the vehicle itself. Alternative schemes—ride-hailing lease-to-own, employer fleet programs, and fintech micro-loans—served just 4% of potential buyers in 2024.
Segment Analysis
By Vehicle Type: Passenger Cars Sustain Dominance
Passenger cars preserved a 73.80% share of the Sub-Saharan Africa automotive market volume in 2025 and are forecast to grow at a 5.56% CAGR through 2031, as middle-income cohorts expand. Light commercial vehicles (LCVs) benefit from e-commerce acceleration, especially in Nigeria and Kenya, where last-mile delivery providers lease small vans optimized for dense urban routes. Medium- and heavy-duty trucks trail the overall market growth, tied to commodity-export cycles in South Africa, Zambia, and Angola. Ride-hailing fleets underpin steady passenger-car demand, absorbing sedan and hatchback stock through structured financing programs that lower upfront cost burdens.
Policy-driven electrification in Ethiopia reshapes the passenger-car mix: 60% of newly registered cars must be EVs, catalyzing dedicated assembly ventures and public-sector procurement. Conversely, commercial-vehicle electrification lags due to payload-range constraints, although pilot programs in Johannesburg are testing battery-electric vans under urban logistics duty cycles. Sustained momentum within the passenger-car segment remains contingent on currency stability and progressive credit-access reforms across the Sub-Saharan Africa automotive market.
Note: Segment shares of all individual segments available upon report purchase

By Fuel Type: Diesel Dominance Faces Electrification Pressure
Diesel platforms held a 54.60% share of the Sub-Saharan Africa automotive market volume in 2025, buoyed by superior fuel economy and extensive service infrastructure, and they are projected to post a 6.02% CAGR through 2031. Gasoline penetration increases in urban centers where cost gaps narrow, and emissions policies become stricter. Alternative fuels, such as CNG and LPG, capture niche fleet deployments, as highlighted by Nigeria’s compressed natural gas scheme, which incentivizes taxi and bus conversions. Biofuel initiatives are germinating in Ghana and Kenya, utilizing local feedstocks, but scaling up hinges on policy consistency and investment in blending facilities.
The Sub-Saharan African automotive market size for diesel powertrains expands alongside demand for construction and mining vehicles. Yet, its share gradually erodes as EV incentives redirect incremental demand toward electrified platforms. Government fuel-price deregulation trajectories also influence adoption curves; countries that phase out diesel subsidies sooner may prompt faster adoption of gasoline or hybrids.
By Propulsion Technology: ICE Dominance Amid EV Acceleration
Internal Combustion Engines captured 88.60% share of Sub-Saharan Africa automotive market volume in 2025, but Battery Electric Vehicles delivered the swiftest trajectory at a 19.10% CAGR, albeit off a low base. Hybrid vehicles serve as interim solutions, particularly among affluent South African buyers who balance fuel cost savings with the limited charging infrastructure. Plug-in hybrids address range anxiety, gaining a foothold in peri-urban corridors where grid reliability remains sporadic.
Ethiopia’s preferential 5% duty on semi-knocked-down EVs undercuts the landed cost of comparable ICE cars by 18-22%, fast-tracking electrified adoption. South Africa’s 150% production tax deduction, effective March 2026, is expected to lure additional EV final-assembly investments from global OEMs. Nevertheless, constrained public-charging density, averaging one charger per 350 km of primary roadway, tempers mass-market penetration, underscoring the multi-decade timeframe for complete propulsion transition within the Sub-Saharan Africa automotive market.

Note: Segment shares of all individual segments available upon report purchase
By Sales Channel: Dealer Networks Face Grey Import Competition
OEM-authorized dealers represented 65.10% of the Sub-Saharan Africa automotive market volume in 2025, capitalizing on warranty coverage and scheduled-maintenance plans that resonate with fleet operators. Grey imports are projected to grow by a 6.92% CAGR, propelled by 15-25% price savings and immediate stock availability for sought-after trims. Secondary cities lacking formal dealership footprints rely heavily on independent importers, reinforcing geographic disparities.
Kenya’s draft regulation capping vehicle import age at eight years is facing ongoing legal contestation by grey-import lobby groups, who cite concerns over consumer affordability. UNECE quality-standard harmonization efforts aim to curb subpar vehicles, yet fragmented enforcement perpetuates uneven competition. Dealer groups respond with subscription-based ownership models that bundle insurance, maintenance, and telematics to elevate value propositions across the Sub-Saharan African automotive market.
Geography Analysis
South Africa commands 43.90% of the Sub-Saharan Africa automotive market revenue, leveraging mature assembly ecosystems, deep supplier bases, and robust dealer networks that reach neighboring export destinations. Investments, such as Stellantis’s USD 165 million facility upgrade and Volkswagen’s USD 210 million paint shop modernization, underpin volume stability and future EV localization. Fiscal incentives, including the 150% EV-production tax deduction, signal policy continuity that secures OEM capital allocations through 2030.
Nigeria is also one of the largest markets; however, currency depreciation compresses new-vehicle affordability, channeling demand toward used imports. Government-led assembly incentives and the National Automotive Industry Development Plan aim to reverse import dependency by mandating progressive local-content thresholds. Still, the naira’s 70% devaluation since May 2023 inflates CKD kit costs denominated in USD, tempering momentum. Emerging e-commerce logistics demand elevates LCV uptake, partially offsetting subdued retail passenger-car volumes.
Kenya delivers the fastest growth trajectory at a 6.62% CAGR through 2031, anchored by infrastructure upgrades such as the Nairobi Expressway and stringent enforcement of import-quality standards, which raises the bar for used-vehicle inflows. Ghana positions itself as a West African distribution hub, bolstered by eight-year EV import duty exemptions and streamlined port clearance procedures that reduce vehicle landing times by 25%. Ethiopia emerges as the region’s electrification vanguard, while corridor projects, such as the USD 15.6 billion Abidjan–Lagos Highway, promise to slash transit times across five coastal states and catalyze logistics efficiencies as AfCFTA implementation deepens.
Competitive Landscape
The Sub-Saharan Africa automotive market remains moderately fragmented. Toyota, Volkswagen, and Hyundai leverage long-standing dealer infrastructures and diversified model line-ups to sustain leadership across body-style clusters. Chinese challengers, including BYD, Chery, and Geely, are expanding aggressively through price-competitive electrified SUVs paired with digital-first sales channels, eroding the footholds of incumbents in the urban middle-tier segment.
Strategic emphasis centers on CKD/SKD assembly partnerships that cushion currency exposure and exploit tariff concessions. Stellantis’s Coega plant, slated for a 2026 launch, will add 50,000-unit capacity, targeting both domestic demand and SADC exports. BYD coordinates with Ethiopian state agencies to assemble battery packs locally, securing preferential duty rates. Dealer groups are experimenting with subscription models that integrate insurance, maintenance, and telematics, targeting fleet operators and tech-savvy urban professionals.
White-space opportunities span charging-station deployment, rural distribution nodes, and fintech-enabled microloans. Telematics adoption accelerates as insurers roll out usage-based insurance, while ride-hailing aggregators invest in fleet management software to optimize utilization and maintenance. Competitive intensity rises within the electrified crossover class, where price differentials compress as battery costs decline and accelerate. Overall, strategic agility in local sourcing, digital sales, and alternative financing will dictate share gains as the Sub-Saharan Africa automotive market transitions toward cleaner propulsion and formalized distribution networks.
Sub-Saharan Africa Automotive Industry Leaders
Toyota Motor Corporation
Volkswagen AG
Hyundai Motor Company
Nissan Motor Corporation
Isuzu Motors Ltd.
- *Disclaimer: Major Players sorted in no particular order

Recent Industry Developments
- August 2025: Toyota has announced its intention to introduce three fully electric models in South Africa by 2026, signaling its entry into the continent's burgeoning EV market. This strategic maneuver aims to establish a presence in a territory where rivals, including the Chinese giant BYD and various European automakers, are competing aggressively for dominance.
- June 2025: Chery launched Omoda and Jaecoo hybrid SUVs in South Africa, marking its premium-segment debut with locally assembled models.
- April 2025: BYD introduced Sealion 6 PHEV, Sealion 7 EV, and Shark 6 PHEV in South Africa, expanding its electrified portfolio.


Sub-Saharan Africa Automotive Market Report Scope
The Sub-Saharan automotive market outlook examines the region's growing demand for passenger cars, commercial vehicles, and two-wheelers, as well as OEM investments to establish a presence in countries, developments in the electric vehicle market, and the market shares of both OEMs and OES. Regulations on importing new and used vehicles, taxes levied by the government for new & used cars, government initiatives to boost the automotive industry, and the future of the Sub-Saharan Africa Automotive industry.
The Sub-Saharan Africa Automotive market is segmented by Body Style Type, Fuel Type, Vehicle Type, and Geography.
By Body Style Type, the market is segmented into Hatchback, Sedan, Sport Utility Vehicles, and Others. By fuel type, the market is segmented into Gasoline, Diesel, and Other Alternative Fuels. By Vehicle Type, the market is segmented into Passenger Cars, Commercial Vehicles, and Two-wheelers. By Geography, the market is segmented into South Africa, Kenya, Nigeria, Ethiopia, Ghana, and Other Countries. For each segment, the market size and forecast have been calculated based on value (USD).
By Vehicle Type
| Passenger Cars |
| Light Commercial Vehicles |
| Medium and Heavy Commercial Vehicles |
By Fuel Type
| Gasoline |
| Diesel |
| Alternative Fuels (CNG, LPG, Bio-fuel) |
By Propulsion Technology
| Internal Combustion Engine (ICE) |
| Hybrid Electric Vehicle (HEV) |
| Battery Electric Vehicle (BEV) |
| Plug-in Hybrid Electric Vehicle (PHEV) |
By Sales Channel
| Original Equipment Manufacturer (OEM)-Authorized Dealer |
| Grey Import / Parallel |
By Country
| South Africa |
| Nigeria |
| Kenya |
| Ethiopia |
| Ghana |
| Tanzania |
| Angola |
| Zambia |
| By Vehicle Type | Passenger Cars |
| Light Commercial Vehicles | |
| Medium and Heavy Commercial Vehicles | |
| By Fuel Type | Gasoline |
| Diesel | |
| Alternative Fuels (CNG, LPG, Bio-fuel) | |
| By Propulsion Technology | Internal Combustion Engine (ICE) |
| Hybrid Electric Vehicle (HEV) | |
| Battery Electric Vehicle (BEV) | |
| Plug-in Hybrid Electric Vehicle (PHEV) | |
| By Sales Channel | Original Equipment Manufacturer (OEM)-Authorized Dealer |
| Grey Import / Parallel | |
| By Country | South Africa |
| Nigeria | |
| Kenya | |
| Ethiopia | |
| Ghana | |
| Tanzania | |
| Angola | |
| Zambia |


Key Questions Answered in the Report
What is the 2026 value of the Sub Saharan Africa automotive market?
The market stands at USD 23.52 billion in 2026, supported by urbanization and policy incentives.
How fast is the Sub Saharan Africa automotive market expected to grow?
It is projected to expand at a 4.77% CAGR between 2026 and 2031, reaching USD 29.7 billion.
Which country holds the largest share in regional vehicle sales?
South Africa leads with 43.90% share, anchored by established manufacturing and dealer networks.
What segment shows the quickest growth within regional propulsion technologies?
Battery Electric Vehicles register the highest CAGR at 19.10%, propelled by policy incentives and Chinese OEM expansion.
Why do SUVs dominate body-style preferences?
High ground clearance and versatility suit mixed-quality roads, giving SUVs a 36.20% share of 2025 sales.
Page last updated on:


