
Structural Biology And Molecular Modeling Techniques Market Size and Share
Market Overview
| Study Period | 2020 - 2031 |
|---|---|
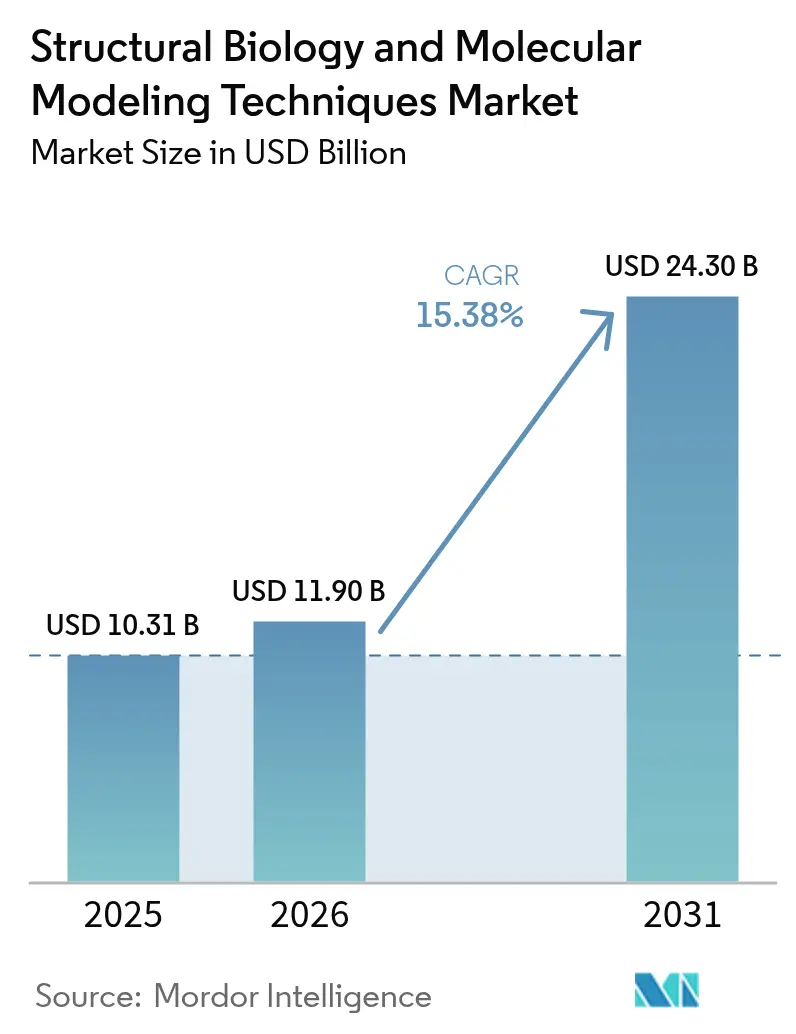
| Market Size (2026) | USD 11.9 Billion |
| Market Size (2031) | USD 24.3 Billion |
| Growth Rate (2026 - 2031) | 15.38 % |
| Fastest Growing Market | Asia Pacific |
| Largest Market | North America |
| Market Concentration | Medium |
Major Players *Disclaimer: Major Players sorted in no particular order Image © Mordor Intelligence. Reuse requires attribution under CC BY 4.0. | |
Structural Biology And Molecular Modeling Techniques Market Analysis by Mordor Intelligence
The Structural Biology and Molecular Modeling Techniques market size is expected to grow from USD 10.31 billion in 2025 to USD 11.9 billion in 2026 and is forecast to reach USD 24.3 billion by 2031 at 15.38% CAGR over 2026-2031. Rapid convergence of artificial intelligence with physics-based simulation underpins this expansion, enabling pharmaceutical companies to compress discovery timelines and trim preclinical spend. The January 2025 FDA draft guidance that frames AI outputs as primary evidence has institutionalized computational results, opening the door for model-informed submissions.[1]Source: Food and Drug Administration, “Considerations for the Use of Artificial Intelligence to Support Regulatory Decision-Making for Drug and Biological Products,” federalregister.gov Venture funding into quantum-ready software stacks and cloud-native platforms accelerates commercialization, while high-resolution cryo-EM data streams feed ever larger training sets. Competitive dynamics favor vendors capable of unifying visualization suites, simulation engines, and machine-learning models around secure, subscription-based delivery. Mid-size biotech and academic laboratories now access enterprise-grade resources via web portals, democratizing innovation and expanding the structural biology and molecular modeling techniques market addressable base.
Key Report Takeaways
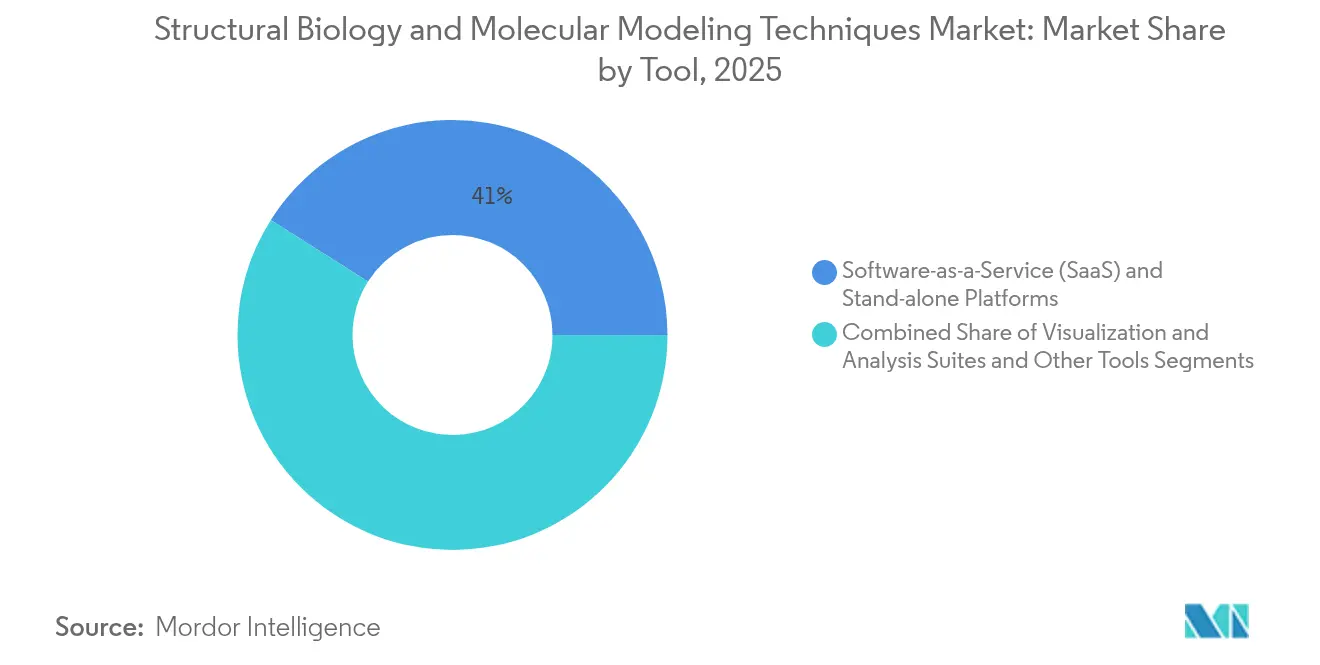
- By tool, SaaS platforms led with 41.02% revenue share in 2025; visualization and analysis suites are forecast to expand at a 16.24% CAGR through 2031.
- By application, drug discovery commanded 52.88% of the structural biology and molecular modeling techniques market share in 2025, while drug development and lead optimization are projected to grow at a 16.49% CAGR to 2031.
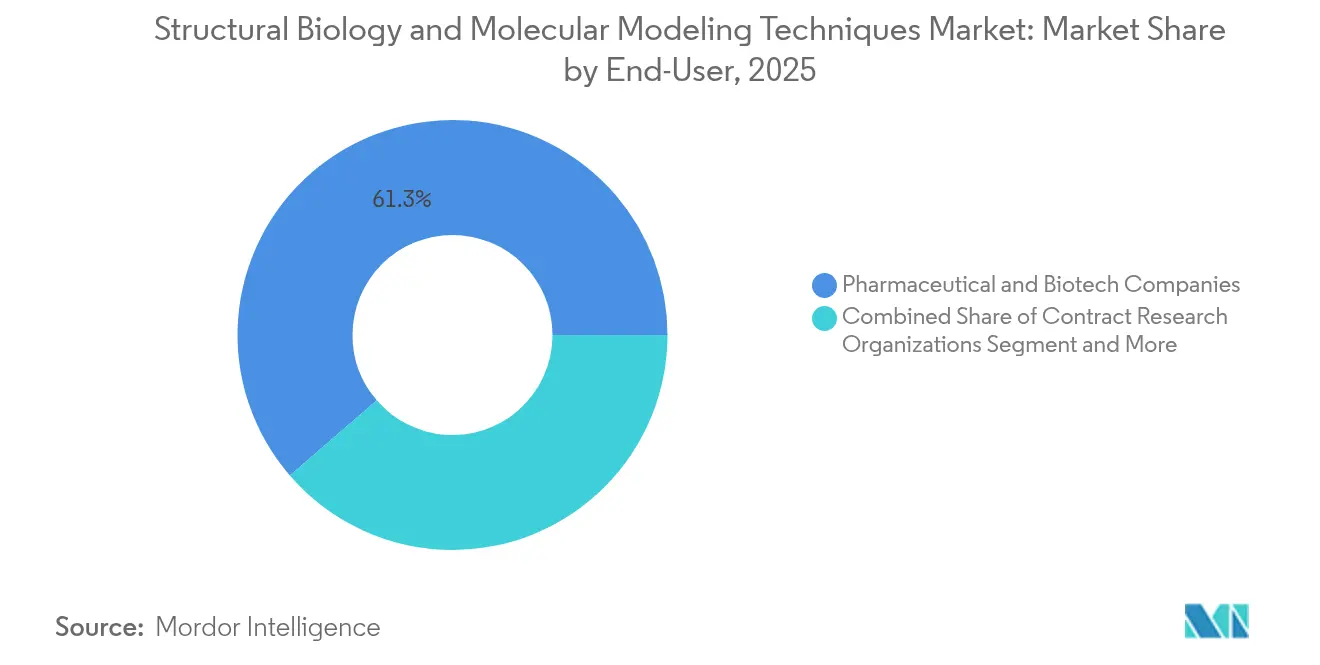
- By end-user, pharmaceutical and biotech companies accounted for 61.34% share of the structural biology and molecular modeling techniques market size in 2025, whereas academic and government institutes hold the fastest trajectory at 16.74% CAGR.
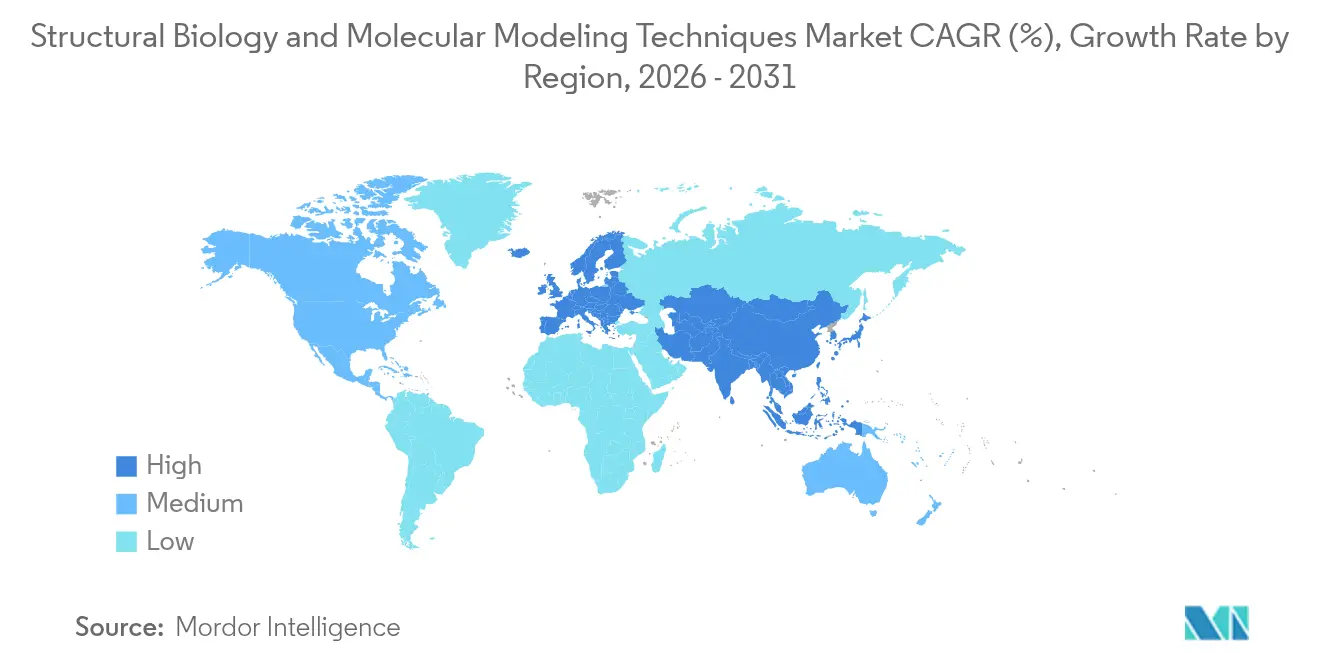
- By region, North America captured 40.41% of the structural biology and molecular modeling techniques market in 2025, whereas Asia-Pacific is expected to post the fastest growth at a 16.21% CAGR to 2031.
Note: Market size and forecast figures in this report are generated using Mordor Intelligence’s proprietary estimation framework, updated with the latest available data and insights as of 2026.
Market Trends and Insights
Drivers Impact Analysis of Structural Biology And Molecular Modeling Techniques Market*
| Driver | (~) % Impact on CAGR Forecast | Geographic Relevance | Impact Timeline |
|---|---|---|---|
| Rapid Adoption of AI-Driven Drug-Discovery Platforms | +3.2% | Global, with concentration in North America & EU | Short term (≤ 2 years) |
| Rising Prevalence of Chronic Diseases | +2.8% | Global, particularly aging populations in developed markets | Medium term (2-4 years) |
| Advances in Cryo-EM & High-Resolution Imaging | +2.5% | North America & EU core, expanding to APAC | Medium term (2-4 years) |
| Growth in Cloud-Native Collaborative Research Environments | +2.1% | Global, with early adoption in North America | Short term (≤ 2 years) |
| Increasing Use of Digital-Twin Proteins for In-Silico Toxicity Screening | +1.9% | North America & EU, emerging in APAC | Long term (≥ 4 years) |
| Open-Access Structural Databases Enabling Decentralized Innovation | +1.7% | Global, with strongest impact in academic institutions | Long term (≥ 4 years) |
| Source: Mordor Intelligence | |||
Rapid Adoption of AI-Driven Drug-Discovery Platforms
Eli Lilly’s USD 1 billion commitment to a quantum chemistry start-up exemplifies how top pharma dedicates full discovery pipelines to machine-learning ensembles. Widespread deployment of AlphaFold 3, Boltz-2, and similar tools drives parallel explorations of conformational landscapes that once took years. FDA credibility frameworks now accept virtual screens as decision-quality evidence, lowering preclinical attrition by 30–40%. Vendors integrate molecular dynamics, docking, and graph neural networks within unified workspaces so that chemists iterate designs in real time. Competitive advantage increasingly hinges on orchestrating outputs from multiple AI models rather than depending on a single proprietary engine.
Rising Prevalence of Chronic Diseases
Neurodegeneration, oncology, and metabolic disorders require poly-pharmacology approaches that only structure-enabled modeling can support. FDA oncology dosage guidance released in 2024 underlines the need for predictive exposure–response simulations before first-in-human trials.[2]Source: Food and Drug Administration, “Optimizing the Dosage of Human Prescription Drugs and Biological Products for the Treatment of Oncologic Diseases,” federalregister.gov Multi-target algorithms optimize binding affinities across interconnected pathways while monitoring off-target risks. Demand rises for platforms that trace allosteric shifts and protein–protein interactions through entire cellular contexts. As chronic disease complexity grows, simulation depth—not just speed—becomes critical, fueling further uptake of high-precision hybrid quantum-mechanical methods.
Advances in Cryo-EM & High-Resolution Imaging
Sub-2 Å cryo-EM reconstructions now reveal atomic-level drug binding that historically relied on inferential crystallographic models. Cloud-hosted image processing pipelines cut cycle times from months to days, letting smaller biotechs exploit national facility data without on-prem hardware. AI-enhanced particle picking and map refining feed directly into downstream molecular dynamics, ensuring that simulation inputs mirror native conformations. This synergy between imaging and modeling sharpens target validation, reducing costly late-stage pivots.
Growth in Cloud-Native Collaborative Research Environments
On-demand infrastructure from hyperscale providers supports thousands of parallel trajectories, removing compute ceilings that once rationed exploration depth. Secure workspaces allow cross-institutional consortia to co-develop lead series while safeguarding intellectual property under granular access controls. Elastic clusters launch GPU-accelerated molecular dynamics at submission time, aligning spend with workload and broadening participation among budget-conscious academic labs.
Restraints Impact Analysis of Structural Biology And Molecular Modeling Techniques Market*
| Restraint | (~) % Impact on CAGR Forecast | Geographic Relevance | Impact Timeline |
|---|---|---|---|
| High Cost of Sophisticated Instrumentation | -1.8% | Global, particularly affecting emerging markets | Medium term (2-4 years) |
| Shortage of Cross-Disciplinary Skilled Personnel | -1.5% | Global, acute in North America & EU | Long term (≥ 4 years) |
| Data-Sovereignty Limits on Cross-Border Collaboration | -1.2% | EU & APAC primarily, with spillover effects globally | Short term (≤ 2 years) |
| Algorithmic Bias in AI-Based Molecular Modeling | -0.9% | Global, with heightened regulatory focus in North America & EU | Medium term (2-4 years) |
| Source: Mordor Intelligence | |||
High Cost of Sophisticated Instrumentation
Advanced cryo-electron microscopy systems and high-performance computing clusters require capital investments exceeding USD 10 million, creating significant barriers for smaller research organizations and emerging market institutions. The operational costs extend beyond initial equipment purchases to include specialized facility requirements, maintenance contracts, and continuous software licensing fees that can consume 40-50% of annual research budgets. Cloud-based alternatives partially address these challenges, but data transfer costs and latency issues limit their effectiveness for real-time collaborative research. The concentration of sophisticated instrumentation in well-funded institutions creates research inequality, where breakthrough discoveries increasingly emerge from a small number of elite organizations with access to cutting-edge technology. This dynamic potentially slows overall market growth by limiting the diversity of research approaches and reducing the number of active participants in drug discovery innovation.
Shortage of Cross-Disciplinary Skilled Personnel
The convergence of structural biology, computational chemistry, and artificial intelligence creates unprecedented demand for professionals who understand both molecular mechanisms and advanced computing methodologies. Universities struggle to develop curricula that adequately prepare graduates for roles requiring expertise in protein biochemistry, machine learning algorithms, and regulatory science simultaneously. The talent shortage particularly affects the development of AI models for drug discovery, where domain expertise in both molecular biology and data science determines model accuracy and regulatory acceptance. Competition for qualified personnel drives salary inflation across the sector, with specialized roles commanding premium compensation that smaller organizations cannot afford. This skills gap slows the adoption of advanced modeling techniques and creates bottlenecks in translating computational insights into therapeutic candidates.
*Our forecasts treat driver/restraint impacts as directional, not additive. The impact forecasts reflect baseline growth, mix effects, and variable interactions.
Structural Biology And Molecular Modeling Techniques Market Segment Analysis
By Tool:
SaaS Platforms Drive Market ConsolidationSaaS and stand-alone platforms captured 41.02% value in 2025, underscoring subscription economics that ease capital barriers for newcomers. Within this bracket, high-throughput molecular dynamics engines lead daily usage metrics, while quantum-mechanical solvers find traction in select programs demanding sub-kcal/mol accuracy. Visualization suites outpace all other tool types with a 16.24% CAGR, propelled by intuitive GUIs that let medicinal chemists, structural biologists, and data scientists co-explore conformational ensembles without coding experience. Open-source entrants such as VTX and OpenMMDL broaden access and chip away at proprietary market dominance. The structural biology and molecular modeling techniques market size for visualization suites is projected to expand steadily as GPU rendering costs decline and cloud delivery normalizes.
Vendor strategies coalesce around integrated ecosystems that knit together docking, free-energy calculations, and AI-guided property prediction under unified authentication and billing. Acquisitions concentrate niche algorithms into larger stacks, creating switching costs that discourage fragmentation. The structural biology and molecular modeling techniques market repeatedly rewards platforms that minimize data handoffs, and this mindset continues to drive consolidation waves through 2030.


By Application:
Drug Development Accelerates Beyond DiscoveryDrug discovery maintained 52.88% share in 2025, yet drug development and lead optimization log the fastest climb at 16.49% CAGR, mirroring regulatory green lights for model-informed protocols. Sponsors integrate exposure–response simulators with structural predictions to pre-empt dose-limiting toxicities in Phase I. Protein engineering also advances briskly as firms redesign scaffolds for half-life extension and immunogenicity minimization. The structural biology and molecular modeling techniques market size for drug development phases is forecast to double before 2030 as validated AI pipelines migrate into late-stage workflows.
Clinical statisticians now collaborate directly with modelers to set adaptive trial parameters based on in-silico pharmacokinetic profiles. Real-world evidence feeds continuous learning loops, allowing ongoing refinement of safety margins. Such feedback tightens the confidence interval around success probabilities, encouraging management to greenlight programs that previously died in data-sparse uncertainty.
By End-User:
Academic Institutes Challenge Industry DominancePharmaceutical and biotech enterprises retained 61.34% stake in 2025, yet academic and government institutes advance at a 16.74% CAGR. National science agencies funnel fresh grants toward pandemic preparedness, climate-linked pathogen research, and rare disease initiatives, all of which demand structural insight. The structural biology and molecular modeling techniques market share of academia therefore enlarges even as industry spending widens. Contract research organizations (CROs) evolve new service lines that embed modeling expertise, letting small biotechs outsource entire simulation campaigns without acquiring internal talent.
Software vendors transform into co-development allies, evidenced by a USD 2.3 billion collaboration that positions Schrödinger as joint pipeline architect rather than pure software seller. Such hybrid roles blur traditional boundaries and signal a shift toward outcome-based contracting across the structural biology and molecular modeling techniques market.
Geography Analysis
North America Structural Biology and Molecular Modeling Techniques Market
North America held 40.41% of global revenue in 2025, buoyed by NIH budget upticks and a regulatory culture that explicitly embraces AI-generated evidence. High-density clusters in Boston, San Diego, and Toronto provide fertile ground for start-ups, yet escalating cloud costs and wage inflation test sustainability margins for seed-stage ventures. The region’s academic-industry symbiosis remains a powerful growth engine, particularly for pre-competitive tool development grants that later mature into commercial differentiators. Federal agencies streamline review pathways, trimming submission cycles and accelerating commercial payback for successful assets.
EMEA, APAC and South America Structural Biology and Molecular Modeling Techniques Market
Europe preserves steady momentum through coordinated public–private initiatives and the September 2024 EMA reflection paper that harmonizes AI governance across member states. Data-sovereignty directives complicate multi-regional data lakes, but domestically hosted clouds mitigate compliance gaps. The structural biology and molecular modeling techniques market size for European consortia rises as cross-border Horizon projects subsidize large-scale cryo-EM networks and quantum research corridors. Asia-Pacific commands the fastest growth trajectory at 16.21% CAGR. Chinese quantum computing labs funnel state incentives toward drug-discovery algorithms capable of teasing apart exponentially large Hilbert spaces. Japan’s leadership in cryo-EM infrastructure complements its world-class supercomputers, producing high-fidelity structure sets that feed regional AI efforts. India scales cloud-first biotech incubators, translating its software engineering prowess into cost-effective simulation services. South Korea and Australia focus on niche strengths—biosensors and translational genomics respectively—integrating outputs into the wider regional ecosystem. Collectively these initiatives reshape competitive parity in the structural biology and molecular modeling techniques market. The Middle East, Africa, and South America record nascent yet promising adoption curves. Government technology free zones in the Gulf invite Western software partners through tax incentives, while Brazil leverages public university networks to perform agro-biodiversity modeling. Although absolute spend remains modest, collaborative frameworks lay groundwork for long-term participation in the structural biology and molecular modeling techniques industry.

Regulatory Landscape
Regulatory scrutiny for structural biology and molecular modeling increasingly focuses on validation, governance, and traceability of AI and other in-silico outputs across the development lifecycle. The FDA January 2025 draft guidance on AI to support regulatory decision-making for drugs and biologics sets a formal frame for using AI-generated evidence in submissions, driving sponsors and software providers toward documented fit-for-purpose validation, transparency, and risk management. In Europe, the EMA September 2024 reflection paper on AI in the medicinal product lifecycle reinforces similar expectations across development stages and raises governance requirements for model performance monitoring and updates.
Alongside regulator guidance, data and reporting standards that support reproducibility and auditability are becoming more important for computed and integrative structures. Community-led frameworks such as ModelCIF and the wwPDB Integrative/Hybrid Methods (PDB-IHM) standards support FAIR-style reuse for computed and experimental-plus-computational structures, which helps enable cross-organization collaboration and regulator-facing documentation. Taken together, regulator principles and maturing structure-data standards increase the value of platforms that provide provenance, version control, and traceable pipelines from raw experimental inputs (for example cryo-EM) through modeled structures and into downstream simulation and decision-making artifacts.
Competitive Landscape
Moderate concentration defines the current field, with the top five providers controlling a sizeable yet not dominant portion of spend. Schrödinger, Dassault BIOVIA, and Certara extend enterprise footprints by fusing AI accelerators with established physics engines. Their shift to partnership-based drug development echoes the multi-year Novartis pact that aligns milestone payments with pipeline progress rather than license volume. These hybrid arrangements embed software expertise deep within client R&D, locking in workflow reliance.
Disruptors capitalize on quantum hardware advancements, touting orders-of-magnitude speedups for electronic structure problems. Alliances such as the QuEra-Quantum Intelligence pact aim to commercialize gate-based routines that bypass scaling limits of classical HPC nodes. Open-source movements further dilute entry barriers; community-maintained packages orchestrate distributed GPU clouds at marginal cost, appealing to cash-constrained academics and start-ups.
Compliance credentials emerge as competitive currency. Vendors that align toolchains with FDA MIDD and EMA AI reflection guidance save clients downstream validation expense. Feature roadmaps increasingly embed model governance dashboards, version-controlled provenance, and audit logs. Pricing tilts toward usage-based meters, mirroring cloud economics and enabling elastic deployment across widely varying portfolio sizes in the structural biology and molecular modeling techniques market.
Structural Biology And Molecular Modeling Techniques Industry Leaders
Agilent Technologies, Inc.
Dassault Systèmes (BIOVIA)
Thermo Fisher Scientific Inc.
Schrödinger Inc.
Certara.
- *Disclaimer: Major Players sorted in no particular order

Structural Biology And Molecular Modeling Techniques Market Companies Covered in this Report
- Schrödinger Inc.
- Dassault Systèmes (BIOVIA)
- Thermo Fisher Scientific
- Agilent Technologies
- Illumina
- Bruker
- Chemical Computing Group
- PerkinElmer Informatics
- Certara
- OpenEye Scientific
- Acellera
- Biomax Informatics
- Charles River
- HORIBA
- CD BioSciences
- Agile Molecule
- BioSolveIT
- Simulations Plus
- Genedata
- Q-Chem Inc.
Read Analysis of Structural Biology And Molecular Modeling Techniques Companies

Market Opportunities and Future Outlook
A clear whitespace remains in end-to-end, experiment-guided modeling workflows that link high-resolution structural data streams (cryo-EM, NMR, crystallography) with molecular modeling and AI, so teams can work with ensembles and conformational landscapes rather than single static structures. Recent academic progress supports this direction: experiment-guided AlphaFold3 approaches reported in June 2026 focus on producing measurement-consistent protein ensembles for crystallography, NMR, and cryo-EM, while CryoARC (May 2026) combines evolutionary sequence representations with single-particle cryo-EM images to reconstruct continuous conformational landscapes. These developments increase the relevance of commercial platforms that can manage data provenance, integrate structure generation with docking and free-energy calculations, and streamline collaboration in cloud-native environments.
Another opportunity involves expanding beyond protein structure prediction into controllable design and large-scale screening that maps directly to drug discovery workloads. Promera (June 2026, preprint) shows a unified generative approach that connects all-atom prediction to controllable design use cases such as stabilizing GPCRs and designing VHH binders, while V-SYNTHES2 (July 2026) targets structure-based virtual screening across giga-scale chemical spaces. On commercialization signals, Latent Labs disclosed a USD 50 million financing round in February 2025 to advance its Latent-X protein binder model, and established vendors such as Schrödinger continue to package modeling as target enablement services, reflecting buyer demand for outcome-oriented engagements that bridge AI-predicted structures with experimentally supported protein-ligand hypotheses.
Recent Industry Developments in Structural Biology And Molecular Modeling Techniques Market
- July 2026: Agilent expanded its Altura portfolio with inert size exclusion and PLRP-S columns for biotherapeutic analysis. The update strengthens upstream and downstream characterization workflows that complement structure-led development programs, where high-quality analytical data supports model validation and iterative design loops.
- March 2026: Thermo Fisher Scientific opened a Cryo-Electron Microscopy (cryo-EM) Drug Discovery Center in South San Francisco to broaden access to structural biology capabilities for innovators. Expanding regional access to high-end cryo-EM infrastructure increases the volume and quality of inputs used in molecular modeling and AI-driven structure workflows.
- November 2025: Dassault Systemes (BIOVIA) released BIOVIA Discovery Studio 2026 with enhancements such as improved RCSB Structure Search integration and pocket detection protocols. The release reinforces the push toward unified, production-grade environments that connect structure search, binding-site analysis, and downstream modeling tasks within a single platform.


Structural Biology And Molecular Modeling Techniques Market Report Scope and Research Methodology
Market Definition and Coverage
This market covers revenues generated from structural biology workflows and molecular modeling techniques used to study biomolecular structure and behavior, and then support research decisions in drug discovery and drug development.
Scope exclusions: This sizing excludes general wet-lab supplies that are not specific to structural determination or modeling workflows, and it also excludes routine IT infrastructure not sold for these research use cases.
Segments Covered in This Report
- By Tool
- Software-as-a-Service (SaaS) & Stand-alone Platforms
- Homology Modeling
- Threading / Fold Recognition
- Molecular Dynamics Simulation
- Quantum-mechanical / Hybrid Methods
- Visualization & Analysis Suites
- Other Tools
- Software-as-a-Service (SaaS) & Stand-alone Platforms
- By Application
- Drug Discovery
- Drug Development / Lead Optimization
- Protein Engineering & Synthetic Biology
- Other Applications
- By End-User
- Pharmaceutical & Biotech Companies
- Contract Research Organizations
- Academic & Government Institutes
- Software Vendors & Platform Providers
- By Geography
- North America
- United States
- Canada
- Mexico
- Europe
- Germany
- United Kingdom
- France
- Italy
- Spain
- Rest of Europe
- Asia-Pacific
- China
- Japan
- India
- Australia
- South Korea
- Rest of Asia-Pacific
- Middle East and Africa
- GCC
- South Africa
- Rest of Middle East and Africa
- South America
- Brazil
- Argentina
- Rest of South America
- North America
Data Sources, Market Sizing, and Validation
Desk Research
Desk research was used to frame the demand pool and keep assumptions tied to measurable signals. We referenced public sources such as NIH and NSF funding releases, FDA drug approvals and guidance updates, OECD health and R&D indicators, and protein structure repository statistics (including PDB usage and deposition trends) to understand what is expanding in the research ecosystem.
On the supply side, pricing and adoption context was built using company annual reports, investor presentations, product brochures, and reputable science press coverage. In addition, we used paid subscriptions for company financials and intelligence, patent database checks, and news and financials screening to track product launches, M&A activity, and packaging changes that can alter average selling prices. These examples are not exhaustive, and many other sources were also used for data collection, validation, and clarification during the research process.
Primary Interviews and Surveys
Primary work was used to pressure test the sizing logic and to fill gaps that desk sources do not answer well, such as how tools are bundled, what typical renewal or license patterns look like, and which applications are gaining share. We spoke with a mix of instrument and software ecosystem participants, end users in biopharma and academic labs, and service providers, while ensuring coverage across major regions so pricing and adoption assumptions were not anchored to one geography.
Distribution of primary research fieldwork respondents
| Company type | Respondent position | Region |
|---|---|---|
| Top tier: 29% | CXOs: 13% | APAC: 46% |
| Mid tier: 57% | Functional/Unit leaders: 36% | EMEA: 32% |
| Smaller Players: 14% | Managers: 51% | Americas: 22% |
Market-Sizing & Forecasting
The core model was built using a top-down approach where global life-science R&D activity was reconstructed into a reachable spend pool for structural determination and molecular modeling, and then filtered by adoption levels across key end-use settings. Once the demand pool was shaped, we allocated spend based on technique intensity in drug discovery and development programs, and we checked totals using selective bottom-up approximations, including sampled price points by tool category and volume proxies from channel discussions.
Inputs used in the model included, as examples, biopharma R&D spending trends, growth in structure deposits and access patterns in major repositories, the pace of new modality pipelines that rely on structure-guided design, average license and subscription price ranges by tool type, and utilization levels for higher-end structural workflows. Where a bottom-up cross-check was weak due to limited disclosure, we handled gaps using conservative ranges that were then narrowed using interview feedback.
For forecasting, scenario analysis was applied so adoption and pricing could move differently under a base case versus a faster software-led mix shift. The final growth curve was aligned to expert consensus on how quickly modeling and analysis tools are being embedded into routine workflows and how budgets behave during funding cycles.
Data Validation & Update Cycle
Outputs were validated through several passes that compare the model against independent signals, including funding momentum, pipeline activity, and the direction of list pricing and discounting patterns shared in interviews. Outliers were flagged, reviewed, and either corrected or explained through a documented assumption, and then the full workbook was checked by a second analyst before sign-off.
Reports are refreshed annually, and interim updates are made when material events occur, such as major product releases, pricing model changes, or meaningful shifts in funding conditions. Before delivery, a final review is completed so the client receives the latest view with assumptions and currency timing brought up to date.
Mordor Intelligence's Structural Biology and Molecular Modeling Techniques Market Size Compared Against Other Published Estimates
Published estimates for this market can look far apart because different studies do not always count the same revenue streams, and they also pick different base years and forecasting windows. In practice, the biggest differences usually come from what is treated as a technique-specific tool versus a broader research expense, and from how pricing is carried forward when software subscriptions and bundled offerings are common.
A refresh-led issue is that currency timing and price updates can materially move the total in years with frequent product packaging changes, and this is where the annual refresh and variance checks applied in Mordor Intelligence help keep the model aligned to current list prices, discount ranges, and the latest demand signals from interviews.
Benchmark comparison
| Source | Market Size | Gaps in Research Methodology |
|---|---|---|
| Mordor Intelligence | USD 11.90 B (2026) | |
| Global Consultancy A | USD 8.13 B (2024) | Uses an earlier base year and a shorter window, and the scope appears more weighted to select tool categories, which can understate totals when subscription and database revenues are counted differently. |
| Industry Publisher B | USD 10.28 B (2025) | Reports a different base year with a faster implied step-up, and its treatment of bundled pricing and currency conversion timing can shift the starting value versus a model that updates ASPs closer to the publication date. |
Overall, the spread is mainly explained by timing choices and by how each publisher treats bundled software, databases, and technique-adjacent spending. By anchoring the total to a defined demand pool and then cross-checking with price and adoption inputs, we can present a number that is easier to trace back to clear variables and repeatable steps.


Key Questions Answered in the Report
What is the current value of the structural biology and molecular modeling techniques market?
The market is valued at USD 11.9 billion in 2026 and is forecast to reach USD 24.3 billion by 2031.
Which tool segment is expanding the fastest?
Visualization and analysis suites are advancing at a 16.24% CAGR through 2031.
How large is the share held by pharmaceutical and biotech companies?
These companies account for 61.34% of total 2025 spending.
Why is Asia-Pacific growing faster than other regions?
Government-backed quantum computing investments and expanded cryo-EM capacity propel the region at a 16.21% CAGR.
How do regulatory agencies view AI-driven modeling evidence?
FDA and EMA guidance documents issued in 2024-2025 position validated AI outputs as acceptable primary evidence in submissions.
What collaboration models are becoming common between software vendors and drug developers?
Multi-year, outcome-based partnerships like the USD 2.3 billion Schrödinger-Novartis deal embed software teams inside discovery programs to co-own pipeline milestones.
Page last updated on:


 Your data is secure and never sold or shared.


