
Stroke Therapeutics Market Size and Share
Market Overview
| Study Period | 2020 - 2031 |
|---|---|
| Market Size (2026) | USD 4.87 Billion |
| Market Size (2031) | USD 7.20 Billion |
| Growth Rate (2026 - 2031) | 8.13 % |
| Fastest Growing Market | Asia-Pacific |
| Largest Market | North America |
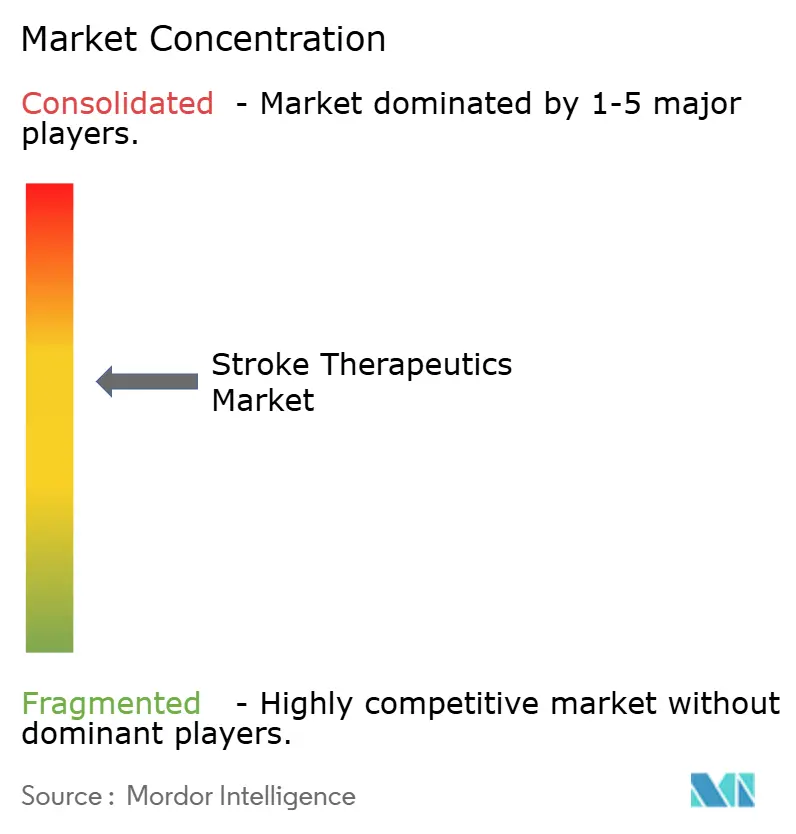
| Market Concentration | Medium |
Major Players.webp) *Disclaimer: Major Players sorted in no particular order Image © Mordor Intelligence. Reuse requires attribution under CC BY 4.0. | |
Stroke Therapeutics Market Analysis by Mordor Intelligence
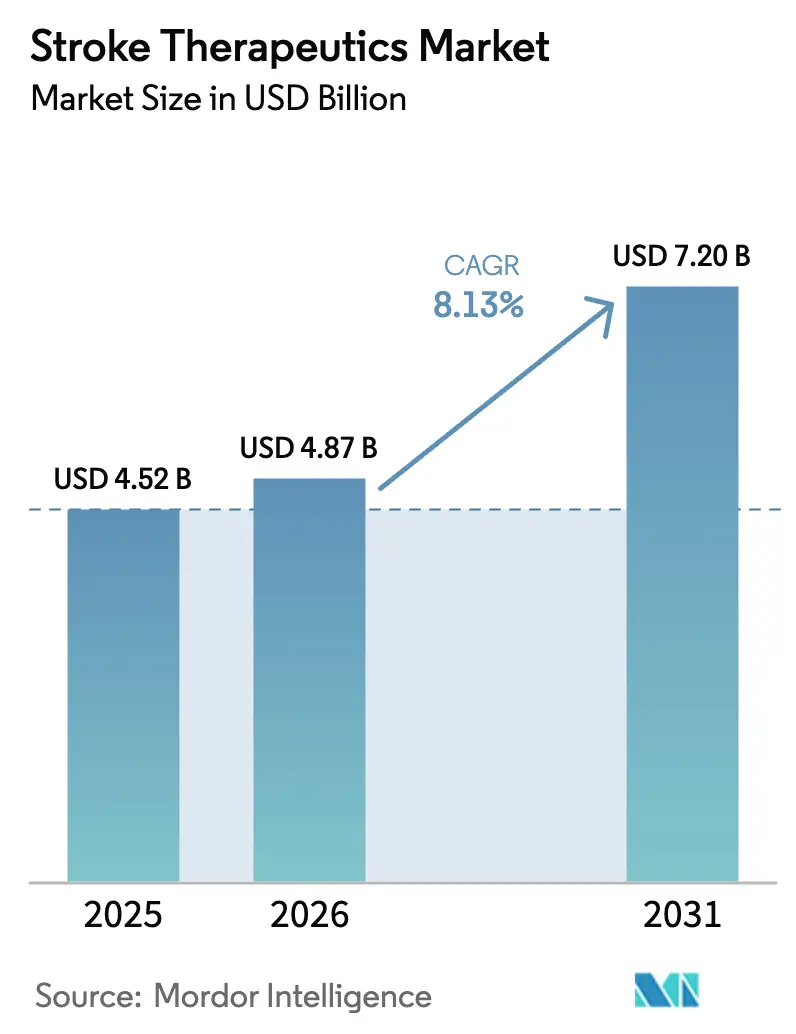
The stroke therapeutics market size is estimated to reach USD 4.87 billion in 2026, and is projected to climb to USD 7.20 billion by 2031, at a CAGR of 8.13% during the forecast period (2026-2031). Demographic aging, rapid guideline shifts that tighten blood-pressure targets, and technology-enabled hyper-acute triage are coalescing to keep the stroke therapeutics market on a steady growth path. The robust adoption of direct oral anticoagulants supports steady revenue growth, even as generic erosion reshapes the older antiplatelet categories. Meanwhile, AI-supported imaging platforms, gene-based neuroprotective programs, and mobile stroke units are expanding the treatment window, increasing the eligible patient pool, and driving demand across the stroke therapeutics market. Continued reimbursement alignment for thrombolytic agents, coupled with productivity pressures from the USD 56.5 billion annual U.S. stroke cost burden, further strengthens the economic rationale for advanced pharmacologic options.
Key Report Takeaways
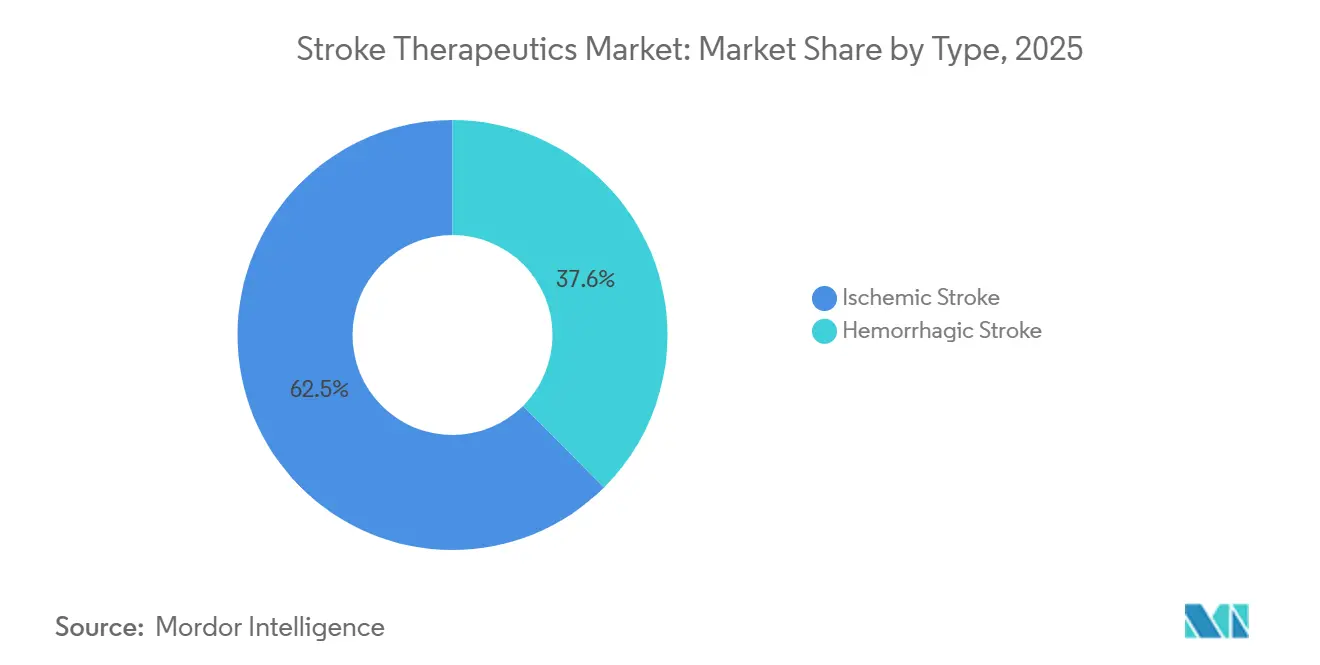
- By type, ischemic stroke led with 62.45% of the stroke therapeutics market share in 2025. Hemorrhagic stroke is forecast to advance at a 10.35% CAGR to 2031.
- By drug class, antithrombotic agents commanded 42.45% share of the stroke therapeutics market size in 2025. Antihypertensive agents are projected to rise at a 10.21% CAGR through 2031.
- By route of administration, oral formulations captured 55.67% revenue in 2025, while intravenous delivery is growing at a 10.65% CAGR.
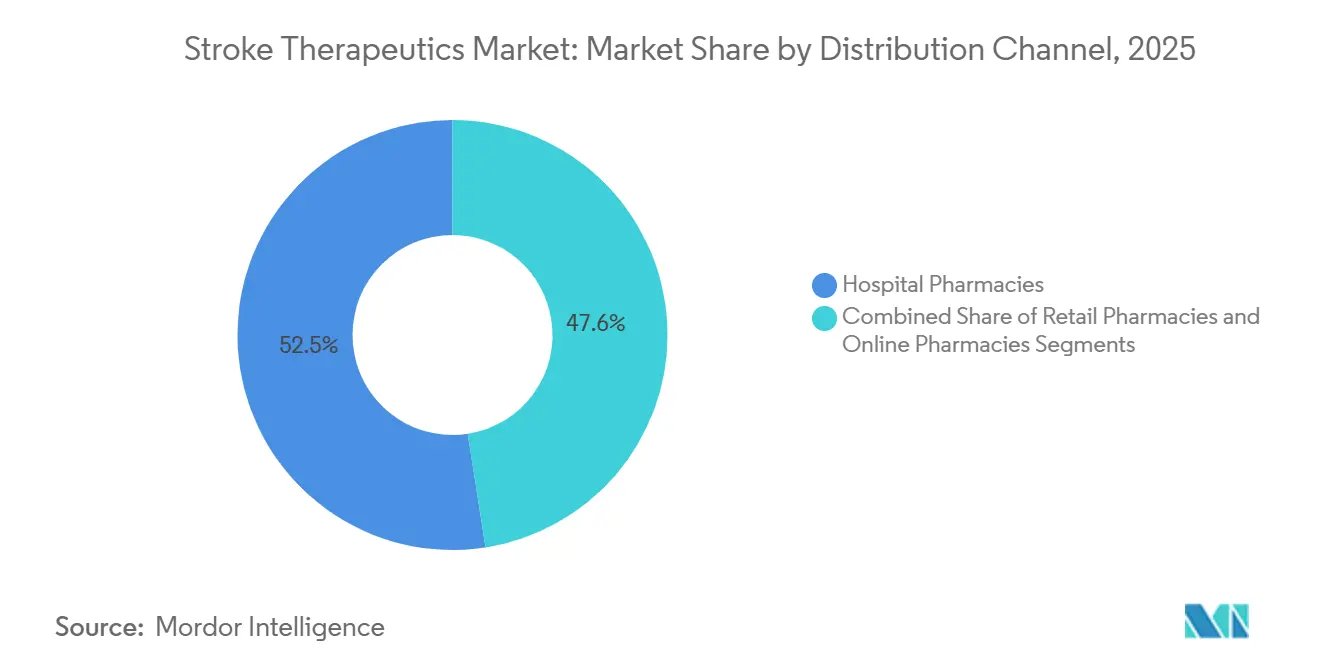
- By distribution channel, hospital pharmacies held 52.45% revenue share in 2025; online pharmacies are expanding at an 11.54% CAGR.
- By end user, hospitals accounted for 55.43% of the stroke therapeutics market size in 2025, whereas ambulatory surgical centers are expected to post an 11.34% CAGR.
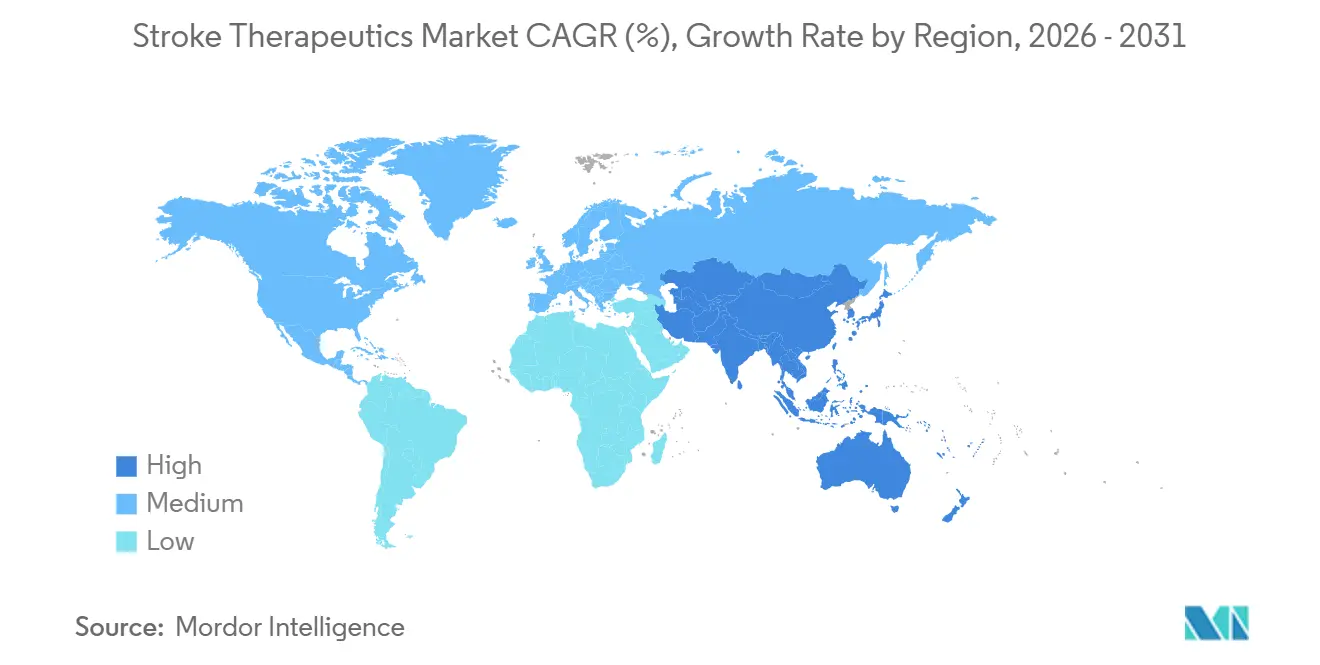
- By geography, North America accounted for 41.35% of the revenue share in 2025; the Asia-Pacific region is projected to grow at a 9.54% CAGR from 2026 to 2031.
Note: Market size and forecast figures in this report are generated using Mordor Intelligence’s proprietary estimation framework, updated with the latest available data and insights as of January 2026.
Market Trends and Insights
Drivers Impact Analysis of Stroke Therapeutics Market*
| Driver | (~) % Impact on CAGR Forecast | Geographic Relevance | Impact Timeline |
|---|---|---|---|
| Rising Prevalence of Stroke in Aging Population | +2.1% | Global, highest in North America, Europe, Asia-Pacific | Long term (≥ 4 years) |
| Increasing Investments in R&D and Advanced Therapies | +1.8% | North America & EU, spill-over to Asia-Pacific | Medium term (2-4 years) |
| Favorable Reimbursement Policies for Thrombolytic Agents | +1.3% | North America, Western Europe | Short term (≤ 2 years) |
| Emergence of Gene-Based Neuroprotective Platforms | +1.2% | North America & EU, early Japan adoption | Long term (≥ 4 years) |
| AI-Enabled Hyper-Acute Stroke Triage Systems | +1.0% | Global, early gains in U.S., China, Germany | Medium term (2-4 years) |
| Expansion of Mobile Stroke Units in Emerging Markets | +0.9% | Asia-Pacific core, spill-over to MEA and South America | Medium term (2-4 years) |
| Source: Mordor Intelligence | |||
Rising Prevalence of Stroke in the Aging Population
Worldwide, the share of people aged ≥60 years will double between 2015 and 2050, and stroke risk doubles every decade after 55[1]. In the United States alone, about 795,000 strokes occur yearly, 610,000 of them first-ever events. Co-morbid hypertension, atrial fibrillation, and diabetes magnify demand for preventive anticoagulants and antihypertensives. Japan’s population already skews old, with 29% of the population aged 65 or older in 2024, resulting in high prescription volumes for secondary prevention medicines. The U.S. FDA's fast-track mechanisms are streamlining the development of geriatric-appropriate formulations that recognize the altered pharmacokinetics in older adults.
Increasing Investments in R&D and Advanced Therapies
Biopharmaceutical pipelines list more than 100 active stroke programs, backed by NIH’s USD 218 million stroke research allocation in FY 2024[2]. Focus areas range from NMDA antagonists to stem-cell implants, aiming to lengthen or bypass the narrow 4.5-hour thrombolytic window. PhRMA notes that stroke joins Alzheimer’s and Parkinson’s as top neuro priorities, driving capital into cell-based regeneration platforms. Late-stage attrition remains high; however, the commercial upside of a first-in-class neuroprotectant continues to drive strong investor appetite.
Favorable Reimbursement Policies for Thrombolytic Agents
CMS reimburses tissue plasminogen activators under value-based models that reward door-to-needle times under 60 minutes[3]. Payment parity for tenecteplase, now guideline-endorsed as an alternative to alteplase, is accelerating switch momentum. Private payers are increasingly tying reimbursement to functional outcome metrics, prompting hospitals to deploy streamlined imaging and pre-notification protocols that increase thrombolytic utilization.
Emergence of Gene-Based Neuroprotective Platforms
Regenerative Medicine Advanced Therapy designations from the FDA are accelerating the development of cell and gene candidates that promise durable neuroprotection. EMA’s advanced therapy medicinal product pathway offers similar support. Investigational mesenchymal stem cell infusions aim to enhance neurogenesis and mitigate inflammation beyond the hyperacute window. Developers must still confirm long-term functional gains on modified Rankin outcomes, a hurdle that has stymied earlier neuroprotectant hopefuls.
Restraints Impact Analysis of Stroke Therapeutics Market*
| Restraint | (~) % Impact on CAGR Forecast | Geographic Relevance | Impact Timeline |
|---|---|---|---|
| Patent Expiries Accelerating Generic Erosion | -1.4% | Global, pronounced in North America & Europe | Short term (≤ 2 years) |
| High Cost of Novel Biologics | -0.9% | Global, acute in emerging markets | Medium term (2-4 years) |
| Limited Cross-Border Cold Chain | -0.6% | Global, critical in Asia-Pacific and MEA | Long term (≥ 4 years) |
| Physician Skepticism Toward DAPT De-Escalation | -0.5% | North America, Europe, select Asia-Pacific | Medium term (2-4 years) |
| Source: Mordor Intelligence | |||
Patent Expiries Accelerating Generic Erosion
Clopidogrel and multiple direct oral anticoagulants are losing exclusivity, triggering price drops of over 80% within the first year of generics. While generics widen access, they compress revenue, prompting originators to adopt novel mechanisms and fixed-dose combinations. Apixaban’s initial generic entries in 2024 exemplify the looming revenue cliff.
High Cost of Novel Biologics
Cell and gene platforms can exceed USD 500,000 per patient, straining payer budgets. ICER assessments frequently flag affordability concerns, leading to outcomes-based contracts or delayed coverage. In low-income regions, the WHO’s Essential Medicines List still excludes high-priced biologics, resulting in minimal usage.
*Our forecasts treat driver/restraint impacts as directional, not additive. The impact forecasts reflect baseline growth, mix effects, and variable interactions.
Stroke Therapeutics Market Segment Analysis
By Type:
Ischemic Dominance Reflects Epidemiologic RealityIschemic stroke controlled 62.45% of the stroke therapeutics market in 2025, mirroring its 87% share of global stroke incidence. The stroke therapeutics market size for ischemic interventions is buoyed by widespread alteplase protocols and expanding thrombectomy eligibility. Tenecteplase adoption adds convenience, reducing nursing workload. Secondary prevention relies heavily on dual antiplatelet and direct oral anticoagulant regimens, anchoring recurring revenue.
Hemorrhagic stroke, though smaller, is projected to post a 10.35% CAGR, the fastest within the stroke therapeutics market. Novel reversal agents such as andexanet alfa address anticoagulant-related bleeds, while minimally invasive evacuation devices enhance outcomes. As Asian populations age and hypertension prevalence climbs, absolute hemorrhagic volumes support lucrative regional opportunities.

By Drug Class:
Antithrombotics Anchor Market, Antihypertensives Gain MomentumAntithrombotic agents represented 42.45% of the stroke therapeutics market size in 2025, driven by guideline-mandated lifelong prevention. Direct oral anticoagulants continue to outpace warfarin due to their fixed dosing and the elimination of routine monitoring. However, approaching patent cliffs bring generics that will redistribute value across the stroke therapeutics market.
Antihypertensives are on track for a 10.21% CAGR, reflecting tighter AHA target thresholds below 130/80 mmHg. Combination pills improve adherence and fuel premium pricing. For payers, sustained blood-pressure control offers proven stroke risk reduction, supporting favorable formulary placement.
By Route of Administration:
Oral Dominates Chronic Care, IV Serves Acute NeedsOral agents captured 55.67% revenue in 2025, underpinned by chronic secondary prevention. Nonetheless, intravenous formulations are expanding at a 10.65% CAGR as door-to-needle initiatives drive higher alteplase and tenecteplase penetration. The stroke therapeutics market share for IV lines also benefits from peri-thrombectomy antithrombotic adjuncts administered in the hospital.
By Distribution Channel:
Hospital Pharmacies Dominate, Digital Channels EmergeHospital pharmacies held 52.45% of 2025 revenue - accreditation programs such as The Joint Commission mandate immediate availability of thrombolytics, ensuring steady institutional demand. Meanwhile, online pharmacies are expected to experience double-digit growth, reflecting post-COVID consumer comfort with mail-order refills and tele-management of chronic diseases.
By End User:
Hospitals Anchor Acute Care, Outpatient Centers RiseHospitals generated 55.43% of the stroke therapeutics market size in 2025. Comprehensive stroke centers stock reversal agents, neuroprotective candidates, and adjunct anticoagulants. Ambulatory surgical centers, growing at an 11.34% CAGR, benefit from the migration of carotid stenting to outpatient settings, which boosts the per-procedure pharmaceutical pull-through.
Geography Analysis
North America Stroke Therapeutics Market
North America accounted for 41.35% of the revenue in 2025. Regional stroke networks, CMS value-based purchasing, and broad insurance coverage facilitate the uptake of premium drugs. Canada follows similar universal-coverage pathways, albeit with province-specific formularies.
Europe Stroke Therapeutics Market
Europe contributes a consistent share, guided by EMA centralized approvals and national health systems that guarantee access to essential stroke drugs. The European Stroke Organisation harmonizes best practices, while individual countries fine-tune reimbursement according to cost-effectiveness dossiers.
APAC Stroke Therapeutics Market
The Asia-Pacific region is the fastest-growing, with a 9.54% CAGR. China’s basic medical insurance now lists generic direct oral anticoagulants, widening access. India’s National Programme for Prevention and Control of Cancer, Diabetes, Cardiovascular Diseases, and Stroke funds regional hub-and-spoke stroke units, fostering demand for acute thrombolytics. Japan maintains high penetration of premium therapies thanks to ageing demographics and generous reimbursement.
Regulatory Landscape
Regulation in stroke therapeutics is shaped by fast-moving clinical standards for hyperacute care and by accelerated pathways for high-need candidates. In the United States, the FDA approval of Genentech's TNKase (tenecteplase) for acute ischemic stroke in March 2025 reinforced a practical preference for simpler administration and standardized hospital protocols. In 2026, the American Heart Association/American Stroke Association issued an updated guideline for early management of acute ischemic stroke that continues to influence real-world treatment algorithms and formulary decisions.
In Europe, EMA and European Commission lifecycle rules and centralized assessments tighten the linkage between evidence packages and post-approval management. The EC Variations Guidelines effective January 15, 2026, apply to all EU variation applications and streamline lifecycle management, which is relevant for established antithrombotics and thrombolytics undergoing labeling and manufacturing updates. On June 10, 2026, the EMA validated and began assessing Bayer's marketing authorization application for asundexian (FXIa inhibitor) for secondary prevention of ischemic stroke. The agency also granted Argenica Therapeutics a product-specific paediatric waiver for ARG-007 on February 3, 2026, reducing pediatric study burden for an adult-prevalent indication.
Value Chain Analysis
The stroke therapeutics value chain spans discovery and clinical development (including trial networks and imaging-enabled patient selection), API and excipient sourcing, and finished-dose manufacturing. The supply chain also shows a pronounced split between oral chronic-care drugs and sterile injectables for hyperacute use, followed by quality release and distribution through hospital pharmacies for acute agents and retail/online channels for maintenance therapies. For acute ischemic stroke care, supply assurance and rapid availability at stroke centers are central procurement criteria, while quality systems for sterile injectables become a gating factor for hospital formulary participation.
Manufacturing and supply resilience remain key constraints, particularly for sterile injectables where cGMP qualification, aseptic processing, and packaging compatibility testing are cost- and time-intensive. The FDA's April 2026 decision to decline approval for Grace Therapeutics' GTx-104 (injectable nimodipine) on chemistry, manufacturing, and controls deficiencies (including packaging-related leachables and issues at a contract manufacturing organization) highlights how CMC readiness can delay market entry even when clinical positioning is established. Broader dependence on concentrated sources for pharmaceutical inputs and limited global capacity for critical injectables amplifies risk management needs across sourcing redundancy planning and batch-release continuity for stroke care pathways.
Competitive Landscape
The stroke therapeutics market remains moderately fragmented. Bristol-Myers Squibb and Pfizer’s apixaban franchise remains the leader in the anticoagulant segment but faces generic competition after 2024. Boehringer Ingelheim’s dabigatran pioneered the direct oral anticoagulant era yet now competes on pricing.
Emerging biotechs, such as Athersys and ReNeuron, are advancing cell-based neurorestorative programs in Phase III trials. FDA Breakthrough Therapy and EMA PRIME designations shorten pathways for first movers. Digital health entrants, such as Viz.ai, commercialize algorithmic triage platforms that enhance drug utilization and create partnership opportunities with pharmaceutical companies.
Strategic collaboration remains the dominant competitive theme, with large incumbents licensing new mechanisms, generics preparing for anticoagulant cliff events, and technology vendors integrating diagnostic software with hospital formularies. The market is moderately concentrated, with the top five companies commanding about two-thirds of global revenue. Ongoing venture funding and regulatory support facilitate a steady flow of innovative therapies and digital tools set to reshape the treatment landscape over the next five years.
Stroke Therapeutics Industry Leaders
-
Boehringer Ingelheim International GmbH
-
Bristol-Myers Squibb Company
-
F. Hoffmann La Roche Ltd.
-
Johnson & Johnson
-
Pfizer Inc
- *Disclaimer: Major Players sorted in no particular order
Stroke Therapeutics Market Companies Covered in this Report
- Abbott Laboratories
- Amgen
- Athersys, Inc.
- Bayer
- Biogen
- Boehringer Ingelheim
- Bristol-Myers Squibb
- CSL Behring
- Daiichi Sankyo
- Roche
- Genentech
- Johnson & Johnson
- Merck
- Pfizer
- Portola Pharmaceuticals
- ReNeuron Group
- Sanofi
- Takeda Pharmaceuticals
Market Opportunities and Future Outlook
Workflow-driven acute care opportunities are expanding around therapies and technologies that reduce time-to-treatment and simplify administration in emergency settings. The FDA approval of Genentech's TNKase in March 2025 supports adoption of single-bolus thrombolysis models that ease nursing burden compared with longer infusions. In June 2026, Penumbra's THUNDERBOLT computer-assisted vacuum thrombectomy device received FDA clearance and a CE mark in Europe, adding another reference point for protocol standardization in large-vessel occlusion pathways.
Secondary prevention is the second opportunity layer as next-generation anticoagulation programs move through late-stage and regulatory review. Bayer disclosed full Phase III OCEANIC-STROKE results for asundexian in April 2026 (published in The New England Journal of Medicine) and received FDA Priority Review in May 2026 for secondary prevention after non-cardioembolic ischemic stroke or transient ischemic attack, while the EMA initiated assessment of the asundexian application in June 2026. In parallel, post-approval access and adherence initiatives around major antithrombotics (including programs linked to the apixaban franchise) and the growth of online pharmacy refills for chronic secondary prevention create room for patient support, persistence tools, and payer-aligned contracting, particularly in markets where generic erosion is already compressing legacy antiplatelet value.
Recent Industry Developments in Stroke Therapeutics Market
- May 2026: Boehringer Ingelheim launched Metalyse 25 mg (tenecteplase) in South Korea for the treatment of acute ischemic stroke. The move broadens access to bolus thrombolysis outside North America and supports faster in-hospital administration workflows versus infusion-based regimens.
- November 2025: Bristol Myers Squibb, together with Johnson and Johnson, reported that the Librexia clinical program continued as planned, including the Phase 3 Librexia STROKE study for secondary stroke prevention. Maintaining the program timeline keeps FXIa inhibition as a visible competitive lane in next-generation antithrombotics for stroke prevention.
- May 2024: Argenica Therapeutics recruited the first patients into a Phase 2 clinical trial of ARG-007, a neuroprotective therapy designed to reduce brain tissue damage after stroke. Early clinical progress in neuroprotection adds pipeline depth beyond antithrombotic-centric approaches and signals continued translational activity from Australian research partnerships.
Stroke Therapeutics Market Report Scope and Research Methodology
Market Definition and Coverage
This market covers prescription drug therapies used to treat and prevent stroke in clinical care, measured as manufacturer level revenues from products used in acute care and follow on prevention.
Scope exclusions: Excluded from this sizing are diagnostic tests, imaging systems, rehabilitation devices, and non-therapeutic hospital procedures that do not generate drug sales.
Segments Covered in This Report
- By Type
- Ischemic Stroke
- Hemorrhagic Stroke
- By Drug Class
- Antithrombotic Agents
- Neuroprotective Biologics
- Antihypertensive Agents
- Anti-Inflammatory & Antioxidants
- By Route of Administration
- Oral
- Intravenous
- Intra-arterial
- Subcutaneous / Intramuscular
- By Distribution Channel
- Hospital Pharmacies
- Retail Pharmacies
- Online Pharmacies
- By End-User
- Hospitals
- Specialty Clinics
- Ambulatory Surgical Centers
- Other End-Users
- Geography
- North America
- United States
- Canada
- Mexico
- Europe
- Germany
- United Kingdom
- France
- Italy
- Spain
- Rest Of Europe
- Asia-Pacific
- China
- Japan
- India
- South Korea
- Australia
- Rest Of Asia-Pacific
- Middle East And Africa
- GCC
- South Africa
- Rest Of Middle East And Africa
- South America
- Brazil
- Argentina
- Rest Of South America
- North America
Data Sources, Market Sizing, and Validation
Desk Research
We start by mapping the treated stroke population and care pathways using public clinical and epidemiology references, which helps keep the model aligned with real demand. Typical desk inputs include stroke incidence and mortality series from sources such as the World Health Organization, burden of disease publications, and national public health agencies such as the CDC, plus similar bodies in Europe and APAC.
Pricing and utilization context is then pulled from public reimbursement and policy sources, along with peer reviewed journals that discuss thrombolysis timing, antiplatelet use, and secondary prevention patterns. We also review drug labels and safety updates from regulators such as the FDA and EMA, plus association material from heart and stroke societies, to track guideline shifts that can move volumes. To anchor the commercial picture, we use company filings, investor presentations, and credible press coverage, supported by paid subscriptions for company financials, patent databases, and selective import export shipment views where they help validate supply signals. The desk sources listed here are illustrative, and other public and paid references were also used to fill gaps and cross-check assumptions.
Primary Interviews and Surveys
Our primary work focuses on validating the treatment mix and how it changes across countries, settings of care, and patient profiles, where desk sources can be thinner. We speak with clinicians, hospital pharmacists, payers, and distribution side experts across major regions, so pricing logic, uptake timing, and substitution between drug classes are confirmed before the model is finalized.
Distribution of primary research fieldwork respondents
| Company type | Respondent position | Region |
|---|---|---|
| Top tier: 34% | CXOs: 12% | APAC: 49% |
| Mid tier: 52% | Functional/Unit leaders: 42% | EMEA: 29% |
| Smaller Players: 14% | Managers: 46% | Americas: 22% |
Market-Sizing & Forecasting
Sizing is built from a top-down demand pool, where stroke incidence and diagnosed share are translated into treated patients by care setting, followed by therapy class split and an average annual cost of therapy for each class. The model is then stress-tested with selective bottom-up checks such as sampled country level sales proxies, channel feedback on unit movement, and a simple ASP times volume build for a short list of high-use therapies.
Key inputs we use include ischemic versus hemorrhagic case mix, thrombolysis eligibility rates and time-to-treatment patterns, secondary prevention persistence, guideline driven switching between antiplatelets and anticoagulants, and country level pricing and reimbursement differences. When data is missing for smaller countries, we fill gaps using regional analogs based on healthcare spend, access to stroke units, and observed treatment rates from interviews, and we log adjustments before totals are rolled up.
For forecasting, we apply scenario analysis supported by light multivariate checks so the main drivers stay explicit, including aging population trends, access expansion in hospitals, and expected generic impact on ASPs. Where experts flag uncertainty, for example uptake timing or payer restrictions, we keep conservative and aggressive bands and then select the base case that best matches observed utilization signals.
Data Validation & Update Cycle
We validate outputs by comparing implied treated patient counts and the therapy mix against independent clinical utilization signals and published guideline adoption timelines, and then we check whether regional pricing assumptions create unrealistic swings. Any outliers are reviewed in a second analyst pass, and we re-contact interviewees when a variance cannot be explained by a clear policy change, an epidemiology shift, or a pricing factor.
The report is refreshed annually, and interim updates are made when material events occur such as major label changes or reimbursement shifts that can move volumes. Before delivery, a final review is completed so the numbers and assumptions reflect the latest available information.
Mordor Intelligence's Stroke Therapeutics Market Size Compared Against Other Published Estimates
Published market numbers for stroke therapeutics often differ because the counted items can quietly change, and then patient and pricing assumptions are built on top of that. Differences also come from how firms handle acute versus long term therapy use, currency conversion timing, and how often the model is refreshed.
Diagnostics and rehab services sit outside Mordor Intelligence's scope, which reduces the total versus studies that bundle stroke care pathways beyond drug therapy and then report a larger addressable number.
Benchmark comparison
| Source | Market Size | Gaps in Research Methodology |
|---|---|---|
| Mordor Intelligence | USD 4.87 B (2026) | |
| Trade Journal A | USD 10.12 B (2025) | Uses an acute ischemic stroke therapeutics-only lens but applies broad distribution channel totals and faster ASP growth, and the base year differs, which can inflate the near-term value. |
| Industry Portal B | USD 13.75 B (2024) | Bundles prevention drugs and long-term care items with wider stroke care spending, and it is not clear how treated patient counts are separated from total stroke prevalence across regions. |
The spread is mainly explained by what gets counted as therapeutics and how the treated pool is built, followed by different base years and price progression rules. By keeping the demand math tied to treated patients, therapy mix, and country pricing signals, our estimate stays traceable and easier to reproduce when assumptions need updating.
Key Questions Answered in the Report
What revenue level does the stroke therapeutics market target by 2031?
The market is forecast to reach USD 7.20 billion by 2031, reflecting an 8.13% CAGR.
Which stroke type currently drives most therapy sales?
Ischemic stroke leads with 62.45% of global revenue thanks to established thrombolytic and secondary prevention regimens.
Which region shows the fastest growth through 2031?
Asia-Pacific is projected to rise at a 9.54% CAGR, propelled by aging demographics and expanding healthcare infrastructure.
Which drug class is expected to outpace overall market growth?
Antihypertensive agents should expand at a 10.21% CAGR as guidelines push intensive blood-pressure control for survivors.
How are AI tools influencing acute stroke treatment uptake?
AI-enabled imaging shortens diagnosis time by about 20 minutes, enlarging the eligible pool for thrombolytics and boosting drug utilization.
What is the main barrier to cell-based stroke therapies?
Stringent cryogenic distribution requirements and high per-patient costs limit access, especially in low- and middle-income countries.