
Sterilized Packaging Market Size and Share
Market Overview
| Study Period | 2020 - 2031 |
|---|---|
| Market Size (2026) | USD 81.61 Billion |
| Market Size (2031) | USD 117.18 Billion |
| Growth Rate (2026 - 2031) | 7.48 % |
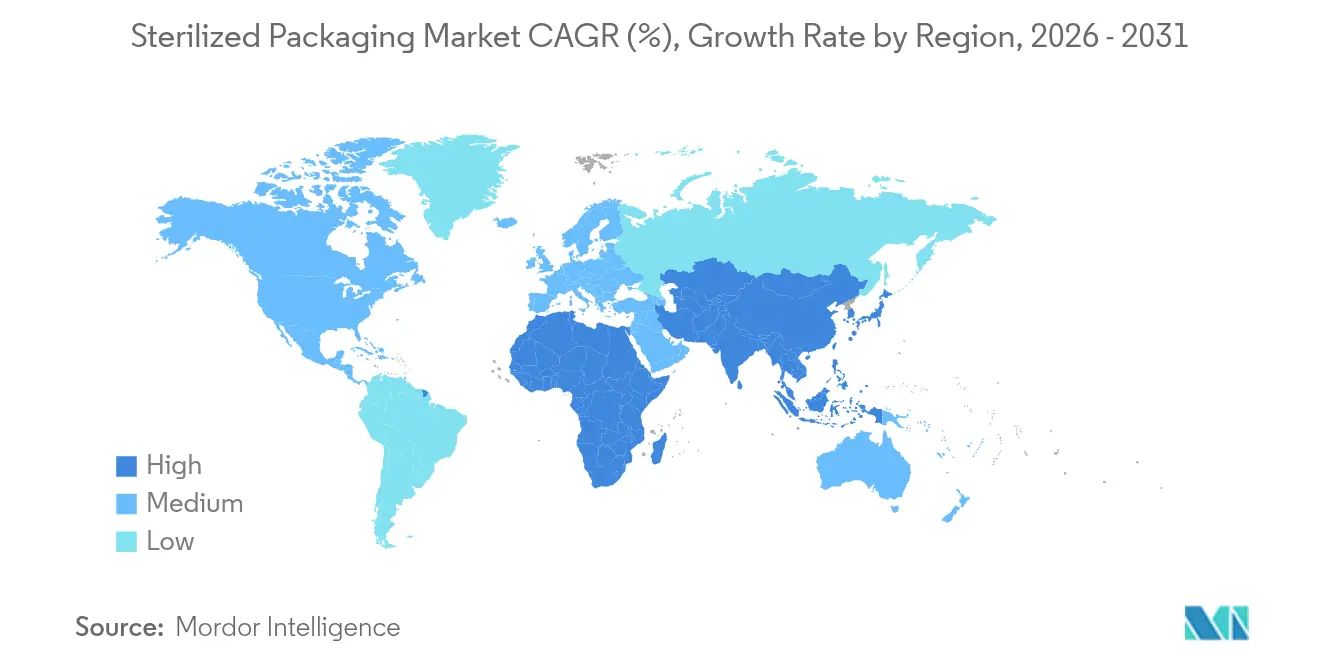
| Fastest Growing Market | Asia Pacific |
| Largest Market | North America |
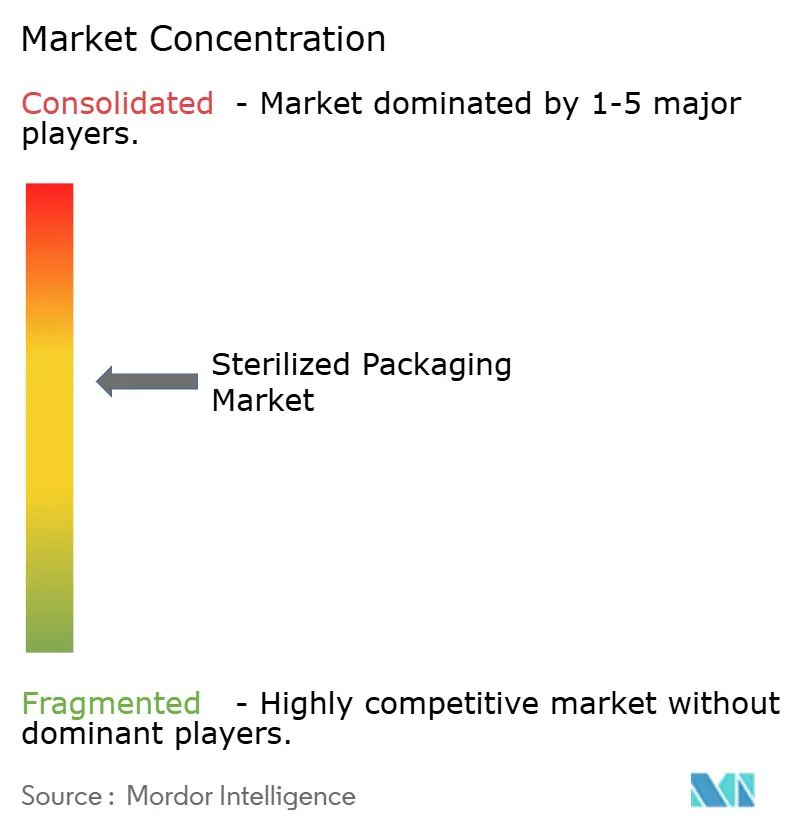
| Market Concentration | Medium |
Major Players *Disclaimer: Major Players sorted in no particular order Image © Mordor Intelligence. Reuse requires attribution under CC BY 4.0. | |
Sterilized Packaging Market Analysis by Mordor Intelligence
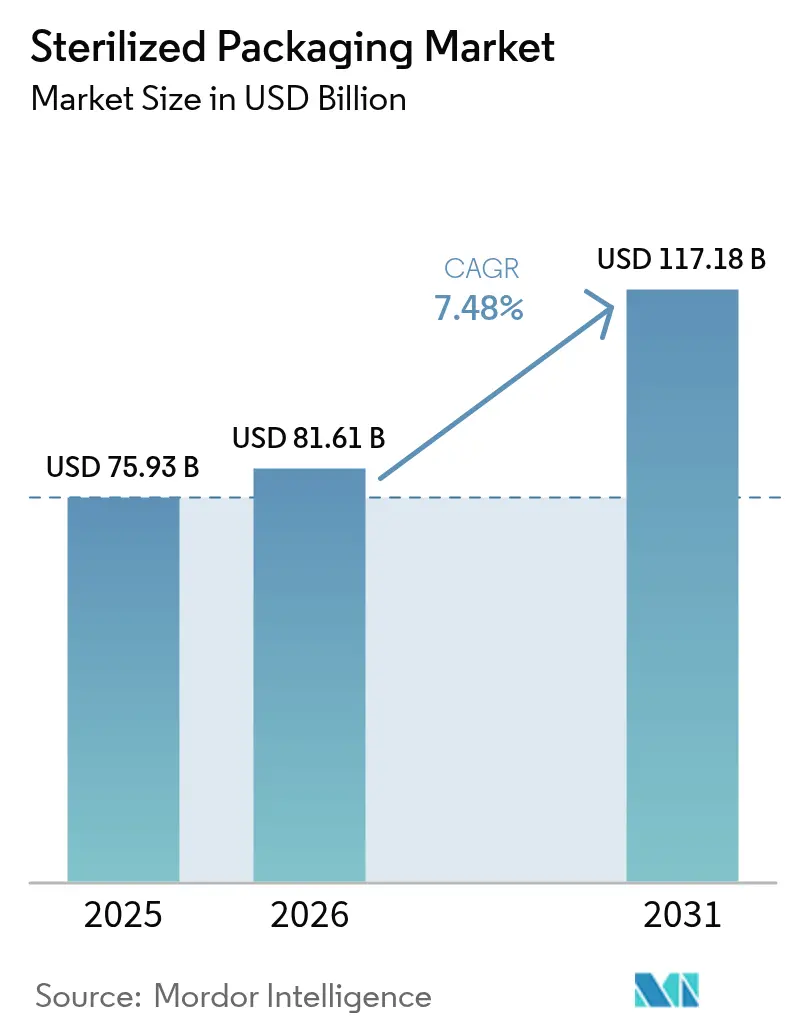
Sterilized packaging market size in 2026 is estimated at USD 81.61 billion, growing from 2025 value of USD 75.93 billion with 2031 projections showing USD 117.18 billion, growing at 7.48% CAGR over 2026-2031. Demand is fueled by stricter global regulations, the growth of biologics manufacturing, and mounting pressure to curb hospital-acquired infections. Hospital systems are switching to single-use packs, pharmaceutical producers are specifying higher barrier formats, and equipment makers are embedding inline inspection to cut recall risks. The EPA’s new ethylene-oxide (EtO) emission rules are already shifting capital toward radiation and vapor-phase alternatives, while material suppliers are fast-tracking Tyvek and non-woven upgrades to meet the next wave of EU PFAS limits. Consolidation is picking up as global players seek the scale needed to fund compliance and automation.
Key Report Takeaways
- By product, trays and thermoform packs led with 26.21% of sterilized packaging market share in 2025; blisters and ampoules are forecast to advance at a 9.02% CAGR to 2031.
- By material, plastics held 61.58% of the sterilized packaging market size in 2025, while non-woven and Tyvek materials are projected to grow at 9.11% CAGR through 2031.
- By sterilization method, chemical processes retained 47.05% share of the sterilized packaging market size in 2025, yet radiation methods exhibit the highest projected CAGR at 8.07% to 2031.
- By end-user industry, the pharmaceutical and biological segment captured 43.12% of the sterilized packaging market size in 2025; medical and surgical instruments are expanding at 8.76% CAGR through 2031.
- By geography, North America commanded 32.84% of sterilized packaging market share in 2025, whereas Asia-Pacific is growing fastest at a 8.95% CAGR to 2031.
Note: Market size and forecast figures in this report are generated using Mordor Intelligence’s proprietary estimation framework, updated with the latest available data and insights as of 2026.
Market Trends and Insights
Drivers Impact Analysis of Sterilized Packaging Market*
| Driver | (~) % Impact on CAGR Forecast | Geographic Relevance | Impact Timeline |
|---|---|---|---|
| Rising incidence of hospital-acquired infections | +1.2% | Global; strongest in North America and Europe | Medium term (2-4 years) |
| Growth in biologics and injectable drugs | +1.8% | North America, Europe, Asia-Pacific | Long term (≥ 4 years) |
| Stringent global sterilization regulations | +0.9% | North America and EU | Short term (≤ 2 years) |
| Expansion of outpatient and home-care settings | +0.7% | North America and Europe; spreading to Asia-Pacific | Medium term (2-4 years) |
| AI-enabled inline sterile-pack inspection | +0.4% | North America and Europe; global roll-out | Long term (≥ 4 years) |
| Cell and gene-therapy cold-chain needs | +0.6% | North America and Europe; emerging in Asia-Pacific | Long term (≥ 4 years) |
| Source: Mordor Intelligence | |||
Rising Incidence of Hospital-Acquired Infections
Healthcare-associated infections affect 1 in 31 U.S. hospital patients on any day, costing the system USD 28.4 billion annually. Hospitals are therefore mandating higher barrier trays and sterile wraps for critical instruments, and many facilities are shifting reusable sets to single-use formats to mitigate liability. Single-use sterilized packaging market demand rises further as antibiotic-resistant organisms render legacy cleaning inadequate. Packaging converters report growing orders for breathable Tyvek lids that withstand multiple EtO cycles while maintaining a sterility assurance level of 10⁻⁶.
Growth in Biologics and Injectable Drugs
Global biologics revenue is moving toward USD 856 billion by 2030, and demand for injectable formats requires ultra-clean containers that do not shed particulates. The prefilled syringe boom is compelling suppliers to certify tougher container-closure tests, while cell-therapy producers need packs that hold integrity at -196 °C. SCHOTT Pharma’s USD 371 million U.S. syringe plant targets these therapies and shows how regional capacity expansion aligns with tighter Annex 1 rules.
Stringent Global Sterilization Regulations
The U.S. EPA now requires up to 99.99% EtO emission reduction at high-usage sites, adding multimillion-dollar compliance costs and catalyzing moves to gamma or e-beam sterilization [1]U.S. Environmental Protection Agency, “National Emission Standards for Commercial Sterilizers,” epa.gov. The FDA has issued temporary guidance to prevent device shortages, yet long-term policy signals favor lower-emission modalities. EU PFAS limits effective 2026 will also eliminate several fluoropolymer films, accelerating the transition to plasma-coated or multilayer barrier structures.
Expansion of Outpatient and Home-Care Settings
Home-infusion and at-home diagnostics are rising as payers push procedures outside hospitals. Packaging now needs to preserve sterility during parcel shipping and remain intuitive for non-professionals. Prefilled syringes and snap-open blister kits that reduce prep steps exemplify this shift. Regulatory agencies are adapting review pathways for home-use devices, prompting suppliers to design labels and seals that can be validated under uncontrolled conditions.
Restraints Impact Analysis of Sterilized Packaging Market*
| Restraint | (~) % Impact on CAGR Forecast | Geographic Relevance | Impact Timeline |
|---|---|---|---|
| Volatile medical-grade polymer prices | −0.8% | Global; most acute in cost-sensitive regions | Short term (≤ 2 years) |
| Cost of EtO emission compliance | −1.1% | North America and Europe | Medium term (2-4 years) |
| Limited pharma-grade gamma capacity | −0.6% | Emerging markets in particular | Medium term (2-4 years) |
| PFAS scrutiny in fluoropolymer films | −0.4% | North America and Europe; spreading worldwide | Long term (≥ 4 years) |
| Source: Mordor Intelligence | |||
Volatile Medical-Grade Polymer Prices
Medical-grade resins require specialty additives and lengthy validation, limiting supplier substitution. Geopolitical disruptions and refinery outages have spiked prices, squeezing converters that already face costly EtO abatement projects. Firms with multi-region supply contracts and in-house recycling capacity have more margin cover, whereas single-source buyers risk shortages and expedited-freight expenses.
Cost of Ethylene Oxide Emission Compliance
New scrubbers, continuous monitoring gear, and building retrofits raise capital outlays by USD 5–50 million per facility, depending on throughput. Large contract sterilizers can amortize the cost, but smaller providers may exit or consolidate, narrowing options for device makers. Temporary shutdowns during retrofits tighten capacity, raising lead times for sterilized packaging market customers until new radiation lines come online.
*Our forecasts treat driver/restraint impacts as directional, not additive. The impact forecasts reflect baseline growth, mix effects, and variable interactions.
Sterilized Packaging Market Segment Analysis
By Product:
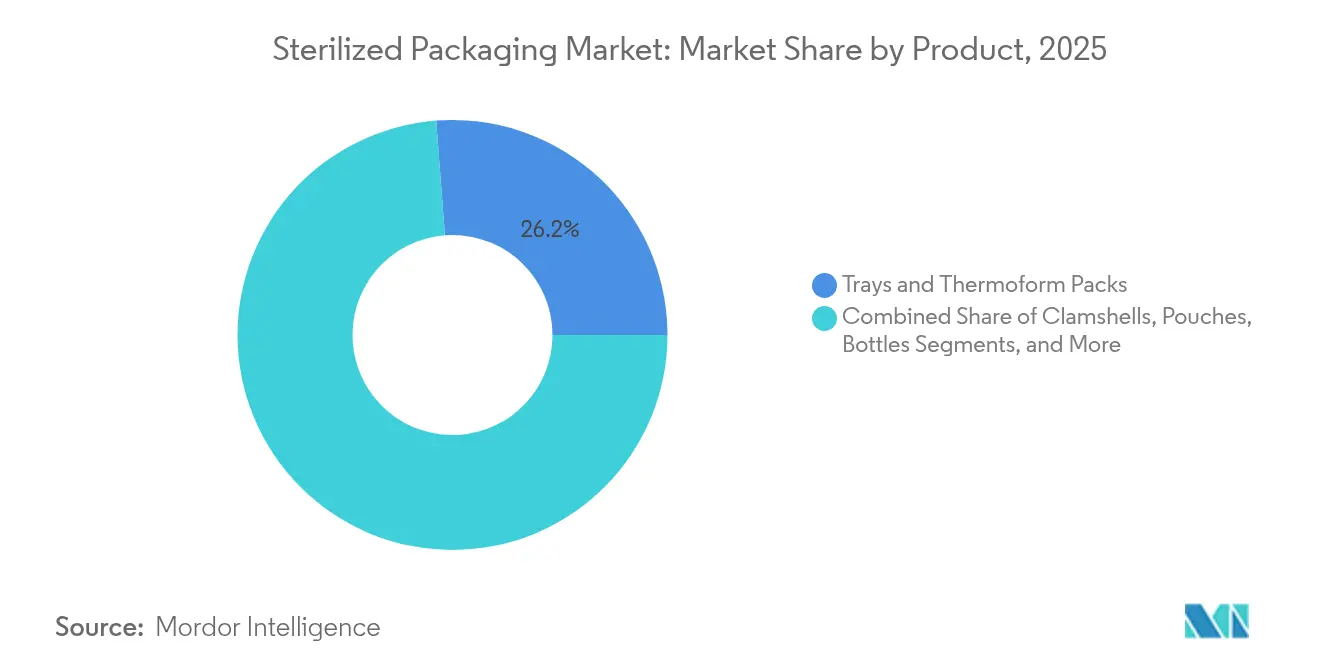
Custom Thermoforms Secure LeadershipTrays and thermoform packs retained a 26.21% share of the sterilized packaging market in 2025 thanks to their ability to nest complex instrument sets and provide instant visual confirmation. Hospitals value clear lids that speed count-in and count-out procedures, reducing operating-room delays. Custom cavities lower product movement, cutting puncture risk in transit. Blisters and ampoules represent the fastest-rising product at a 9.02% CAGR through 2031, supported by unit-dose biologics where contamination can destroy high-value doses.
The push toward advanced barrier films within blisters illustrates premiumization. AI-equipped cameras on thermoform lines inspect seal integrity at full speed, improving batch yield and documentation. Pouches, bottles, IV containers, and clamshells remain relevant for specific dosage forms and reusable instruments, but growth is slower as unit-dose formats gain traction. Smart labels that log temperature or radiation exposure are migrating from trial to scale, reflecting broader digitization.


By Material:
Non-Woven Gains on PlasticsPlastics still accounted for 61.58% of sterilized packaging market size in 2025 because they balance strength, clarity, and cost. Polyethylene, polypropylene, and cyclic-olefin copolymers withstand EtO, gamma, and e-beam, yet rising sustainability rules and virgin-resin inflation encourage substitution. Non-woven and Tyvek substrates are forecast to rise 9.11% CAGR to 2031 as breathability and fiber strength help them pair with lower-residue sterilants.
Glass vials remain indispensable where drug-product interaction must approach zero, notably for biologics with long cold-chain legs. Metal trays occupy smaller niches such as orthopedic implant kits requiring rigid retention and shielded transport. Paperboard is gaining for secondary cartons where biodegradability is prized, though primary sterility still relies on higher barriers. As PFAS sunset dates approach, suppliers scale up plasma and silicon-oxide coatings to replace fluoropolymers.
By Sterilization Method:
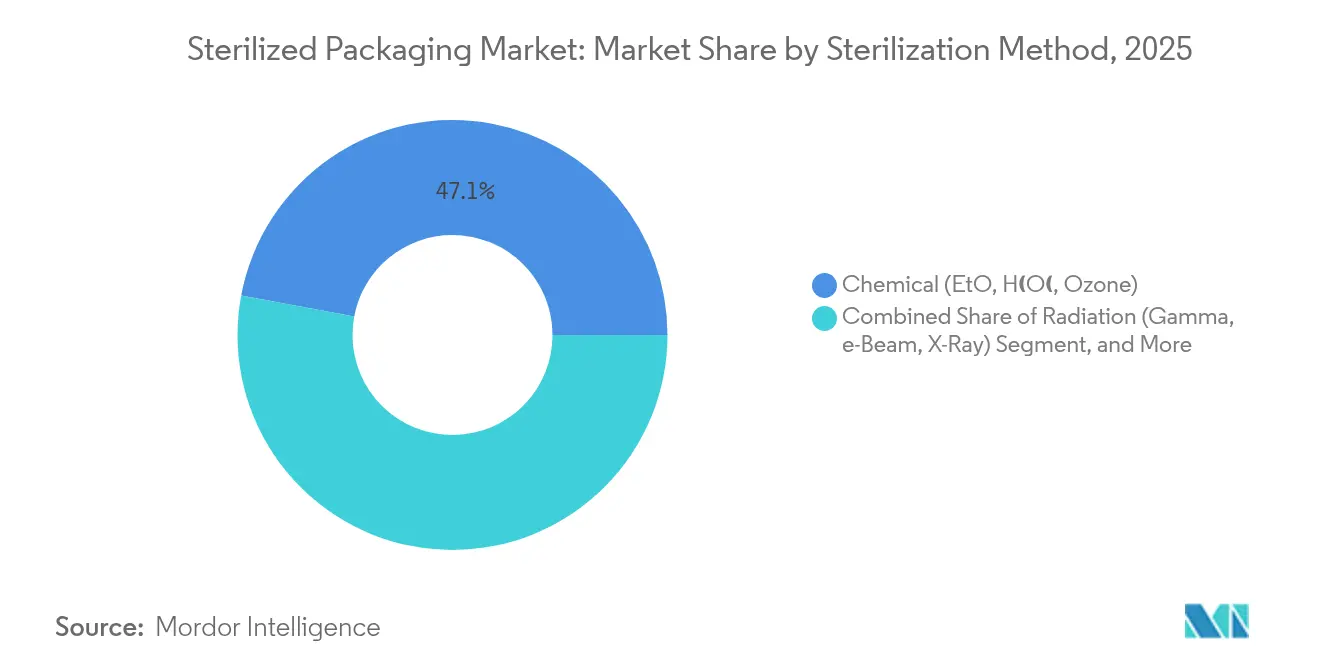
Radiation Extends ReachChemical processes, chiefly EtO, held 47.05% of sterilized packaging market share in 2025, but regulatory costs now tilt investment toward radiation lines. Gamma and e-beam systems are projected to grow at 8.07% CAGR through 2031, favored for residue-free output and faster turnaround. The sterilized packaging market size for radiation systems is also buoyed by biologics that cannot endure high heat.
Steam and dry-heat still serve stainless surgical sets and glass syringes where temperature tolerance exists. Aseptic fill-finish remains a premium niche, coupling isolators with sterile tubs of ready-to-use containers. Hybrid cycles, combining vaporized hydrogen peroxide with low-dose radiation, are under pilot at implant makers aiming for sterility assurance levels above 10⁻⁶ without EtO.
By End-User Industry:
Pharma Drives PremiumizationPharmaceutical and biologic producers commanded 43.12% of sterilized packaging market size in 2025 because regulatory filings mandate validated sterile barriers and exhaustive documentation. Prefilled syringes for GLP-1 therapeutics exemplify the premium these buyers accept for supply security. Medical and surgical instruments will post the quickest 8.76% CAGR through 2031 as outpatient centers prefer sterile, ready-to-use kits that avoid reprocessing.
In-vitro diagnostics benefit from point-of-care growth, demanding compact pouches and thermoform wells. Food and beverage uses remain steady where ultra-high temperature processes fall short of shelf-life goals, though they represent a smaller fraction of the sterilized packaging market. Veterinary and animal health volumes rise with expanding companion-animal spending, adopting many of the same pack formats used in human drugs.
Geography Analysis
North America Sterilized Packaging Market
North America held 32.84% of sterilized packaging market share in 2025, anchored by FDA oversight and a high proportion of complex drug launches. Large contract sterilization networks and leading resin producers underpin supply security, while investment focuses on EtO abatement and new e-beam vaults. Becton Dickinson’s biologic-delivery segment surpassed USD 1 billion in 2024, highlighting the region’s tilt toward higher-value devices .
Europe Sterilized Packaging Market
Europe follows with mature demand, driven by Annex 1 upgrades and early adoption of PFAS-free materials. Germany and Ireland host numerous fill-finish plants that feed global biologic supply chains. The EU’s 2026 fluoropolymer limits spur rapid qualification of alternative coatings, positioning European converters as first movers. Sustainability targets also push circular-economy pilots for reusable secondary packs.
APAC Sterilized Packaging Market
Asia-Pacific posts the fastest 8.95% CAGR to 2031 as China and India scale biologic and small-molecule output for domestic and export markets. Regional regulators are harmonizing with ICH guidelines, prompting investment in higher-grade cleanrooms and radiation capacity. Japan’s aging population drives home-care syringe demand, while South Korea and Australia serve as test beds for smart-label cold-chain packs. Localizing sterilized packaging market capacity cuts lead times and cushions currency risk.

Regulatory Landscape
Sterilized packaging requirements are shaped by harmonized quality-system and packaging-validation frameworks across major regions. Internationally, ISO 11607-1:2019 and ISO 11607-2:2019 remain key references for sterile barrier systems and process validation, and the US FDA continues to recognize ISO 11607 under its Recognized Consensus Standards program for premarket sterility-maintenance expectations.
In the United States, the FDA Quality Management System Regulation (QMSR) became effective in February 2026, tightening alignment to global QMS expectations and increasing documentation rigor for packaging design controls and validation records. Separately, the FDA issued a final order effective June 1, 2026, classifying rigid sterilization containers with electronic monitoring into Class II (21 CFR 880.6855), reinforcing the regulatory move toward digitally monitored sterile packaging systems within hospital and device workflows. In Europe, EU MDR (Regulation 2017/745) anchors sterile barrier compliance, and Commission Implementing Decision (EU) 2024/817 (March 2024) updated the harmonised standards list relevant to sterilisation and packaging under MDR.
Value Chain Analysis
The sterilized packaging value chain spans upstream inputs such as medical-grade polymers, non-wovens/Tyvek, foils, coatings, and sterilization-compatible adhesives and inks, followed by converting and forming into pouches, blisters, trays/thermoforms, vials, and closures. Sterilization and validation support then feeds regulated distribution with traceability and clean handling, reaching end users across pharmaceutical and biological producers, medical and surgical instrument manufacturers, and hospital sterile processing departments. Quality and compliance requirements (ISO 11607 validation and EU MDR/FDA-aligned documentation) make change control and revalidation a recurring operational step that affects lead times and supplier selection.
Bottlenecks cluster around sterilization capacity and regulatory volatility, which can trigger unplanned line qualification and sourcing shifts. Limited pharma-grade gamma capacity and dependence on isotopes such as Cobalt-60 add supply risk, while EtO compliance spending (including abatement and monitoring) influences how quickly sterilization networks can operate. Policy uncertainty can also change planning: in March 2026, the US EPA proposed rolling back parts of its 2024 EtO emissions rule, citing medical device supply chain stability, highlighting how environmental regulation intersects with sterile-pack throughput, qualification schedules, and dual-sourcing strategies.
Competitive Landscape
Global players are consolidating to spread compliance and R&D costs. Amcor’s USD 8.4 billion merger with Berry Global created the sector’s largest supplier, aiming for USD 650 million in annual synergies [3]Amcor plc, “Amcor Completes Combination with Berry Global,” amcor.com. DuPont is expanding Tyvek production in Costa Rica to support growing healthcare demand. These giants leverage integrated resin, film, and conversion assets to control quality and pricing.
Specialists pursue technology niches. SCHOTT Pharma, Gerresheimer, and Stevanato Group formed the Alliance for Ready-to-Use containers, pooling glass expertise to speed Annex 1 compliance and win higher-margin syringe contracts. West Pharmaceutical Services signed multiyear GLP-1 device pacts, illustrating how differentiated elastomer and closure technology can command price premiums.
Process automation is a key battleground. Brevetti CEA’s AI-enabled inspection allows 100% inline particulate checks on blister lines. WILCO AG’s vision platforms deliver similar gains for vial filling, cutting false rejects and traceability costs. Firms unable to fund these upgrades risk customer defection to higher-throughput rivals as batch-release cycles shrink.
Sterilized Packaging Industry Leaders
Amcor PLC
DuPont de Nemours, Inc.
Baxter International Inc.
Gerresheimer AG
West Pharmaceutical Services, Inc.
- *Disclaimer: Major Players sorted in no particular order
Sterilized Packaging Market Companies Covered in this Report
- Amcor plc
- DuPont de Nemours, Inc.
- Baxter International Inc.
- Gerresheimer AG
- SCHOTT AG
- West Pharmaceutical Services, Inc.
- AptarGroup, Inc.
- Tekni-Plex, Inc.
- Sealed Air Corporation
- Sonoco Products Company
- SteriPack Group
- Wipak Group
- Placon Corporation, Inc.
- SGD Pharma
- Becton, Dickinson and Company
- 3M Company
- Berry Global Group, Inc.
- Huhtamaki Oyj
- Sabert Corporation
- Winpak Ltd.

Market Opportunities and Future Outlook
Capacity build-outs in new manufacturing hubs create room for suppliers that can deliver validated sterile barrier systems near pharma and device clusters. Costa Rica has become a focus for sterile packaging investment, with DuPont expanding its Heredia site (June 2025) to add sterile packaging capacity and Prent Corporation breaking ground in Heredia in June 2026 for a new facility that includes a Class 7 cleanroom. These steps support more regionalized supply for medical device manufacturing and reward converters and material suppliers that can shorten qualification cycles while still providing ISO 11607-compliant validation packages.
A second opportunity area involves material and process transition tied to sterilization-method changes and sustainability constraints. Regulatory and customer pressure around EtO emissions is redirecting attention toward radiation and alternative modalities, raising demand for materials and seals that perform under gamma, e-beam, and vaporized hydrogen peroxide (VHP) compatibility needs. On the sustainability side, DNP started manufacturing sterile packaging using ISCC PLUS certified materials at its Izumizaki Plant in Japan in March 2026 in collaboration with DuPont, indicating commercialization paths for certified-content materials within regulated sterile packs where traceability and documentation are procurement gatekeepers.
Recent Industry Developments in Sterilized Packaging Market
- June 2026: Amcor achieved cleanroom certification at its thermoforming facility in Carolina, Puerto Rico, expanding its sterile packaging production network. The certification supports regulated healthcare programs that require controlled manufacturing environments and strengthens regional supply options for sterile thermoformed formats.
- March 2026: Dai Nippon Printing Co., Ltd. (DNP) began manufacturing sterile packaging using ISCC PLUS certified materials at its Izumizaki Plant in Fukushima Prefecture, Japan, in collaboration with DuPont. The start of production indicates a commercialization path for certified-content materials in sterile barrier applications where traceability and validation documentation act as procurement gatekeepers.
- June 2025: DuPont expanded its healthcare manufacturing site in Heredia, Costa Rica, adding 16,000 square feet to enable production of sterile healthcare packaging. The expansion increases capacity in a nearshore medtech hub and supports shorter lead times for device customers qualifying sterile barrier materials.


Sterilized Packaging Market Report Scope and Research Methodology
Market Definition and Coverage
For this report, the sterilized packaging market includes packaging formats and materials designed to maintain sterility until point of use, after sterilization through validated processes, for healthcare, pharma, and other hygiene-critical applications.
Scope exclusions: We exclude general, non-sterile protective packaging that is not validated for sterility maintenance, even if it is used in clean handling environments.
Segments Covered in This Report
- By Product
- Clamshells
- Pouches
- Bottles
- Blisters and Ampoules
- Vials
- Trays and Thermoform Packs
- IV Containers and Bags
- Others
- By Material
- Plastics (HDPE, PP, PET, PVC, Others)
- Glass
- Metals (Aluminum Foil, Stainless Steel)
- Paper and Paperboard
- Non-woven and Tyvek
- By Sterilization Method
- Chemical (EtO, Ozone)
- Radiation (Gamma, e-Beam, X-Ray)
- High Temperature / Steam
- Aseptic Fill-Finish
- By End-user Industry
- Medical and Surgical Instruments
- Pharmaceutical and Biological
- In-Vitro Diagnostics
- Food and Beverage
- Veterinary and Animal Health
- Other Industrial
- By Geography
- North America
- United States
- Canada
- Mexico
- South America
- Brazil
- Argentina
- Rest of South America
- Europe
- Germany
- United Kingdom
- France
- Italy
- Spain
- Russia
- Rest of Europe
- Asia-Pacific
- China
- Japan
- India
- South Korea
- Australia and New Zealand
- Rest of Asia-Pacific
- Middle East and Africa
- Middle East
- Saudi Arabia
- United Arab Emirates
- Turkey
- Rest of Middle East
- Africa
- South Africa
- Nigeria
- Egypt
- Rest of Africa
- Middle East
- North America
Data Sources, Market Sizing, and Validation
Desk Research
Desk work started by mapping how sterile barrier systems are defined and regulated, and then aligning that language with packaging formats and sterilization routes used in the industry. We used public source types such as US FDA guidance and references, ISO documents and ANSI/AAMI standards references, the US CDC, and selected customs and trade statistics to understand sterilization method adoption and packaging material flows.
To convert those signals into sizing inputs, company annual reports and investor presentations were reviewed for sterile packaging exposure, capacity additions, and regional footprint changes. We also referred to paid subscriptions for company financials and intelligence, patent databases, and shipment-level import and export data when public disclosures were not specific enough to separate sterile from non-sterile packs. The desk research sources listed here are illustrative rather than exhaustive, and other public documents and references were also used for data collection, validation, and research clarification.
Primary Interviews and Surveys
Primary work was used to validate the sterile packaging boundary, confirm mix shifts by sterilization method, and sanity check price and volume assumptions that can vary by region and end use. We spoke with participants across packaging converting, sterile barrier material supply, sterilization service ecosystems, and procurement or quality roles at end users to confirm adoption patterns and practical constraints.
Because demand drivers differ by geography, inputs were triangulated across APAC, EMEA, and the Americas so the model reflects local regulatory pressure, manufacturing footprints, and healthcare activity levels.
Distribution of primary research fieldwork respondents
| Company type | Respondent position | Region |
|---|---|---|
| Top tier: 27% | CXOs: 12% | APAC: 46% |
| Mid tier: 57% | Functional/Unit leaders: 37% | EMEA: 30% |
| Smaller Players: 16% | Managers: 51% | Americas: 24% |
Market-Sizing & Forecasting
Sizing was built using a top-down and bottom-up combination, where healthcare and pharma activity indicators were translated into a demand pool for sterile packs, and then split by common sterilization routes and packaging formats used in routine practice. Selective bottom-up checks were then used to corroborate totals, including sampled supplier revenue roll-ups by region, channel feedback on volume movement, and price times volume approximations for high-visibility formats.
Key model inputs included procedure and device usage trends, pharmaceutical fill-finish activity, sterilization method mix (steam, radiation, and chemical routes), packaging material substitution trends, and observable pricing movement tied to resin and specialty paper inputs. Where bottom-up views were incomplete (for example, private converters with limited disclosures), gaps were handled through regional penetration assumptions that were reviewed in interviews and then stress-tested against trade and capacity signals.
Forecasting relied mainly on scenario analysis, since regulatory shifts, sterilization capacity changes, and material availability can move demand faster than a smooth historical curve. Scenarios were anchored in expert expectations for healthcare volumes, biologics and device pipelines, and sterilization method transitions, and then converted into yearly growth paths and mix changes.
Data Validation & Update Cycle
Outputs were checked against independent signals such as sterilization capacity additions, medical device production trends, and reported packaging revenue exposure, and then variances were investigated before sign-off. When a metric broke from expected patterns, we re-checked definitions, currency timing, and regional splits, and then re-contacted select respondents if the gap looked structural.
A multi-step review is followed so calculation logic, assumptions, and unit consistency are verified by more than one analyst. Reports are refreshed annually, and interim updates are made when material events occur, such as major regulatory changes or large capacity moves. Before delivery, a final pass is completed so the numbers reflect the latest available public information and validated inputs.
Mordor Intelligence's Sterilized Packaging Market Estimate Compared With Other Published Estimates
It is normal to see different market sizes for sterilized packaging because publishers draw the scope differently. They also make different choices on base year, currency timing, and what qualifies as sterility-validated packaging versus adjacent hygiene packaging. Because these inputs feed directly into price and volume build-ups, the totals can drift even when the topic label looks the same.
By tracking sterilization method mix and refreshing currency conversion timing through interviews, Mordor Intelligence keeps the value tied to packs that maintain sterility until point of use, rather than adding broader healthcare packaging that is not sterility validated.
Benchmark comparison
| Source | Market Size | Gaps in Research Methodology |
|---|---|---|
| Mordor Intelligence | USD 81.61 B (2026) | |
| Global Consultancy A | USD 96.75 B (2026) | This estimate appears to use a wider scope that can include additional healthcare packaging beyond sterility validated packs, and it also applies a higher price and growth ramp over the same base year. |
| Trade Publisher B | USD 39.72 B (2024) | This number is anchored on an earlier year and may reflect a narrower application set or counted formats, which can reduce the total when compared against a later-year market with updated pricing and mix assumptions. |
The table shows that scope and timing are the biggest levers behind the spread, followed by how price progression is treated for high barrier formats. When the included packaging types and the year are aligned, the remaining differences typically come from sterilization mix splits and how regional demand signals are validated.


Key Questions Answered in the Report
What is the current value of the sterilized packaging market?
The sterilized packaging market was valued at USD 81.61 billion in 2026 and is projected to reach USD 117.18 billion by 2031.
Which product segment is expanding fastest?
Blisters and ampoules are growing at a 9.02% CAGR through 2031, reflecting rising biologic and unit-dose demand.
How are new EtO regulations affecting suppliers?
U.S. rules calling for up to 99.99% emission reductions are pushing capital toward radiation lines and adding USD 5–50 million in retrofit costs per facility, accelerating industry consolidation.
Why is Asia-Pacific the fastest-growing region?
Pharmaceutical manufacturing shifts to China and India, coupled with expanding healthcare infrastructure, are driving a 8.95% regional CAGR through 2031.
Page last updated on:


 Your data is secure and never sold or shared.


