
Market Overview
| Study Period | 2021 - 2031 |
|---|---|
| Market Size (2026) | USD 84.38 Billion |
| Market Size (2031) | USD 105.25 Billion |
| Growth Rate (2026 - 2031) | 4.52 % |
| Fastest Growing Market | Asia-Pacific |
| Largest Market | North America |
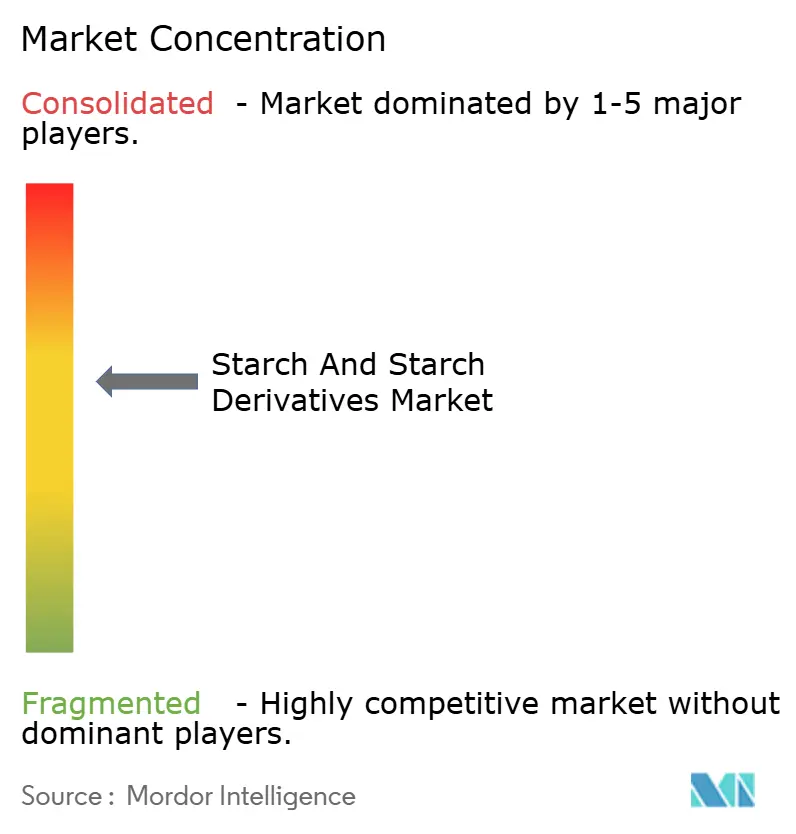
| Market Concentration | Medium |
Major Players *Disclaimer: Major Players sorted in no particular order Image © Mordor Intelligence. Reuse requires attribution under CC BY 4.0. | |
Starch And Starch Derivatives Market Analysis by Mordor Intelligence
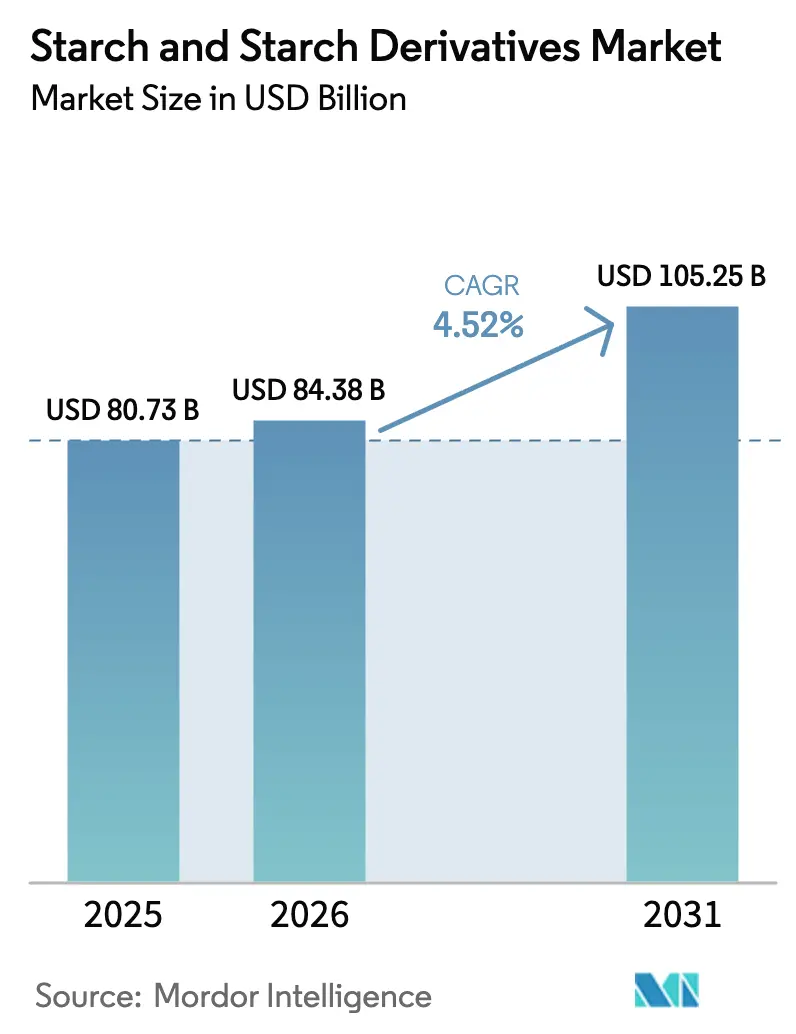
The starch and starch derivatives market size was valued at USD 80.73 billion in 2025 and estimated to grow from USD 84.38 billion in 2026 to reach USD 105.25 billion by 2031, at a CAGR of 4.52% during the forecast period (2026-2031). Demand is shifting from commodity‐grade powders to precision-engineered ingredients as enzymatic modification, clean-label claims, and non-GMO certifications steadily displace purely price-driven buying. Multinationals accelerate investment in pullulanase- and alpha-amylase platforms that deliver cold-fill stability and lower shear viscosity, while regional mills capture halal and kosher sub-niches through localized maize and cassava sourcing. Supply-chain security remains a boardroom priority because corn, wheat, and potato price swings distort contract margins faster than downstream formulators can reprice finished goods. Finally, rapid uptake of pharmaceutical-grade pre-gelatinized starches insulates manufacturers from slow nutrition and bakery volumes, diversifying end-market exposure beyond food and beverage.
Key Report Takeaways
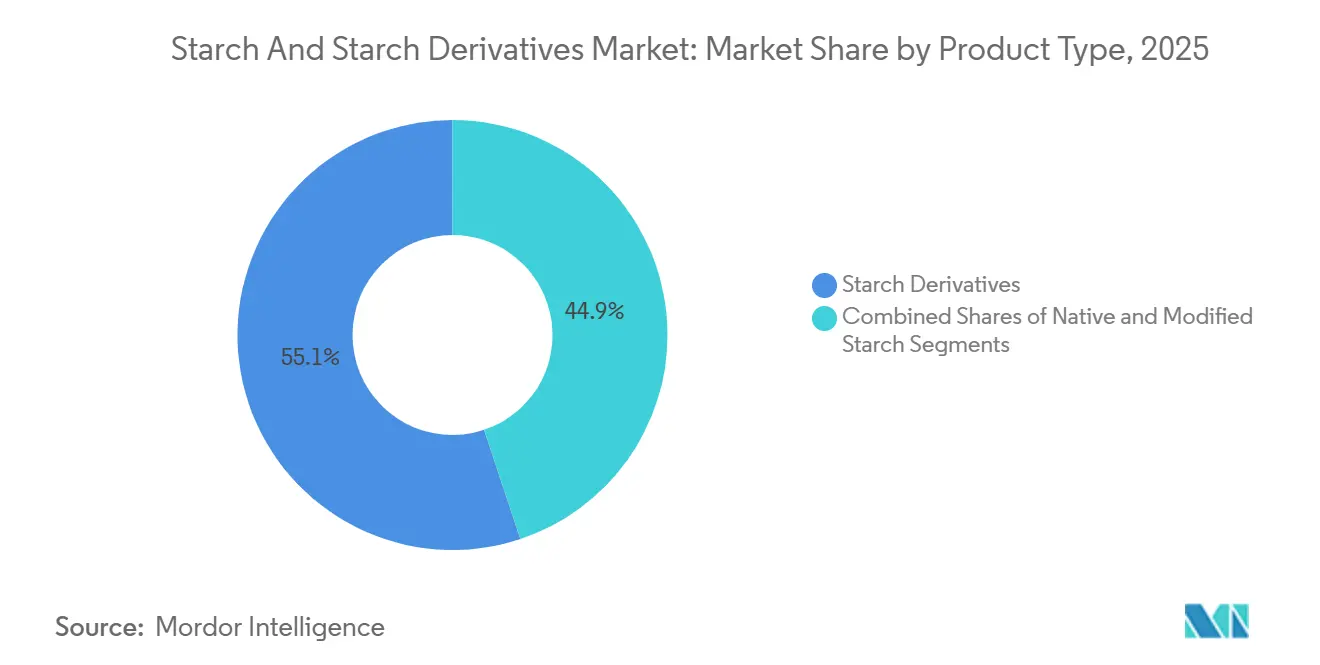
- By type, starch derivatives commanded 55.12% of the starch and starch derivatives market share in 2025, while modified starch is set to post the fastest growth at a 5.86% CAGR through 2031.
- By source, maize held 67.32% of the starch and starch derivatives market size in 2025; potato starch is projected to expand at a 6.02% CAGR over 2026-2031.
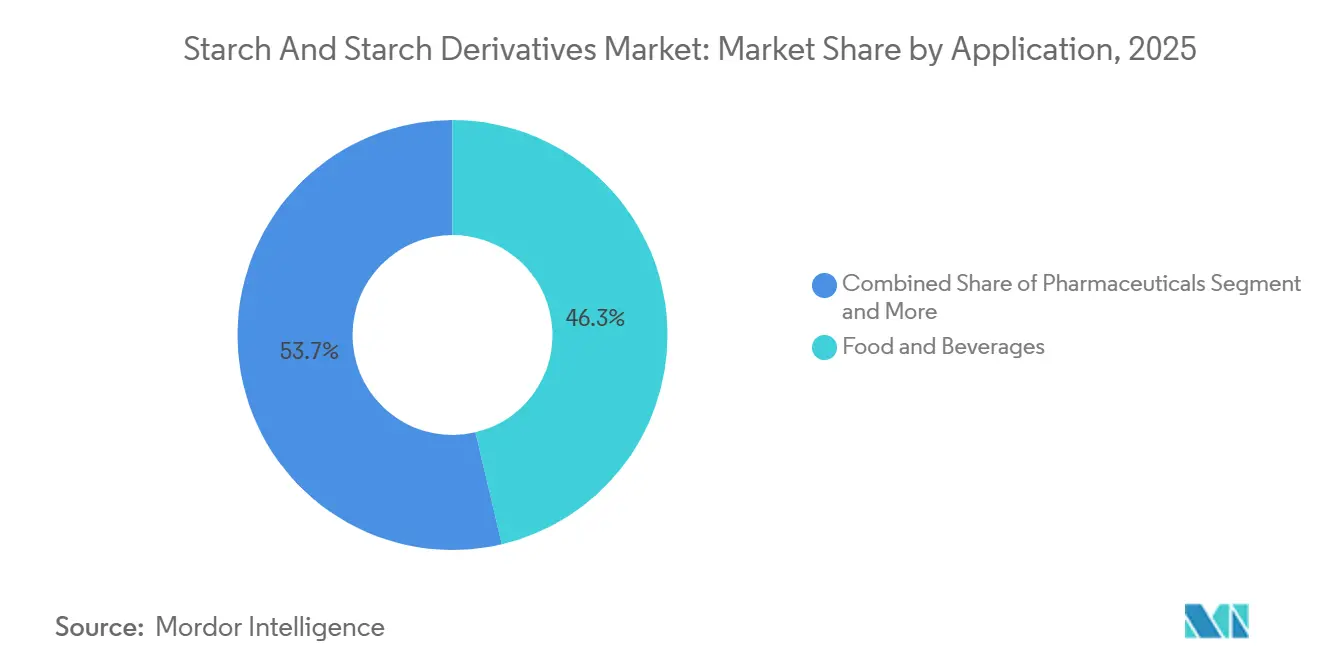
- By application, food and beverage captured 60.21% revenue in 2025, whereas pharmaceuticals registered the highest projected CAGR at 5.82% between 2026 and 2031.
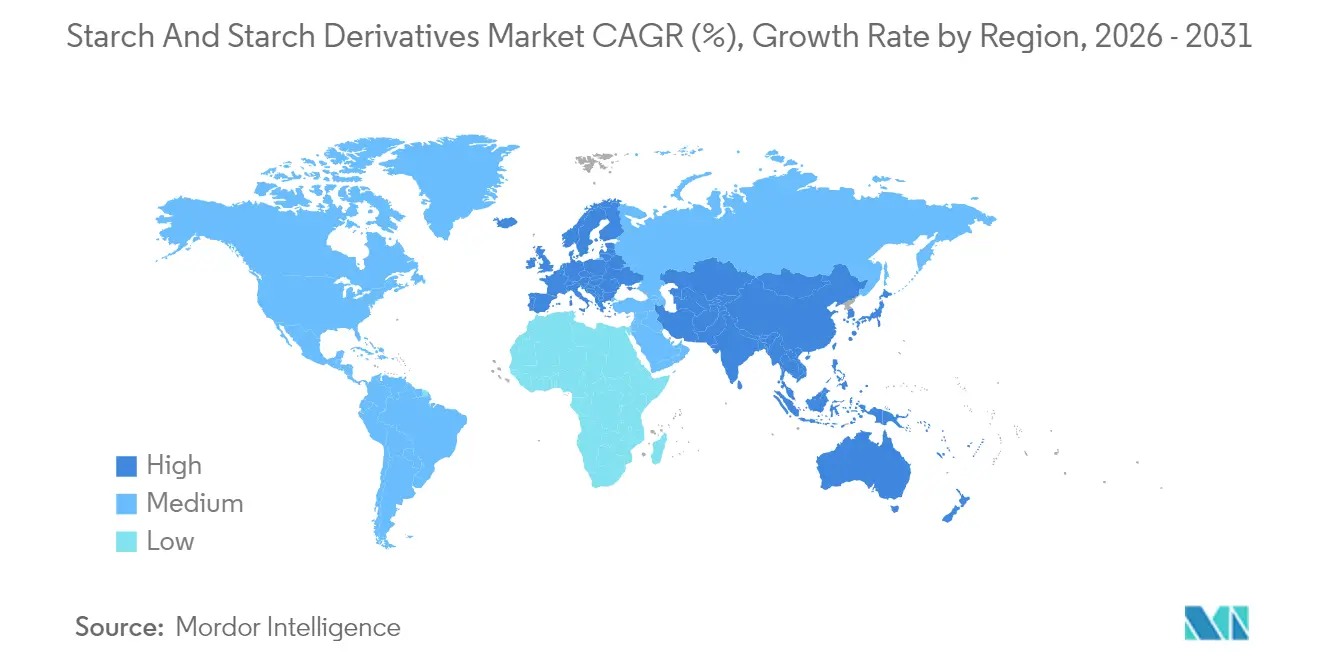
- By geography, North America led with 35.48% share in 2025, and Asia-Pacific is forecast to grow at a 5.58% CAGR to 2031.
Note: Market size and forecast figures in this report are generated using Mordor Intelligence’s proprietary estimation framework, updated with the latest available data and insights as of 2026.
Market Trends and Insights
Drivers Impact Analysis of Starch And Starch Derivatives Market*
| Driver | (~) % Impact on CAGR Forecast | Geographic Relevance | Impact Timeline |
|---|---|---|---|
| Rapid Expansion Of The Global Processed And Convenience Food Industry | +1.2% | Global, with concentration in North America, Europe, and urban Asia-Pacific | Medium term (2-4 years) |
| Shifting Consumer Trends Towards Plant-Based And Functional Ingredients | +0.9% | North America, Europe, Australia, urban centers in China and India | Medium term (2-4 years) |
| Cost-Effectiveness Of Starch Compared To Other Hydrocolloids | +0.7% | Global, particularly price-sensitive markets in South America, Southeast Asia, Middle East | Short term (≤ 2 years) |
| Widespread Use Of Starch As A Fat Replacer In Food And Beverage Applications | +0.6% | North America, Europe, Japan, emerging in Latin America | Medium term (2-4 years) |
| Advancements In Enzymatic And Physical Modification Techniques | +0.8% | Global, led by innovation hubs in Netherlands, United States, Germany, Japan | Long term (≥ 4 years) |
| Adoption Of Starch Derivatives In Industrial Applications Beyond Food | +0.5% | Global, with strong uptake in pharmaceutical manufacturing (India, China), textiles (Bangladesh, Vietnam), paper (Scandinavia, North America) | Long term (≥ 4 years) |
| Source: Mordor Intelligence | |||
Rapid Expansion of the Global Processed and Convenience Food Industry
Processed and convenience food sales reached USD 2.8 trillion globally in 2025, expanding 6.2% year-over-year as urbanization and dual-income households shortened meal-preparation windows, according to the Food and Agriculture Organization[1]. This surge directly lifts starch demand because starches function as thickeners, stabilizers, and texture modifiers in ready-to-eat meals, sauces, and bakery products. The modified starch industry benefits disproportionately, as manufacturers require heat-stable and freeze-thaw-resistant variants that native starches cannot deliver. Emerging markets in Southeast Asia and Sub-Saharan Africa are replicating Western convenience-food adoption curves, with Indonesia's instant-noodle consumption rising 11% in 2024 and Nigeria's frozen-food imports climbing 14% in 2025, both trends that embed starch derivatives into supply chains that previously relied on fresh ingredients. This structural shift suggests that even modest GDP growth in developing economies will translate into above-average starch-derivative uptake, as processors prioritize shelf-stable formulations over cold-chain logistics.
Shifting Consumer Trends Towards Plant-Based and Functional Ingredients
Plant-based food sales in North America and Europe exceeded USD 29 billion in 2025, growing 9.4% year-over-year, with starches serving as critical binders and emulsifiers in meat analogues and dairy-free products. Pea-protein burgers, oat-milk yogurts, and cashew-based cheeses all rely on modified starches to mimic the mouthfeel and melting properties of animal-derived fats and proteins. Tapioca and potato starches are preferred in these applications because they carry non-GMO and gluten-free credentials that align with clean-label positioning. Functional-beverage brands are incorporating resistant starches, particularly high-amylose maize starch, as prebiotic fibers, with clinical trials published in 2024 demonstrating improved gut microbiome diversity after 8 weeks of daily consumption. Resistant starch sales for functional foods grew 13% in 2025, outpacing conventional modified starches, as brands leverage fiber-content claims to command premium pricing, according to the Food and Drug Administration[2]. This convergence of plant-based and functional trends is fragmenting starch portfolios, rewarding suppliers that can offer certified organic, non-GMO, and allergen-free variants while maintaining cost competitiveness against synthetic alternatives.
Cost-Effectiveness of Starch Compared to Other Hydrocolloids
Starch derivatives in food formulations provide a cost advantage of 30-50% compared to guar gum, xanthan gum, and carrageenan. This cost benefit is particularly significant for price-sensitive segments, such as private-label sauces and budget bakery products. In 2025, guar gum averaged USD 3,200 per metric ton, whereas modified maize starch was priced at USD 950 per metric ton. This price difference enabled formulators to achieve comparable viscosity profiles at just one-third of the raw material cost. In 2024, typhoons in the Philippines disrupted seaweed farms, causing carrageenan supply issues. This disruption led to a 19% price increase, prompting several European dairy brands to reformulate their yogurt and dessert lines using potato starch blends, as reported by the European Commission. The cost advantage of starch derivatives is even more pronounced in emerging markets, where local starch mills can underprice imported hydrocolloids by 40-60%. This pricing dynamic is driving the adoption of starches in regional brands, particularly those unable to secure volume discounts on specialty gums.
Widespread Use of Starch as a Fat Replacer in Food and Beverage Applications
Manufacturers are now able to reduce fat content by 25-50% while maintaining sensory attributes, utilizing modified starches. These starches mimic the creamy mouthfeel of triglycerides by forming microcrystalline networks that trap water. Tapioca-based fat replacers are particularly effective in dairy applications, as they replicate the opacity and viscosity of milk fat without triggering allergen labeling concerns from the European Food Safety Authority. In 2025, North American yogurt brands reformulated their products, reducing fat content by an average of 35%. They replaced butterfat with enzymatically modified tapioca starch, preserving the same spoonable texture. Early in 2025, Japan's Ministry of Health, Labour and Welfare approved a new waxy-maize starch derivative for low-fat ice cream, enabling manufacturers to achieve scoopability at -18°C without using added emulsifiers[3]. These regulatory approvals for novel fat-replacer starches are expanding the market beyond traditional reduced-fat categories. They are now penetrating premium "better-for-you" segments, where consumers are willing to pay a 15-20% price premium for clean-label ingredients.
Restraints Impact Analysis of Starch And Starch Derivatives Market*
| Restraints | (~) % Impact on CAGR Forecasts | Geographic Relevance | Impact Timeline |
|---|---|---|---|
| Volatility In Agricultural Raw Material Prices Impacting Profit Margins | -0.9% | Global, acute in regions dependent on imported feedstocks (Middle East, North Africa, parts of Southeast Asia) | Short term (≤ 2 years) |
| Limited Functional Stability And Shelf Life Of Native Starches | -0.4% | Global, particularly affecting small-scale processors in South Asia, Sub-Saharan Africa, Latin America | Medium term (2-4 years) |
| Quality Concerns Due To Genetically Modified Ingredient Adulteration | -0.5% | Europe, Japan, Australia, urban centers in India and China | Medium term (2-4 years) |
| Regulatory Complexity In Labeling Modified Or Functional Starches | -0.6% | Global, most pronounced in markets with divergent frameworks (EU vs. U.S. vs. India vs. China) | Long term (≥ 4 years) |
| Source: Mordor Intelligence | |||
Volatility in Agricultural Raw Material Prices Impacting Profit Margins
In 2024, potato starch producers in Germany and the Netherlands encountered a 22% increase in input costs due to drought-induced declines in tuber yields. This situation forced several mills to suspend operations until the 2025 plantings, in line with European Commission directives. In Thailand, tapioca-root prices rose by 16% in 2024, driven by labor shortages and increased demand from bioethanol plants. This price hike compressed margins for cassava-starch exporters supplying food manufacturers in Japan and South Korea. Processors without strong hedging mechanisms or tied to long-term farmer contracts faced margin compressions exceeding 300 basis points during price spikes. This has encouraged vertical integration, although it has also created higher capital barriers for smaller regional players. Additionally, market volatility has disrupted procurement strategies, with some manufacturers stockpiling feedstocks during price drops. While this strategy can be advantageous, it ties up working capital and warehouse space that could otherwise support R&D or capacity expansion.
Limited Functional Stability and Shelf Life of Native Starches
Native starches exhibit retrogradation—recrystallization of amylose chains, that causes syneresis and texture degradation in refrigerated and frozen foods, limiting their use in convenience categories that dominate modern retail. Unmodified maize starch loses 40-60% of its viscosity after three freeze-thaw cycles, rendering it unsuitable for frozen sauces and ready meals without chemical or enzymatic modification. Potato starch, while offering superior clarity, gels irreversibly upon cooling, a trait that restricts its application in chilled dairy desserts and salad dressings. Shelf-life constraints become acute in tropical climates, where high humidity accelerates microbial spoilage and starch hydrolysis, forcing manufacturers to over-invest in preservatives or cold-chain logistics. Small-scale processors in South Asia and Sub-Saharan Africa often lack access to modification technologies, relegating them to low-margin commodity segments where native starches suffice but price competition is fierce. This functional gap perpetuates a two-tier market structure, with multinational brands commanding premium pricing through modified-starch portfolios while regional players compete on cost alone, unable to capture value from performance differentiation.
*Our forecasts treat driver/restraint impacts as directional, not additive. The impact forecasts reflect baseline growth, mix effects, and variable interactions.
Starch And Starch Derivatives Market Segment Analysis
By Type:
Derivatives Lead, Modified Variants AccelerateIn 2025, starch derivatives held a 55.12% market share, driven by the extensive use of glucose syrups, high-fructose corn syrup, and maltodextrin in food, beverage, and pharmaceutical applications. Modified starch is projected to grow at a 5.86% CAGR from 2026 to 2031, surpassing derivatives as clean-label mandates push formulators toward enzymatically modified variants that replicate chemical starch performance without E-number disclosures. Native starch remains essential for cost-sensitive uses like corrugated-board adhesives and textile sizing but faces challenges from raw-material volatility and limited functionality in freeze-thaw or high-shear conditions. Glucose syrups accounted for 22% of derivative sales in 2025, primarily serving confectionery and bakery sectors where sweetness and moisture retention are key. High-fructose corn syrup (HFCS) consumption in North America declined by 3% in 2025 as beverage brands shifted to cane sugar and stevia blends. However, HFCS exports to Mexico and Southeast Asia rose by 7%, offsetting domestic declines, according to the U.S. Department of Agriculture.
Maltodextrin sales grew 8.4% in 2025, driven by sports nutrition and pharmaceutical excipient applications requiring rapid gastric emptying and neutral taste, as noted by the U.S. Food and Drug Administration. Dextrins, mainly used in adhesives and textile sizing, grew 4.1% in 2025, supported by e-commerce packaging growth and garment export recoveries in Bangladesh and Vietnam. The modified starch market is splitting into enzymatic and chemical sub-segments. Enzymatic variants, with a 15-20% price premium, captured 42% of modified-starch volume in 2025 as brands prioritized label simplicity. Physically modified starches—processed through extrusion, high-pressure homogenization, or ultrasound—remain niche, representing less than 5% of modified-starch sales. However, they are attracting R&D investments from suppliers seeking "unmodified" label claims while ensuring freeze-thaw stability. This segmentation reflects a market shift where performance and label transparency increasingly drive innovation over commodity scale.

By Source:
Maize Dominance Meets Potato MomentumIn 2025, maize held a 67.32% market share, driven by its scalability, established wet-milling infrastructure, and cost efficiency in glucose syrup and HFCS production. Potato starch is projected to grow at a 6.02% CAGR from 2026 to 2031, supported by Europe's clean-label trend, non-GMO certifications, and rising pharmaceutical-grade excipient demand in Asia. Wheat starch, concentrated in Europe and Australia, serves niche markets for gluten extraction and specialty food applications. Tapioca starch, mainly sourced from Thailand, Vietnam, and Indonesia, grew by 5.2% in 2025, fueled by cassava's drought tolerance and its appeal in gluten-free and allergen-free products.
Maize-starch economics depend on U.S. Midwest yields and Chinese import policies; a 10% change in U.S. corn production can shift global starch prices by 6-8%, necessitating hedging by major processors. In Europe, potato starch benefits from shorter supply chains, with German and Dutch mills sourcing tubers within 100 kilometers, reducing emissions and supporting "local" marketing claims that appeal to sustainability-focused retailers. Wheat starch faces challenges as gluten-free trends reduce co-product demand, prompting some Australian mills to pivot to bioethanol or animal-feed markets with lower margins. Tapioca's growth relies on Southeast Asian land-use policies; Thailand's 2024 plan to convert 120,000 hectares of rice paddies to cassava fields signals government support, potentially increasing tapioca-starch exports by 15-18% by 2028.
By Application:
Food Dominates, Pharma AcceleratesIn 2025, food and beverage applications held a 60.21% market share, covering bakery, confectionery, dairy, sauces, and beverages. Starches were essential for texture, stability, and mouthfeel. The pharmaceutical sector is projected to grow at a 5.82% CAGR from 2026 to 2031, driven by India's generic-drug exports, China's biosimilar expansion, and regulatory approvals for excipients that enhance tablet disintegration and API bioavailability. Personal care and cosmetics used 23,000 metric tons of starch in 2025, mainly rice and tapioca starches for oil absorption in dry shampoos and as bulking agents in mineral cosmetics. Animal feed consumed 89,000 metric tons in 2025, utilizing starches as binders in pelleted feeds and energy sources in aquaculture diets, with 3.6% growth supported by shrimp and tilapia farming in Southeast Asia. Textile sizing accounted for 112,000 metric tons in 2025, with Bangladesh and Vietnam contributing 44% of the volume as garment exports rebounded. The paper and corrugating industries used 340,000 metric tons of cationic starches in 2025, improving fiber bonding and reducing synthetic resin use in Scandinavian and North American mills.
Food and beverage growth is slowing compared to historical trends, as mature markets in North America and Europe focus on reformulation over volume expansion, shifting starch demand toward higher-value modified variants. The pharmaceutical sector is splitting into immediate-release and controlled-release sub-segments, with the latter commanding 40% price premiums for starches enabling sustained API delivery over 8-12 hours. Personal-care brands are exploring resistant starches for oil control in leave-on skincare, a nascent application that could increase cosmetic-starch demand by 12-15% if clinical studies validate oil-control claims. Animal feed faces margin pressure from soybean meal and corn-gluten alternatives, but aquaculture's 6.8% annual growth through 2030 supports starch's indispensable binding properties. Textile and paper applications remain stable but are vulnerable to synthetic-polymer substitution if petrochemical prices drop sharply. The segmentation highlights a market where food's dominance is declining relatively, even as absolute volumes grow, while industrial and pharmaceutical uses drive incremental growth through performance differentiation.
Geography Analysis
North America Starch and Starch Derivatives Market
In 2025, North America accounted for 35.48% of the market, driven by the U.S.'s high-fructose corn syrup infrastructure, Canada's wheat-starch exports, and Mexico's processed-food manufacturing. The region's food-processing sector shifted focus to reformulation, increasing demand for enzymatically modified starches that meet clean-label standards while maintaining freeze-thaw stability and shelf life. U.S. corn-starch production reached 14.2 million metric tons, with Archer Daniels Midland, Cargill, and Ingredion controlling 68% of wet-milling capacity through vertically integrated supply chains. Mexico's starch consumption rose 4.9%, supported by nearshoring of U.S. food-processing operations and growing demand for convenience foods due to urbanization. Regulatory frameworks, including FDA clean-label guidance and USDA organic certification, favor enzymatic modifications, creating a 15-20% price premium for compliant starches.
APAC Starch and Starch Derivatives Market
Asia-Pacific is projected to grow at a 5.58% CAGR from 2026 to 2031, led by China's pharmaceutical-grade starch demand, India's generic-drug exports, Indonesia's cassava-starch capacity, and Thailand's tapioca-processing scale. In 2025, China consumed 6.8 million metric tons of starch, with 22% used for pharmaceutical excipients as biosimilar production expanded. India's starch market grew 7.3%, driven by maize-starch demand for corrugated packaging and modified starches in processed foods as middle-class preferences shifted toward convenience. Indonesia and Thailand exported 1.4 million metric tons of tapioca starch, benefiting from cassava's drought tolerance and government subsidies that reduced feedstock costs by 8-12%. Japan's starch consumption declined 1.2%, but pharmaceutical and personal-care applications grew 6.1%, offsetting food-sector challenges. Australian wheat-starch producers faced margin pressures in 2025 due to declining gluten-free co-product demand, prompting shifts to bioethanol and animal-feed markets. Regulatory fragmentation in Asia-Pacific, led by China's SAMR, India's FSSAI, and Japan's MHLW, increased compliance costs for multinational suppliers.
EMEA and South America Starch and Starch Derivatives Market
Germany produced 680,000 metric tons of potato starch in 2025, with 58% exported to pharmaceutical and food manufacturers in France, Italy, and the UK. The Netherlands, through Avebe's cooperative potato-starch network, produced 420,000 metric tons, emphasizing non-GMO and organic certifications that command 18-22% premiums in Scandinavian and UK retail markets. Poland's maize-starch output reached 340,000 metric tons, serving corrugated-packaging and textile-sizing applications in Central and Eastern Europe. France and the UK, as net importers, absorbed 290,000 metric tons of modified starches in 2025, primarily enzymatic variants aligned with clean-label trends. South America's starch market grew 4.7%, driven by Brazil's cassava-starch production and Argentina's maize-starch exports, supported by competitive feedstock costs and rising processed-food demand. The Middle East and Africa consumed 780,000 metric tons of starch in 2025, led by Egypt, Saudi Arabia, and South Africa, with demand focused on bakery and pharmaceutical applications. However, import dependency and currency volatility constrained growth compared to other regions.
Regulatory Landscape
Regulation of starches and starch derivatives is shaped by food additive specifications, labeling rules, and national food safety standards that differ across major markets. In the European Union, Commission Regulation (EU) 2026/196 (published January 2026) amends specifications under Regulation (EC) No 1333/2008 for certain thickeners, including starch sodium octenyl succinate (E 1450). The update introduces revised terminology and tighter specifications, including microbiological criteria, with phased compliance timelines running from August 2026 through February 2028.
In China, the National Food Safety Standard for edible starch (GB 31637-2025) entered into force on March 16, 2026. It updates requirements for physical and chemical indicators for edible starch, affecting quality assurance and testing protocols for both domestic producers and importers. Across regions, companies also align with broader labeling and claims frameworks, such as allergen and organic labeling rules in the EU, and with food safety management expectations (for example, ISO 22000 adoption in premium channels). As a result, documentation and traceability carry more weight for modified and specialty starch portfolios.
Value Chain Analysis
The value chain starts with crop cultivation and aggregation (maize, wheat, potato, and tapioca/cassava), then moves into primary processing via wet milling or other separation processes that yield starch alongside co-products (proteins, fibers, and other fractions). Starch is converted into functional ingredients using physical, enzymatic, or chemical modification, producing modified starches and derivatives such as glucose syrups, maltodextrin, dextrins, and HFCS. These ingredients are then blended, packaged, and distributed to end users across food and beverage, pharmaceuticals (excipients), paper and corrugating, textiles, personal care, and feed.
Industry structure and standards bodies affect how the chain is organized, particularly in Europe, where Starch Europe represents 28 producing companies across 19 EU Member States. The association reports that members process roughly 22-25 million tonnes of agricultural raw materials annually. A recurring theme is maximizing whole-crop valorization and managing upstream price volatility through contracting and integrated sourcing. Downstream differentiation depends more on application support, certifications (including non-GMO, halal, kosher, and organic), and compliance with evolving additive specifications and national food standards.
Competitive Landscape
The starch and starch derivatives market shows moderate consolidation, with Archer Daniels Midland, Cargill, Ingredion, Tate & Lyle, and Roquette controlling about 52% of global capacity through vertically integrated wet-milling operations and patented enzymatic modifications. These companies secure long-term corn and wheat contracts to mitigate spot-market volatility. Regional players like Avebe in Europe, Gulshan Polyols in India, and Manildra Group in Australia focus on niche segments through localized sourcing, halal or kosher certifications, and specialty-grade offerings. Global leaders invest in enzymatic-modification R&D and pharmaceutical-grade capacities to target clean-label and excipient markets, while smaller processors prioritize cost-efficiency by co-locating with feedstock sources and serving price-sensitive regional manufacturers.
Growth opportunities include resistant-starch formulations for functional foods, physically modified starches qualifying for "unmodified" labeling, and cassava-starch production in Sub-Saharan Africa, where favorable agronomic conditions contrast with underdeveloped processing infrastructure. Disruptors like Novozymes and DSM license enzyme technologies, enabling smaller processors to produce modified starches without costly chemical-modification lines, narrowing the gap with multinationals. Precision fermentation is advancing, with startups engineering microbes to produce amylose and amylopectin directly from glucose feedstocks, bypassing agricultural supply chains. While commercial-scale production is 3-5 years away, pilot facilities in the Netherlands and Singapore achieved cost parity with potato starch by late 2025, signaling potential disruption pending regulatory approvals.
Patent filings for starch-based biodegradable plastics rose 34% between 2024 and 2025. Ingredion and BASF are co-developing thermoplastic-starch compounds that meet composting standards in Europe and North America. If single-use plastic bans expand, this could account for 8-12% of global starch production by 2030. Compliance with ISO 22000 food-safety standards and non-GMO certifications, such as those from the Non-GMO Project, has become essential for premium retail channels, creating challenges for processors in emerging markets lacking traceability infrastructure.
Starch And Starch Derivatives Industry Leaders
-
Archer Daniels Midland Company
-
Cargill, Incorporated
-
Ingredion Inc.
-
Tate & Lyle PLC
-
Roquette Freres S.A.
- *Disclaimer: Major Players sorted in no particular order
Starch And Starch Derivatives Market Companies Covered in this Report
- Archer Daniels Midland Company
- Cargill, Incorporated
- Ingredion Inc.
- Tate & Lyle PLC
- Roquette Freres S.A.
- Sudzucker Group
- Avebe U.A.
- AGRANA Beteiligungs-AG
- Tereos S.A.
- Grain Processing Corporation
- Manildra Group
- Japan Corn Starch Co. Ltd
- Angel Starch & Food Pvt Ltd
- Gulshan Polyols Ltd
- Universal Starch-Chem Allied Ltd
- SPAC Starch Products (India) Private Ltd.
- Everest Starch India Pvt. Ltd.
- Sage Oil LLC
- Medikonda Nutrients
- Meelunie B.V.
Market Opportunities and Future Outlook
Portfolio premiumization continues to open whitespace in specialty starch systems used for clean-label texturizing, sugar reduction, and pharmaceutical excipients, supported by active capacity and portfolio moves among major suppliers. In June 2026, Ingredion announced a recommended all-cash offer to acquire Tate & Lyle PLC (approximately USD 3.7 billion). The deal signal underscores the priority given to scaling specialty ingredient capabilities and technical application support that sit above commodity starch economics.
Industrial and bioeconomy-linked applications provide a second set of opportunities, as starch biorefineries position starch-based inputs for plant-based alternatives to fossil-derived materials. On the supply side, capacity investments that target specialty production, rather than purely commodity output, point to where near-term commercialization effort is concentrating. For example, the Agrana-Ingredion starch joint venture investment of EUR 35 million in Romania aims to expand production capacity for regional demand in Europe. These changes raise the importance of technical service, regulatory compliance readiness, and secure feedstock sourcing for suppliers serving both food and non-food value chains.
Recent Industry Developments in Starch And Starch Derivatives Market
- May 2026: Cargill Incorporated completed the divestment of its corn wet milling facility in Davangere, Karnataka, to Riddhi Siddhi Gluco Biols Ltd. The divestment alters regional capacity and supply-chain dynamics in Indian corn wet milling. Rationalizing the asset portfolio focuses on higher-margin specialty starch and clean-label portfolios; this could shift regional pricing and capacity balance.
- March 2025: Cargill Incorporated inaugurated a new corn milling plant in Gwalior, Madhya Pradesh, in partnership with Saatvik Agro Processors. The new milling capacity adds regional supply for starch ingredients in India. This strengthens Cargill’s footprint in the Indian market, enabling closer feedstock alignment and customer co-located production.
- February 2025: Ingredion Incorporated invested in Cedar Rapids, Iowa facility to expand specialty industrial starch capacity (US$50 million). The expansion targets specialty starch capabilities for packaging and papermaking sectors. It improves Ingredion’s position in high-margin, specialty starch and supports clean-label industrial applications.
Starch And Starch Derivatives Market Report Scope and Research Methodology
Market Definition and Coverage
This market captures revenues generated from the sale of starch and starch-derived ingredients used across food, industrial, and specialty end uses, counted at the point of ingredient sale and reported in USD for the covered geographies.
Scope exclusions: We exclude downstream finished products where starch is only an input ingredient, along with on-farm production not sold into commercial channels.
Segments Covered in This Report
- By Type
- Native Starch
- Modified Starch
- Starch Derivatives
- Glucose Syrups
- High Fructose Corn Syrup (HFCS)
- Maltodextrin
- Dextrins
- Others
- By Source
- Maize
- Wheat
- Potato
- Tapioca
- Others
- By Application
- Food And Beverage
- Pharmaceutical
- Personal Care And Cosmetics
- Animal Feed
- Textile
- Paper And Corrugating
- Others
- By Geography
- North America
- United States
- Canada
- Mexico
- Rest of North America
- Europe
- United Kingdom
- Germany
- Spain
- France
- Italy
- Sweden
- Poland
- Netherlands
- Russia
- Rest of Europe
- Asia-Pacific
- China
- India
- Japan
- Australia
- Indonesia
- Thailand
- Vietnam
- Malaysia
- Rest of Asia-Pacific
- South America
- Brazil
- Argentina
- Chile
- Peru
- Colombia
- Rest of South America
- Middle East and Africa
- Saudi Arabia
- South Africa
- United Arab Emirates
- Egypt
- Morocco
- Rest of Middle East and Africa
- North America
Data Sources, Market Sizing, and Validation
Desk Research
Desk work started with mapping the starch value chain from feedstock crops to ingredient production and then to the major end-use industries, so the scope stayed anchored to ingredient revenues. Public statistics were used to understand supply availability and trade flows for key inputs and outputs, which helped set realistic bounds on volume movement and the regional mix.
We referenced non-paywalled sources such as FAOSTAT for crop production, UN Comtrade for trade patterns, USDA and other national agriculture statistics for corn, wheat, potato, and cassava indicators, and sources such as Eurostat for manufacturing and price-related context. Supporting reads included regulatory and standards references (for example, food additive and pharma excipient notes), peer-reviewed papers on modified starch functions, plus company filings and investor presentations to understand capacity additions and product mix. Where useful, paid subscriptions for company financials and intelligence, patent databases, and shipment-level import/export views were used to cross-check timelines and directional volumes. The sources listed here are not exhaustive, and many additional public documents and datasets were reviewed for data collection, validation, and clarification.
Primary Interviews and Surveys
Primary work focused on validating pricing logic, utilization patterns, and end-use demand shifts that are not fully visible in public datasets. We spoke with a mix of ingredient producers, distributors, and large buyers across food, paper, textiles, feed, and pharma related use cases, and then reconciled differences by region so the model reflects actual commercial behavior in those geographies.
Distribution of primary research fieldwork respondents
| Company type | Respondent position | Region |
|---|---|---|
| Top tier: 34% | CXOs: 14% | APAC: 53% |
| Mid tier: 44% | Functional/Unit leaders: 33% | EMEA: 29% |
| Smaller Players: 22% | Managers: 53% | Americas: 18% |
Market-Sizing & Forecasting
Sizing was built using top-down logic where regional demand pools were reconstructed from crop availability, starch processing capacity, and import-export movement, then converted into market value using validated price ranges by product type. After these totals were formed, we used selective bottom-up approximations as a check, such as supplier revenue mix triangulation, sampled capacity by region, and indicative ASP times volume checks for major derivative groups.
Key model inputs included feedstock indicators (corn, wheat, potato, and cassava output trends), starch conversion and yield assumptions by source, capacity additions and utilization rates, derivative mix shifts driven by food texture and stability needs, and application-level demand signals from processed food output and paper and corrugating activity. To avoid overfitting, gaps in bottom-up checks were handled by using ranges from interviews and aligning them with trade directionality before they were applied to the value bridge.
Forecasting used scenario analysis supported by variable-level views from primary respondents, since raw material prices and utilization tend to swing and can move value faster than volume. Scenarios were tied to feedstock price direction, processing utilization, and application growth in food and industrial uses, followed by annual normalization so the time series stays internally consistent.
Data Validation & Update Cycle
Validation relied on triangulating the final value totals against independent signals such as regional trade balances for starch-related products, capacity announcements, and observed price bands for native and modified ingredients. If a country or application output looked unusually high or low, we re-checked the drivers, and re-contacted respondents when the variance could not be explained by seasonality, mix, or currency effects.
Before sign-off, the model and assumptions go through a multi-step internal review to keep calculation logic, units, and year-to-year changes consistent. Reports are refreshed annually, with interim updates when material events occur, such as large capacity changes, major feedstock shocks, or policy shifts. Right before delivery, we run a final pass so clients receive the most current view available.
Mordor Intelligence's Starch and Starch Derivatives Market Estimate Compared With Other Published Estimates
Published market sizes for starch and starch derivatives can vary even when they describe similar end uses, because publishers often use different product boundaries, pricing bases, and year definitions. Differences also show up when some estimates blend in adjacent sweeteners or downstream formulated products, which changes what is counted.
The table points to a spread that usually comes from scope and pricing mechanics, rather than simple math errors. Some publishers apply broader baskets that sweep in syrups and other carbohydrate ingredients, or they use a single blended price curve across regions without separating native, modified, and derivative price behavior, which can lift value in high price years.
Benchmark comparison
| Source | Market Size | Gaps in Research Methodology |
|---|---|---|
| Mordor Intelligence | USD 84.38 B (2026) | |
| Industry Association A | USD 90.60 B (2026) | Uses a wider carbohydrate-ingredients perimeter that appears to include more sweetener-like derivatives and broader industrial inputs, and it applies more uniform regional pricing rather than type-specific price bands. |
| Global Consultancy B | USD 76.20 B (2026) | Applies more conservative utilization and demand assumptions for industrial applications, and it appears to use a narrower set of applications while holding ASP progression flatter across the forecast window. |
The table shows that the higher figure is mainly linked to broader ingredient baskets, while the lower figure is mainly linked to tighter application coverage and more cautious utilization. In Mordor Intelligence's model, the value is built by separating native starch, modified starch, and derivatives, then applying application- and region-aware price bands that are checked through interviews and trade and capacity signals, which makes the total easier to trace and repeat year after year.
Key Questions Answered in the Report
What is the projected CAGR for the starch and starch derivatives market during 2026-2031?
The value is expected to advance at a 4.52% CAGR, climbing from USD 84.38 billion in 2026 to USD 105.25 billion by 2031.
Which product type shows the strongest growth momentum through 2031?
Modified starch leads with a forecast 5.86% CAGR as brands favor enzymatic variants to satisfy clean-label claims without E-number declarations.
Why is potato starch gaining share against maize?
European non-GMO premiums and rising Asian pharmaceutical demand lift potato starch to a projected 6.02% CAGR over 2026-2031 despite maize’s current dominance.
How do clean-label preferences affect new product formulation?
Food and beverage manufacturers increasingly swap chemically treated hydrocolloids for enzymatically modified or physically treated starches that allow simpler ingredient lists and maintain textural performance.