Market Overview
| Study Period | 2021 - 2031 |
|---|---|
| Market Size (2026) | USD 29.19 Billion |
| Market Size (2031) | USD 37.49 Billion |
| Growth Rate (2026 - 2031) | 5.13% CAGR |
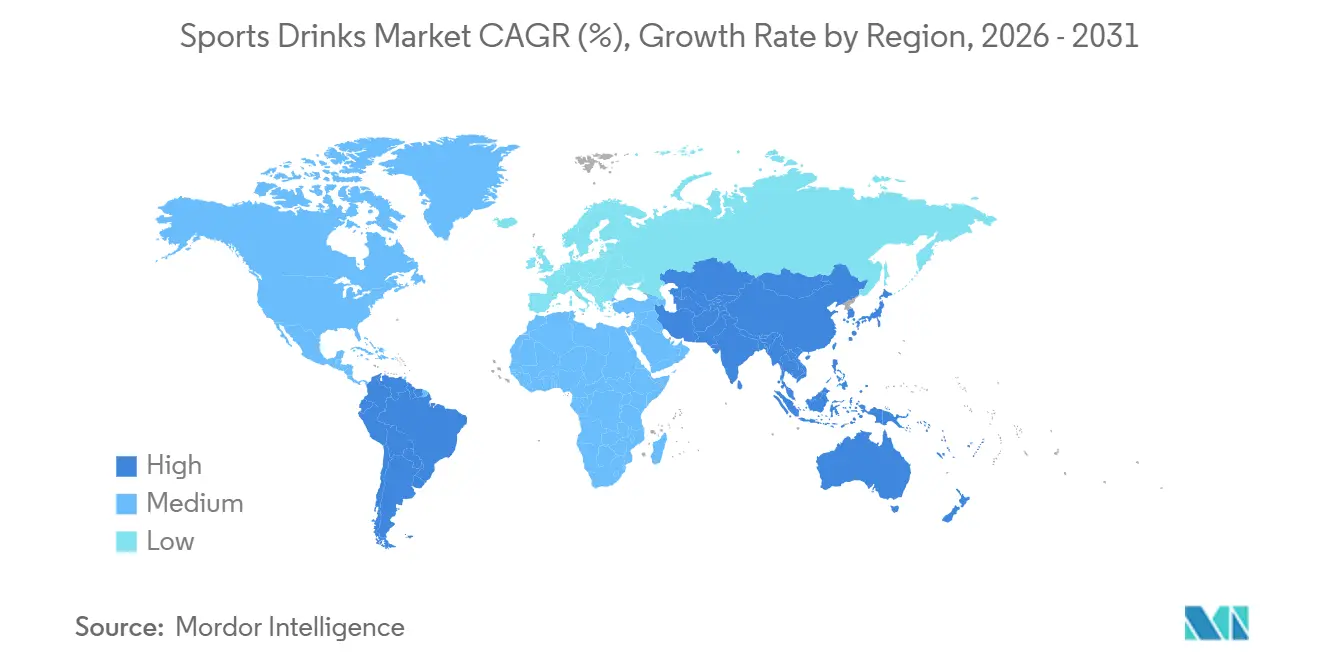
| Fastest Growing Market | Asia Pacific |
| Largest Market | North America |
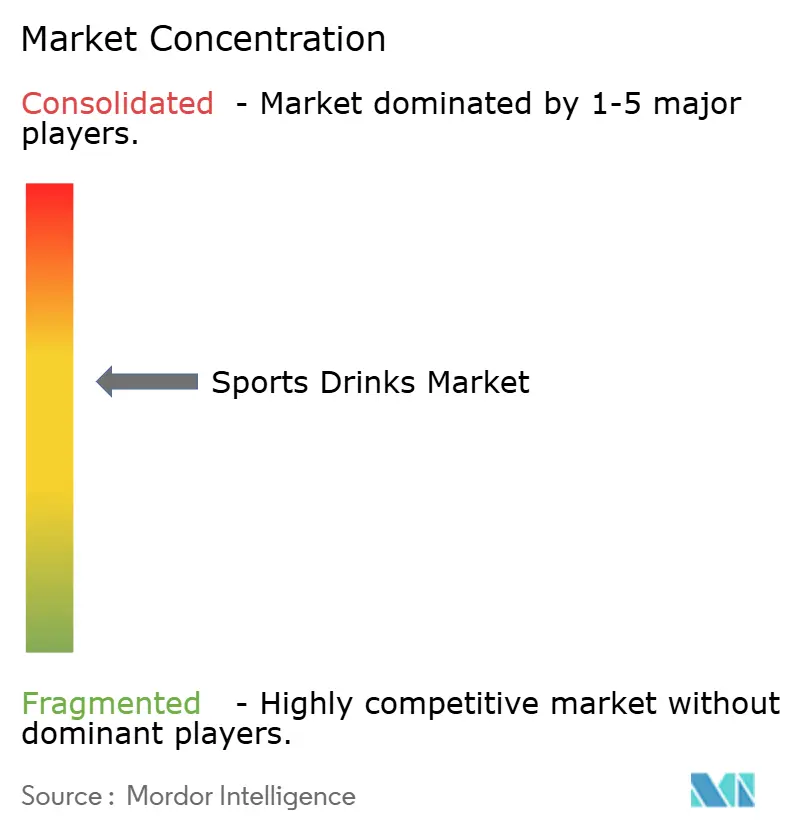
| Market Concentration | Medium |
Major Players
*Disclaimer: Major Players sorted in no particular order Image © Mordor Intelligence. Reuse requires attribution under CC BY 4.0. |
|
Sports Drinks Market Analysis by Mordor Intelligence
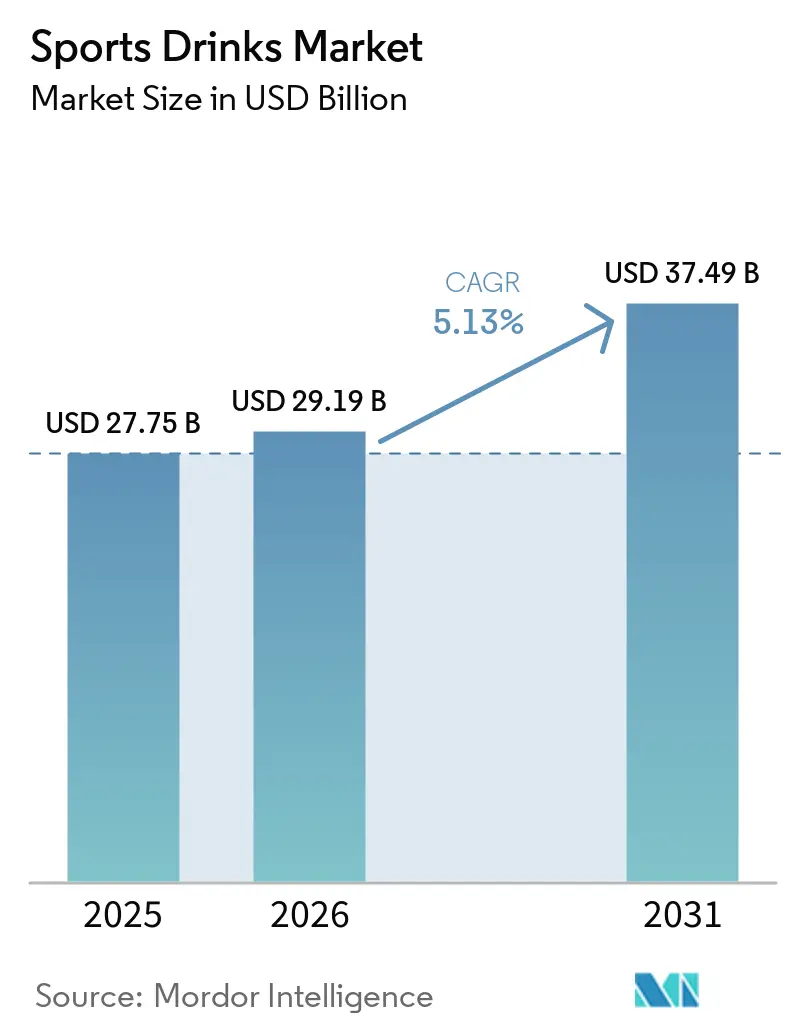
The sports drink market size was valued at USD 27.75 billion in 2025 and estimated to grow from USD 29.19 billion in 2026 to reach USD 37.49 billion by 2031, at a CAGR of 5.13% during the forecast period (2026-2031). Everyday fitness enthusiasts now drive category expansion as they use electrolyte beverages to avoid hydration-linked performance dips at work and in leisure exercise. Convenience has become a co-equal purchase trigger with flavor because concentrated boosters and powder sticks fit commuter and gym-bag routines. Government fitness mandates, subscription commerce, and reformulations that remove added sugar have widened acceptance beyond competitive athletes, reinforcing the structural shift toward proactive hydration. Digital platforms that connect wearables with beverage recommendations validate efficacy in real time, encouraging premium price points for targeted formulations.
Key Report Takeaways
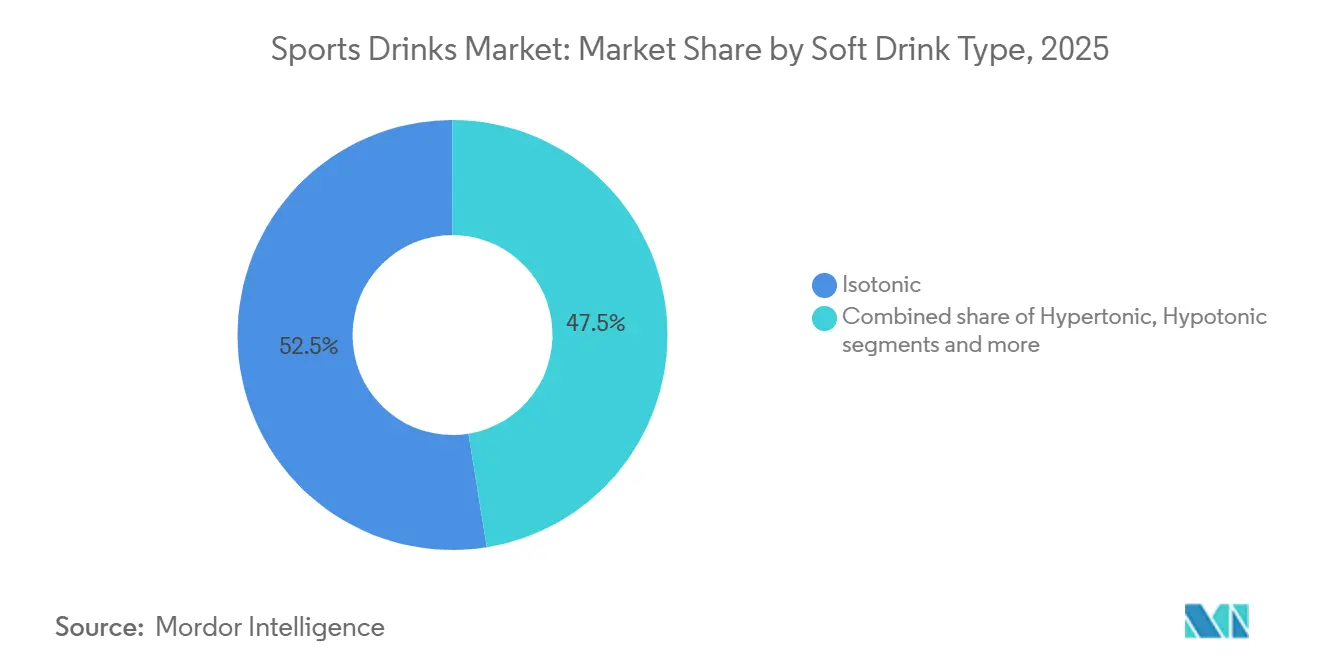
- By soft drink type, isotonic beverages commanded 52.54% of 2025 volume while hypertonic variants are projected to grow at a 6.59% CAGR through 2031.
- By packaging, PET bottles held 56.38% of 2025 revenue, whereas aseptic packages are poised for a 6.75% CAGR over 2026-2031.
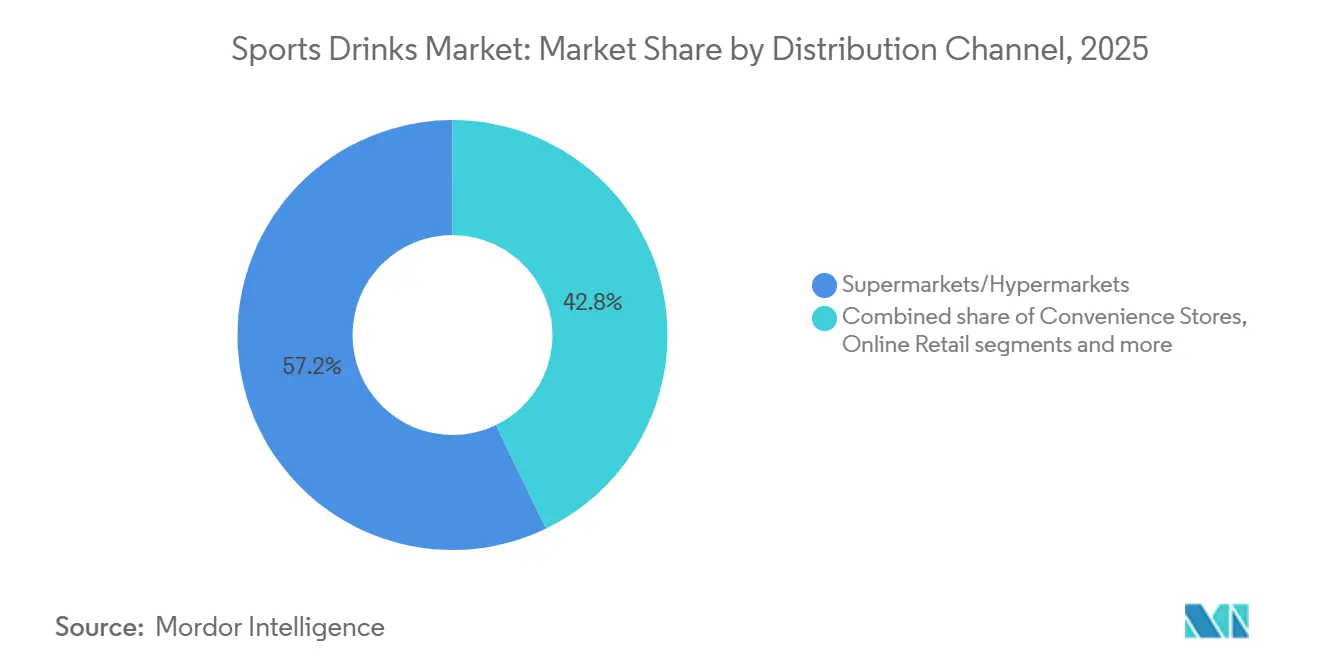
- By distribution channel, supermarkets and hypermarkets captured 57.17% of sales in 2025, yet online retail is expected to advance at a 6.68% CAGR during the forecast period.
- By functionality, post-workout formulations accounted for 47.56% of 2025 sales, while intra-workout hydration products are forecast to expand at a 6.52% CAGR to 2031.
- By geography, North America generated 37.69% of 2025 revenue, but Asia-Pacific is set to register the fastest 6.20% CAGR through 2031.
Note: Market size and forecast figures in this report are generated using Mordor Intelligence’s proprietary estimation framework, updated with the latest available data and insights as of 2026.
Global Sports Drinks Market Trends and Insights
Drivers Impact Analysis*
| Driver | (~) % Impact on CAGR Forecast | Geographic Relevance | Impact Timeline |
|---|---|---|---|
| Surging participation in organized sports, endurance events, and recreational fitness activities | +1.2% | Global, with peaks in North America, Europe, and urban Asia-Pacific | Medium term (2-4 years) |
| Increasing consumer focus on hydration, electrolyte balance, and functional performance beverages | +1.0% | Global, particularly North America and Europe | Long term (≥4 years) |
| Greater availability through modern trade expansion and on-the-go consumption channels | +0.9% | Asia-Pacific core, spill-over to Middle East and Africa | Short term (≤2 years) |
| Rapid innovation in sugar-free, low-calorie, and functional beverage formulations | +0.8% | North America and Europe, expanding to Asia-Pacific | Medium term (2-4 years) |
| Growing workplace wellness, outdoor recreation, and preventive health adoption trends | +0.7% | North America, Europe, and urban centers in Asia-Pacific | Long term (≥4 years) |
| Rising preference for clean-label products with natural ingredients and transparent sourcing | +0.6% | North America and Europe | Medium term (2-4 years) |
| Source: Mordor Intelligence | |||


Surging participation in organized sports, endurance events, and recreational fitness activities
In 2024, approximately 21.5% of Americans engaged daily in sports, exercise, and recreational activities, according to the Bureau of Labor Statistics [1]Source: Bureau of Labor Statistics, "American Time Use Survey - 2023 Results," bls.gov. This consistent participation reflects a broader wellness movement, driving demand for hydration solutions across various fitness activities. The rapid growth of team sports like pickleball and the increasing popularity of endurance events, such as marathons and trail running, highlight this trend. Record-breaking registrations at events like the Berlin and London marathons, coupled with athletes participating in off-road activities, underscore the need for sustained electrolyte replenishment. Companies are leveraging this momentum to expand their market presence. Gatorade, for example, sponsors major endurance races, including the Chicago Marathon and Rock 'n' Roll series, offering Endurance Formula gels and drinks tailored for athletes transitioning from training to competition. Similarly, Powerade targets recreational cyclists and runners with its ION4 electrolyte system, designed to maintain muscle function during varying activity intensities. The rise of group trail runs, ultra-distance cycling, and communal fitness activities, particularly among women, further amplifies the demand for post-workout recovery solutions. These interconnected trends, spanning daily exercise to high-profile endurance events, continue to drive the sports drink market as functional hydration becomes essential for performance.
Increasing consumer focus on hydration, electrolyte balance, and functional performance beverages
Consumer demand for hydration, electrolyte balance, and functional performance beverages is driving growth in the sports drink market. Heightened awareness of fluid loss during exercise has increased the need for specialized replenishment solutions. Rising sports participation and recreational fitness activities are fostering consistent hydration habits, essential for maintaining electrolyte levels, muscle function, and endurance. Cargill’s 2025 Protein Profile highlights that 61% of American consumers increased their protein intake in 2024, up from 48% in 2019, reflecting a shift toward protein-based sports drinks [2]Source: Cargill, Incorporated, "Consumers are Seeking More Protein for Health and Taste in 2025," cargill.com. These beverages, combining electrolytes and protein, support post-workout recovery and endurance performance. Unwell Hydration addresses this demand with protein-enriched formulas designed for fitness enthusiasts, balancing hydration and muscle repair during activities like trail runs or team sports. Functional beverages are also gaining traction in organized sports, where electrolyte balance is critical for preventing cramps during marathons and other endurance events. BodyArmor has entered the market with low-sugar, potassium-rich drinks, catering to cyclists and runners transitioning from recreational rides to ultra-events. This interconnected focus on hydration and performance is driving market expansion, as consumers increasingly seek beverages that sustain energy and support physical activity across varying intensity levels, from daily exercise routines to high-performance training.
Rapid innovation in sugar-free, low-calorie, and functional beverage formulations
Innovations in sugar-free, low-calorie, and functional beverage formulations are driving growth in the sports drink market by addressing the increasing demand for hydration solutions that align with active lifestyles. These advancements enable consumers to maintain electrolyte balance without excessive sugar intake, catering to both endurance events and daily fitness routines. The integration of low-calorie, protein-based options supports muscle recovery in recreational activities while avoiding calorie spikes that could hinder performance in competitive sports. For instance, NOOMA Organic Sports Drink delivers organic, low-sugar formulations with natural electrolytes, ideal for trail runners transitioning from casual group runs to marathons, ensuring hydration without artificial additives. Similarly, zero-sugar alternatives are gaining traction for their ability to enhance endurance without compromising taste, as seen in recreational cycling, where sustained energy is critical. A-GAME Zero Sugar exemplifies this trend with clean-label, low-carb drinks containing 250mg of sodium per serving, supporting athletes in high-intensity sessions and daily exercise routines. By combining electrolytes with minimal calories, these formulations extend protein-focused recovery benefits, bridging the gap between workout hydration and competitive fueling. Such innovations address the evolving needs of both recreational and endurance athletes, offering functional, guilt-free options that prioritize overall wellness while reducing sugar content.
Rising preference for clean-label products with natural ingredients and transparent sourcing
Consumer demand for clean-label sports drinks, driven by preferences for natural ingredients and transparent sourcing, is reshaping the market. This trend aligns with the increasing participation in endurance events and recreational fitness, where individuals seek hydration solutions free from artificial additives that could disrupt electrolyte balance. Clean-label formulations are also enhancing protein-based recovery drinks, supporting muscle repair post-workout, and meeting the health-conscious needs of active lifestyles. In 2024, Ingredion Incorporated reported that 38% of new food and beverage launches in the United States and Canada featured clean-label claims, surpassing the global average of 30% [3]Source: Ingredion Incorporated, "Clean Label Ingredients: From Buzzword to Business Driver", ingredion.com. Sports drink brands are leveraging this trend to offer transparent electrolyte replenishment for activities such as marathons and trail runs. For example, Skratch Labs uses real fruit, sea salt, and cane sugar in its hydration mixes, catering to runners transitioning from recreational fitness to competitive endurance without relying on synthetic preservatives. Additionally, sugar-free innovations are gaining traction, providing low-calorie, natural options that support performance in cycling and team sports. LMNT exemplifies this with its zero-sugar, stevia-sweetened packets containing naturally sourced sodium, potassium, and magnesium, ideal for fitness enthusiasts balancing daily exercise with high-intensity activities. The clean-label movement underscores a shift toward holistic, performance-oriented beverages.
Restraints Impact Analysis*
| Restraint | (~) % Impact on CAGR Forecast | Geographic Relevance | Impact Timeline |
|---|---|---|---|
| Shelf-life limitations associated with natural and preservative-free formulations | -0.5% | Global, particularly impacting emerging markets with fragmented cold-chain | Medium term (2-4 years) |
| Complex and evolving regulatory compliance requirements across regions | -0.4% | Global, with heightened complexity in Europe, North America, and China | Long term (≥4 years) |
| Heightened consumer scrutiny of artificial colors, flavors, and additives | -0.3% | North America and Europe | Short term (≤2 years) |
| Sustainability pressures linked to packaging waste and environmental impact | -0.3% | Europe, North America, and urban Asia-Pacific | Medium term (2-4 years) |
| Source: Mordor Intelligence | |||
Shelf-life limitations associated with natural and preservative-free formulations
Shelf-life limitations tied to natural and preservative-free formulations present a significant challenge for businesses in the sports drink market. The rising consumer preference for clean-label products, characterized by natural ingredients and minimal processing, often results in reduced product longevity. While these formulations align with wellness trends, they are more susceptible to spoilage and quality degradation, complicating distribution and inventory management. Companies must balance ingredient transparency with shelf stability, frequently resorting to costly cold-chain logistics or advanced packaging solutions to maintain product freshness. For instance, NUUN Sport electrolyte tablets, which emphasize natural ingredients, require specific storage guidelines to ensure optimal performance, highlighting the operational complexities of preservative-free positioning. These constraints can deter manufacturers from fully committing to such formulations or limit their availability in mainstream retail channels. To address these challenges, businesses are investing in innovative packaging technologies and natural stabilization methods to extend shelf life without compromising clean-label integrity. Simultaneously, educating consumers on proper storage and usage is critical to fostering acceptance of these products. While natural and preservative-free formulations cater to evolving health-conscious demands, their inherent shelf-life constraints remain a significant barrier to broader market penetration and operational scalability.
Heightened consumer scrutiny of artificial colors, flavors, and additives
Consumer concerns over artificial colors, flavors, and additives are creating significant challenges for businesses in the sports drink market. As buyers increasingly scrutinize ingredient lists, traditional formulations relying on synthetic additives for taste, appearance, or shelf stability are losing appeal. This shift is driving demand for cleaner, more natural alternatives, particularly in performance and wellness-focused categories. For instance, Bodyarmor Lyte has reformulated certain variants to exclude artificial sweeteners and colors, aligning with consumer preferences for natural hydration options. However, not all brands can adapt easily. The removal of artificial agents often impacts flavor consistency, increases production costs, and reduces shelf life, which can delay product launches and hinder innovation. To address these challenges, manufacturers are investing in natural flavors and colorants, though these solutions are frequently more expensive and technically complex to implement. Consequently, legacy sports drink portfolios risk losing relevance among ingredient-conscious consumers unless they adapt to these evolving preferences. Companies that successfully navigate these challenges by aligning their offerings with consumer demand for natural ingredients are better positioned to maintain their competitive edge in this dynamic market.
*Our forecasts treat driver/restraint impacts as directional, not additive. The impact forecasts reflect baseline growth, mix effects, and variable interactions.
Segment Analysis
By Soft Drink Type: Hypertonic Gains as Endurance Culture Deepens
Isotonic beverages accounted for the largest share, capturing 52.54% of the 2025 market volume. Their balanced carbohydrate-electrolyte composition supports rapid rehydration without excessive sugar, making them the preferred choice for gym sessions, team sports, and daily fitness routines. Brands like Lucozade Sport have strengthened their position by targeting football and running communities, emphasizing performance hydration during structured training. In contrast, hypertonic drinks are projected to grow at the fastest rate of 6.59% through 2031, driven by the increasing popularity of ultra-endurance events such as Ironman triathlons and multi-day cycling tours. These activities demand higher carbohydrate replenishment, shifting consumption from hydration to sustained energy fueling.
Electrolyte-enhanced water, marketed as premium hydration, gained traction in 2024. Brands like Liquid I.V. (owned by Unilever) leveraged powder-stick formats, allowing consumers to mix hydration solutions in reusable water bottles, addressing sustainability concerns. This innovation aligns with the trend toward clean and personalized hydration. Protein-based sports drinks, combining whey or plant protein with electrolytes, target post-workout recovery but face challenges with texture and shelf stability, limiting broader adoption. The market is evolving toward segmented solutions, with athletes increasingly tailoring hydration and fueling strategies based on workout intensity and duration, driving demand for diversified product portfolios.


By Packaging Type: Aseptic Cartons Solve the Clean-Label Shelf-Life Paradox
PET bottles accounted for the largest share of the packaging market in 2025, holding 56.38%. Their widespread adoption stems from consumer-friendly features such as resealability and transparency, which highlight product freshness. These attributes make PET bottles the preferred choice in supermarkets, convenience stores, and gyms. Their lightweight design and compatibility with high-speed filling lines enhance cost efficiency and enable broad distribution, reinforcing their dominance in mainstream hydration. Brands like Powerade continue to rely on PET formats to emphasize portability and resealability, catering to athletes during training and competition. In contrast, metal cans, while popular in energy drinks, capture only a mid-single-digit share in sports drinks due to metallic taste interactions with citrus flavors and consumer perceptions linking cans to carbonation rather than hydration.
Aseptic packaging is projected to grow at the fastest rate of 6.75% through 2031, offering a solution to the clean-label shelf-life paradox by extending natural formulations’ shelf life to 12 months without refrigeration or synthetic preservatives. This technology reduces reliance on artificial stabilizers while preserving flavor and nutrient integrity. Additionally, aseptic packaging enhances supply-chain efficiency by eliminating cold-chain costs, which can add USD 0.10–0.15 per unit in emerging markets, enabling broader distribution in rural areas. As sustainability, cost control, and clean formulations converge, aseptic solutions are positioned as a strategic enabler for next-generation sports drink expansion.
By Distribution Channel: Online Retail Rewrites the Loyalty Playbook
Supermarkets and hypermarkets accounted for the largest share of sales in 2025, contributing 57.17% by leveraging high foot traffic, promotional end-cap displays, and multi-pack discounts. These factors drive impulse purchases and bulk stocking among households and athletes, solidifying their dominance through strong visibility and competitive pricing. This positioning reinforces habitual brand selection in mainstream hydration categories. Convenience stores, holding a mid-teens share, cater to commuters, gym-goers, and manual laborers who prioritize proximity and speed over price. Specialty outlets, such as running shops and supplement retailers, provide expert validation and targeted assortments, but their limited footprint restricts their ability to scale mass-market volumes.
Online retail is projected to grow at the fastest rate of 6.68% through 2031, driven by subscription models that ensure repeat purchases and direct-to-consumer brands that bypass retailer margin pressures. Prime Hydration’s digital-first strategy, launching on its e-commerce platform before securing Walmart placement, illustrates how social-media-native brands can generate demand that compels traditional retailers to stock their products. Other channels, including vending machines and food services, capture single-digit shares but excel in high-margin on-premise consumption, seeding trials in gyms, offices, and sports venues. Online retail’s growth is further supported by personalized recommendations, subscription discounts, and access to niche SKUs. Amazon’s Subscribe & Save for sports drinks, offering 15% discounts for quarterly deliveries, exemplifies how platforms convert one-time buyers into loyal customers, reshaping customer acquisition and retention strategies.
By Functionality: Intra-Workout Hydration Moves From Niche to Necessity
Post-workout formulations are expected to retain the largest share of functionality-based sales, accounting for 47.56% in 2025. This dominance reflects decades of marketing that positioned sports drinks as recovery tools, consumed post-exercise to replenish fluids and glycogen. The entrenched perception of hydration as part of the cooldown phase continues to drive volume, particularly among mainstream gym-goers. However, growth in this segment is projected to decelerate through 2031 as consumers increasingly adopt the view that recovery begins during exercise. This shift is driving demand for intra-workout solutions, which are forecasted to grow at a rate of 6.52% during the same period. Backed by exercise science, these products address real-time electrolyte replacement to delay fatigue and sustain cognitive clarity during prolonged exertion. Brands like Skratch Labs are capitalizing on this trend by focusing on balanced carbohydrate and sodium delivery for endurance athletes, addressing the critical 60–90 minute performance window often overlooked in traditional recovery strategies.
Pre-workout beverages, typically caffeinated and marketed for energy rather than hydration, hold a smaller market share but overlap with the energy drink category, creating classification challenges in retail. Their stimulant-heavy positioning also raises concerns among caffeine-sensitive consumers and invites regulatory scrutiny, limiting broader adoption. Meanwhile, all-day hydration products, designed for casual sipping, are expanding usage occasions beyond the gym, further blurring the lines between sports drinks and enhanced water. Over time, brands are likely to consolidate overlapping product categories into clearer, use-case-driven packaging, simplifying consumer decision-making while maintaining product differentiation. This evolution will align functionalities with soft drink-type segmentation, such as hypertonic drinks for intra-workout carbohydrate delivery and hypotonic options for rapid hydration.
Geography Analysis
North America captured the largest share of global sports drink revenues in 2025, accounting for 37.69%. This leadership is attributed to decades of category development, extensive retail distribution, and cultural norms that integrate electrolyte consumption into youth sports, school athletics, and recreational fitness. These entrenched habits drive brand loyalty, particularly in convenience and mass retail channels. Brands like Gatorade have solidified their presence through sponsorships and grassroots programs, positioning hydration as a performance necessity. The region’s mature sports infrastructure and high fitness participation ensure consistent demand across training, competition, and recovery. This established culture supports premium product variants while maintaining strong baseline volumes, making North America a key revenue anchor despite slower growth compared to emerging markets.
Asia-Pacific is projected to grow at the fastest rate, with a CAGR of 6.20% through 2031. Growth drivers include government-led fitness initiatives, rising disposable incomes, and urbanization, which concentrates populations in gym-centric cities. In the India sports drink market, increased funding for programs like Khelo India and higher allocations to the Ministry for Youth Affairs and Sports highlight institutional support for organized sports and physical education, embedding hydration into daily routines. Japan’s functional beverage market, led by products like Otsuka’s Pocari Sweat, demonstrates how early category education fosters long-term consumption habits. These factors position Asia-Pacific as the fastest-growing and most structurally supported regional market.
Europe’s mature market experiences moderate growth, with competition driven by sustainability-focused innovations such as refillable bottles and plant-based packaging, alongside clean-label reformulations aligned with the EU’s Farm to Fork Strategy. South America’s growth is concentrated in Brazil and Argentina, where economic challenges limit premium pricing, but rising middle-class fitness participation sustains volume growth in mainstream segments. In the Middle East and Africa, South Africa, Saudi Arabia, and the United Arab Emirates lead adoption due to high temperatures and large expatriate populations, while Nigeria and Egypt represent long-term opportunities dependent on infrastructure and regulatory improvements.

Competitive Landscape
North America’s sports drink industry is moderately consolidated, with PepsiCo’s Gatorade and The Coca-Cola Company’s BodyArmor and Powerade leading the retail value. These market leaders utilize decades of brand equity, athlete endorsements, and strong retailer relationships to secure premium shelf placements and consumer trust. This dominance fosters habitual purchasing and loyalty but also creates organizational inertia, limiting their ability to quickly adapt to trends like clean-label formulations, functional ingredients, and sustainable packaging. Agile brands are capitalizing on this gap, responding swiftly to niche demands and building strong digital-native presences.
In Asia-Pacific and Europe, the industry is more fragmented due to the presence of regional players and private-label offerings. Regional brands such as Lucozade Sport in the United Kingdom and Pocari Sweat in Japan excel by tailoring flavors, hydration profiles, and marketing strategies to align with local fitness cultures. Private-label products further intensify competition by offering affordable sports hydration solutions while mimicking functional claims. This competitive environment drives incumbents to innovate continuously, experimenting with new formats, flavors, and functional additives to retain consumer interest and market share.
Growth opportunities are concentrated in functional ingredient stacking and format innovation. Emerging brands are combining electrolytes with adaptogens, probiotics, and nootropics to address performance, recovery, and wellness needs. For instance, Nuun has successfully introduced powder sticks and dissolvable tablets, reducing packaging waste and enabling personalized dosing, which appeals to environmentally conscious and performance-focused consumers. Similarly, concentrated liquids and portable formats offer customization and convenience, meeting modern consumer demands. These innovations allow smaller players to carve out niches while pressuring legacy brands to accelerate their evolution beyond traditional isotonic and hypertonic offerings.
Sports Drinks Industry Leaders
-
PepsiCo, Inc.
-
The Coca-Cola Company
-
Otsuka Holdings Co., Ltd.
-
Monster Beverage Corporation
-
Suntory Holdings Limited
- *Disclaimer: Major Players sorted in no particular order

Recent Industry Developments
- September 2025: Unwell Hydration, a U.S.-based functional beverage brand, announced the launch of its latest product: Unwell Hydration with Protein. This product combined the brand's signature electrolyte blend with whey isolate protein, offering a lighter and more refreshing alternative to traditional protein shakes. Each serving delivered 10g of protein, contained 60kcal, and included just 2g of sugar. Additionally, it provided 740mg of electrolytes and three essential B vitamins, targeting consumers who sought to refuel post-workout and meet their protein requirements on the go.
- June 2025: Powerade expanded its product portfolio with the launch of Powerade Xtra Sour, featuring three bold flavors: Cherry Kicker, Grape Shocker, and Peach Pucker. In addition to its standard offerings, Powerade Xtra Sour introduced a zero-sugar variant, available exclusively at Wendy’s locations. This version offered the same vibrant flavors and was accessible through Wendy’s Coca-Cola Freestyle dispensers.
- April 2025: Protein2o, a leading player in the clear protein drink sector, expanded its retail presence by entering 1,400 Target stores nationwide. This strategic move strengthened Protein2o's position in the ready-to-drink (RTD) protein beverage market. Target carried Protein2o's reformulated line of clear protein drinks, which were developed to meet the needs of consumers looking to increase their daily protein intake while staying hydrated, all without preservatives. Alongside popular flavors such as Strawberry Watermelon and Orange Mango, Target exclusively offered 4-packs of Protein2o's newest flavor, Lemon-Lime.
- February 2024: In a strategic marketing shift, beverage giant Suntory launched three new products under its Lucozade brand. Released in late February, the trio - Lucozade Sport Blue Force, Lucozade Energy Blue Burst, and Lucozade Alert Blue Rush - aimed to expand the brand's existing lineup.


Global Sports Drinks Market Report Scope
Electrolyte-Enhanced Water, Hypertonic, Hypotonic, Isotonic, Protein-based Sport Drinks are covered as segments by Soft Drink Type. Aseptic packages, Metal Can, PET Bottles are covered as segments by Packaging Type. Convenience Stores, Online Retail, Specialty Stores, Supermarket/Hypermarket, Others are covered as segments by Sub Distribution Channel. Africa, Asia-Pacific, Europe, Middle East, North America, South America are covered as segments by Region.
By Soft Drink Type
| Isotonic |
| Hypertonic |
| Hypotonic |
| Electrolyte-Enhanced Water |
| Protein-Based Sports Drinks |
By Packaging Type
| PET Bottles |
| Glass Bottles |
| Metal Cans |
| Aseptic Packages |
| Disposable Cups |
By Distribution Channel
| Supermarkets/Hypermarkets |
| Convenience Stores |
| Specialty Stores |
| Online Retail |
| Other Distribution Channels |
By Functionality
| Pre-Workout |
| Intra-Workout |
| Post-Workout |
| Others |
By Geography
| North America | United States |
| Canada | |
| Mexico | |
| Rest of North America | |
| Europe | Germany |
| United Kingdom | |
| Italy | |
| France | |
| Spain | |
| Netherlands | |
| Poland | |
| Belgium | |
| Sweden | |
| Rest of Europe | |
| Asia-Pacific | China |
| India | |
| Japan | |
| Australia | |
| Indonesia | |
| South Korea | |
| Thailand | |
| Singapore | |
| Rest of Asia-Pacific | |
| South America | Brazil |
| Argentina | |
| Colombia | |
| Chile | |
| Peru | |
| Rest of South America | |
| Middle East and Africa | South Africa |
| Saudi Arabia | |
| United Arab Emirates | |
| Nigeria | |
| Egypt | |
| Morocco | |
| Turkey | |
| Rest of Middle East and Africa |
| By Soft Drink Type | Isotonic | |
| Hypertonic | ||
| Hypotonic | ||
| Electrolyte-Enhanced Water | ||
| Protein-Based Sports Drinks | ||
| By Packaging Type | PET Bottles | |
| Glass Bottles | ||
| Metal Cans | ||
| Aseptic Packages | ||
| Disposable Cups | ||
| By Distribution Channel | Supermarkets/Hypermarkets | |
| Convenience Stores | ||
| Specialty Stores | ||
| Online Retail | ||
| Other Distribution Channels | ||
| By Functionality | Pre-Workout | |
| Intra-Workout | ||
| Post-Workout | ||
| Others | ||
| By Geography | North America | United States |
| Canada | ||
| Mexico | ||
| Rest of North America | ||
| Europe | Germany | |
| United Kingdom | ||
| Italy | ||
| France | ||
| Spain | ||
| Netherlands | ||
| Poland | ||
| Belgium | ||
| Sweden | ||
| Rest of Europe | ||
| Asia-Pacific | China | |
| India | ||
| Japan | ||
| Australia | ||
| Indonesia | ||
| South Korea | ||
| Thailand | ||
| Singapore | ||
| Rest of Asia-Pacific | ||
| South America | Brazil | |
| Argentina | ||
| Colombia | ||
| Chile | ||
| Peru | ||
| Rest of South America | ||
| Middle East and Africa | South Africa | |
| Saudi Arabia | ||
| United Arab Emirates | ||
| Nigeria | ||
| Egypt | ||
| Morocco | ||
| Turkey | ||
| Rest of Middle East and Africa | ||


Market Definition
- Carbonated Soft Drinks (CSDs) - Carbonated soft drinks (CSDs) refer to non-alcoholic beverages that are carbonated and typically flavored, containing dissolved carbon dioxide to create effervescence. These beverages commonly include cola, lemon-lime, orange, and various fruit-flavored sodas. Marketed in cans, bottles, or fountain dispense.
- Juices - We have considered packaged juices which encompass non-alcoholic beverages derived from fruits, vegetables, or a combination thereof, processed and sealed in various packaging formats such as bottles, cartons, or pouches. Excluding fresh juices, this market segment involves commercially prepared and preserved juices, often with added preservatives and flavors.
- Ready-to-Drink (RTD) Tea and RTD Coffee - Ready-to-Drink (RTD) tea and RTD coffee are pre-packaged, non-alcoholic beverages that are brewed and prepared for consumption without further dilution. RTD tea typically includes various tea varieties, infused with flavors and sweeteners, and comes in bottles, cans, or cartons. Similarly, RTD coffee involves pre-brewed coffee formulations, often mixed with milk, sugar, or flavorings, and is conveniently packaged for on-the-go consumption.
- Energy Drinks - Energy drinks are non-alcoholic beverages formulated to provide a quick boost of energy and alertness. Whereas, sports drinks are beverages designed to hydrate and replenish electrolytes, particularly after physical exertion, exercise, or intense activity
| Keyword | Definition |
|---|---|
| Carbonated Soft Drinks | Carbonated soft drinks (CSDs) are a combination of carbonated water and flavouring, sweetened by sugar or a non-sugar sweeteners. |
| Standard Cola | Standard Cola is defined as the original flavor of cola soda. |
| Diet Cola | A cola-based soft drink containing no or low amounts of sugar |
| Fruit Flavored Carbonates | A carbonated beverage prepared from fruit juice/fruit flavor with carbonated water and containing sugar, dextrose, invert sugar or liquid glucose either singly or in combination. It may contain peel oil and fruit essences. |
| Juice | Juice is a drink made from the extraction or pressing of the natural liquid contained in fruit and vegetables. |
| 100% Juice | Fruit/vegetable juice made from fruit in the form of its juice with no water added to make up the volume. It is not permitted to add sugars, sweeteners, preservatives, flavourings or colourings to fruit juice. |
| Juice Drinks (up to 24% Juice) | Fruit/vegetable juice drinks with up to 24% fruits/vegetable extract. |
| Nectars (25-99% Juice) | Juices that can have between 25 and 99% of fruit, with the minimum legal limits defined depending on the type of fruit |
| Juice concentrates | Juice Concentrates are those form of juices when most of this liquid is removed resulting in a thick, syrupy product known as juice concentrate. |
| RTD Coffee | Packaged coffee beverages that are sold in a prepared form and are ready for consumption at the time of purchase. |
| Iced Coffee | An iced coffee is a cold version of coffee, usually a combination of hot espresso and milk with ice added to it. |
| Cold Brew Coffee | Cold brew also called cold water extraction or cold pressing is made by steeping ground coffee in room-temperature water for several hours. |
| RTD Tea | Ready-to-drink (RTD) tea is a packaged tea product ready for immediate consumption without brewing or preparation |
| Iced Tea | Ice tea or iced tea is a drink made from tea without milk but with sugar and sometimes fruit flavourings, drunk cold. |
| Green Tea | Green tea is a tea beverage which promotes mental alertness, relieving digestive symptoms and promoting weight loss. |
| Herbal Tea | Herbal tea beverages are made from the infusion or decoction of herbs, spices, or other plant material in hot water. |
| Energy Drink | A type of drink containing stimulant compounds, usually caffeine, which is marketed as providing mental and physical stimulation. They may or may not be carbonated and may also contain sugar, other sweeteners, or herbal extracts, among numerous possible ingredients. |
| Sugar-free or Low-calories Energy Drinks | Sugar-free or Low-calories Energy Drinks are sugar-free, artificially sweetened energy drinks with few or no calories. |
| Traditional Energy Drink | Traditional Energy Drinks are functional soft drinks containing ingredients designed to boost the consumer's energy. |
| Natural/Oraganic Energy Drinks | Natural/Organic energy drinks are energy drinks free of artificial sweeteners and synthetic colorings. Instead, they contain naturally derived ingredients such as green tea, yerba mate, and botanical extracts. |
| Energy Shots | A small but highly concentrated energy drink that contains large amounts of caffeine and/or other stimulants. The quantity is comparatively smaller compared to energy drinks. |
| Sports Drink | Sports drinks are beverages designed specifically for the rapid supply of fluid, carbohydrates, and electrolytes before, during or after exercise. |
| Isotonic | Isotonic drinks contain similar concentrations of salt and sugar as in the human body, and are designed to quickly replace fluids lost during exercise but with an increase of carbohydrate. |
| Hypertonic | Hypertonic drinks have a higher concentration of salt and sugar than the human body. They are best drunk after exercise as it is important to replace glycogen levels quickly after exercise. |
| Hypotonic | Hypotonic drinks are designed to quickly replace fluids lost during exercise. They have very low carbohydrate content and a lower concentration of salt and sugar than the human body. |
| Electrolyte-Enhanced Water | Electrolyte water is water infused with electrically-charged minerals, such as sodium, potassium, calcium, and magnesium. |
| Protein-based Sport Drinks | Protein-based sports drinks are those sports drinks which has added protein in it that will improve performance and reduce muscle protein breakdown. |
| On-Trade | The on-trade refers to places that sell beverages for immediate consumption on the premises like bars, restaurants, and pubs |
| Off-Trade | Off-trade usually means places like liquor stores, supermarkets and other places where you don't consume the beverage right away. |
| Convenience Store | A retail business that provides the public with a convenient location to quickly purchase a wide variety of consumable products and services, generally food and gasoline. |
| Specialty store | A specialty store is a shop/store that carries a deep assortment of brands, styles, or models within a relatively narrow category of goods |
| Online Retail | Online retail is a type of eCommerce whereby a business sells goods or services directly to consumers from a website. |
| Aseptic Packaging | Aseptic packaging refers to the filling of a cold, commercially sterile product under sterile conditions into a presterilized container and closure under sterile conditions to form a seal that effectively excludes microorganisms. These includes tetra packs, cartons, pouches etc. |
| PET Bottle | PET bottle means a bottle made of polyethylene terephthalate. |
| Metal Cans | Metal containers made of aluminum or tin- plated or zinc-plated steel, which are commonly used for packaging food, beverages or other products. |
| Disposable Cups | Disposable Cup means a cup or other container designed for single use to serve beverages, such as water, cold drinks, hot drinks and alcoholic beverages. |
| Gen Z | A way of referring to the group of people who were born in the late 1990s and early 2000s. |
| Millenial | Anyone born between 1981 and 1996 (ages 23 to 38 in 2019) is considered a Millennial |
| Taurine | Taurine is an amino acid that supports immune health and nervous system function. |
| Bars & Pubs | It is a drinking establishment licensed to serve alcoholic drinks for consumption on the premises. |
| Café | It is a foodservice establishment serving refreshments (mainly coffee) and light meals. |
| On the go | It means doing / dealing with while busily engaged with something and not diverting plans in order to accommodate. |
| Internet Penetration | The Internet Penetration Rate corresponds to the percentage of the total population of a given country or region that uses the Internet. |
| Vending Machine | A machine that dispenses small articles such as food, drinks, or cigarettes when a coin or token is inserted |
| Discount store | A discount store or discounter offers a retail format in which products are sold at prices that are in principle lower than an actual or supposed "full retail price". Discounters rely on bulk purchasing and efficient distribution to keep down costs. |
| Clean Label | Clean label on the beverage market are drinks that are made from few ingredients of natural origin and are not or only slightly processed. |
| Caffeine | An alkaloid compound which is a stimulant of the central nervous system. It is mainly used recreationally, as a mild cognitive enhancer to increase alertness and attentional performance. |
| Extreme sport | Action sports, adventure sports or extreme sports are activities perceived as involving a high degree of risk. |
| High-intensity interval training | It incorporates several rounds that alternate between several minutes of high intensity movements to significantly increase the heart rate to at least 80% of one's maximum heart rate, followed by short periods of lower intensity movements. |
| Shelf life | The length of time for which an item remains usable, fit for consumption, or saleable. |
| Cream Soda | Cream soda is a sweet soft drink. Generally flavored with vanilla and based on the taste of an ice cream float |
| Root Beer | Root beer is a sweet North American soft drink traditionally made using the root bark of the sassafras tree Sassafras albidum or the vine of Smilax ornata as the primary flavor. Root beer is typically, but not exclusively, non-alcoholic, caffeine-free, sweet, and carbonated. |
| Vanilla Soda | A carbonated soft drink flavoured with vanilla. |
| Dairy-Free | A product that does not contain any milk or milk products from cows, sheep or goats. |
| Caffeine-Free Energy Drinks | Caffeine-free energy drinks rely on other ingredients to boost the energy. Popular choices include amino acids, B vitamins, and electrolytes. |


Research Methodology
Mordor Intelligence follows a four-step methodology in all our reports.
- Step-1: IDENTIFY KEY VARIABLES: In order to build a robust forecasting methodology, the variables and factors identified in Step 1 are tested against available historical market numbers. Through an iterative process, the variables required for market forecast are set, and the model is built on the basis of these variables.
- Step-2: Build a Market Model: Market-size estimations for the forecast years are in nominal terms. Inflation is not a part of the pricing, and the average selling price (ASP) is kept constant throughout the forecast period for each country.
- Step-3: Validate and Finalize: In this important step, all market numbers, variables, and analyst calls are validated through an extensive network of primary research experts from the market studied. The respondents are selected across levels and functions to generate a holistic picture of the market studied.
- Step-4: Research Outputs: Syndicated reports, custom consulting assignments, databases & subscription platforms


