
Spoil Detection Based Smart Labels Market Size and Share
Market Overview
| Study Period | 2020 - 2031 |
|---|---|
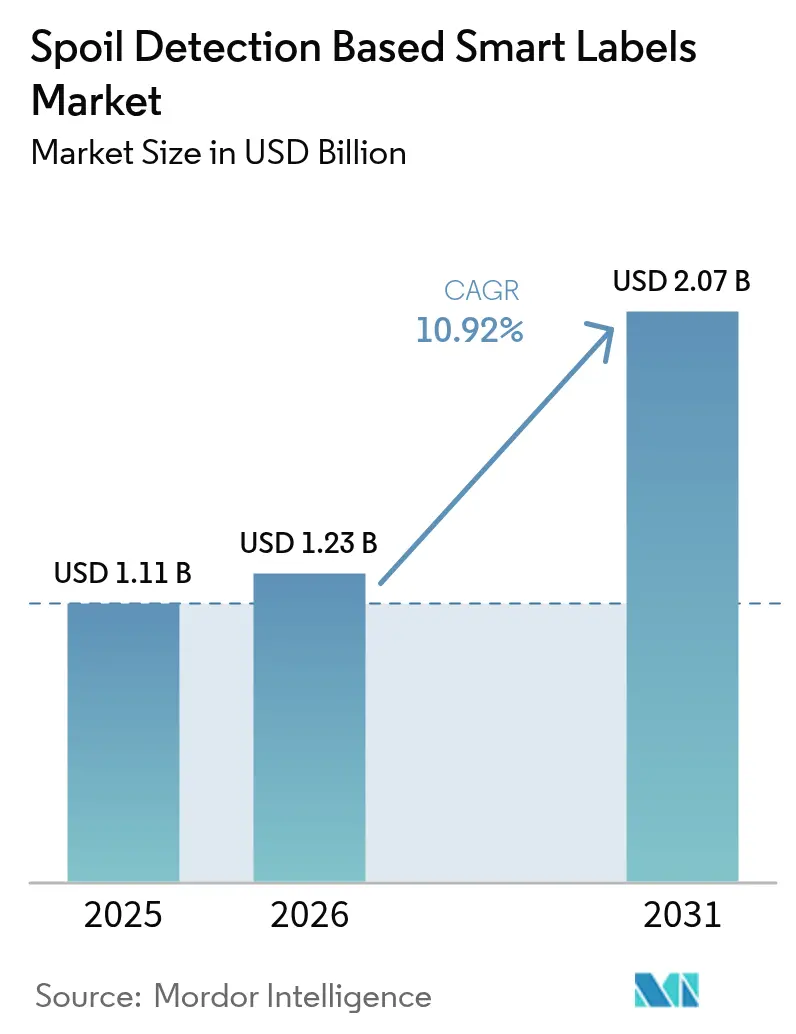
| Market Size (2026) | USD 1.23 Billion |
| Market Size (2031) | USD 2.07 Billion |
| Growth Rate (2026 - 2031) | 10.92 % |
| Fastest Growing Market | Asia Pacific |
| Largest Market | North America |
| Market Concentration | Medium |
Major Players *Disclaimer: Major Players sorted in no particular order Image © Mordor Intelligence. Reuse requires attribution under CC BY 4.0. | |
Spoil Detection Based Smart Labels Market Analysis by Mordor Intelligence
The spoil detection based smart labels market size was valued at USD 1.11 billion in 2025 and estimated to grow from USD 1.23 billion in 2026 to reach USD 2.07 billion by 2031, at a CAGR of 10.92% during the forecast period (2026-2031). Strong policy pressure on food-waste reduction, the rapid expansion of cold-chain infrastructure, and retail mandates that link dynamic pricing to verifiable freshness form the backbone of demand. Investment decisions have shifted from incremental cost savings to risk management, with brand owners viewing real-time freshness data as insurance against recalls. The International Finance Corporation estimates that keeping pace with 2050 cold-chain needs will demand USD 160 billion in annual capital, much of it tied to sensor-enabled packaging that pre-empts spoilage rather than documenting it after the fact. As a result, suppliers that provide labels capable of logging time-temperature events or biochemical spoilage markers now negotiate multi-year supply contracts instead of pilot-scale trials, accelerating scale economies.
Key Report Takeaways
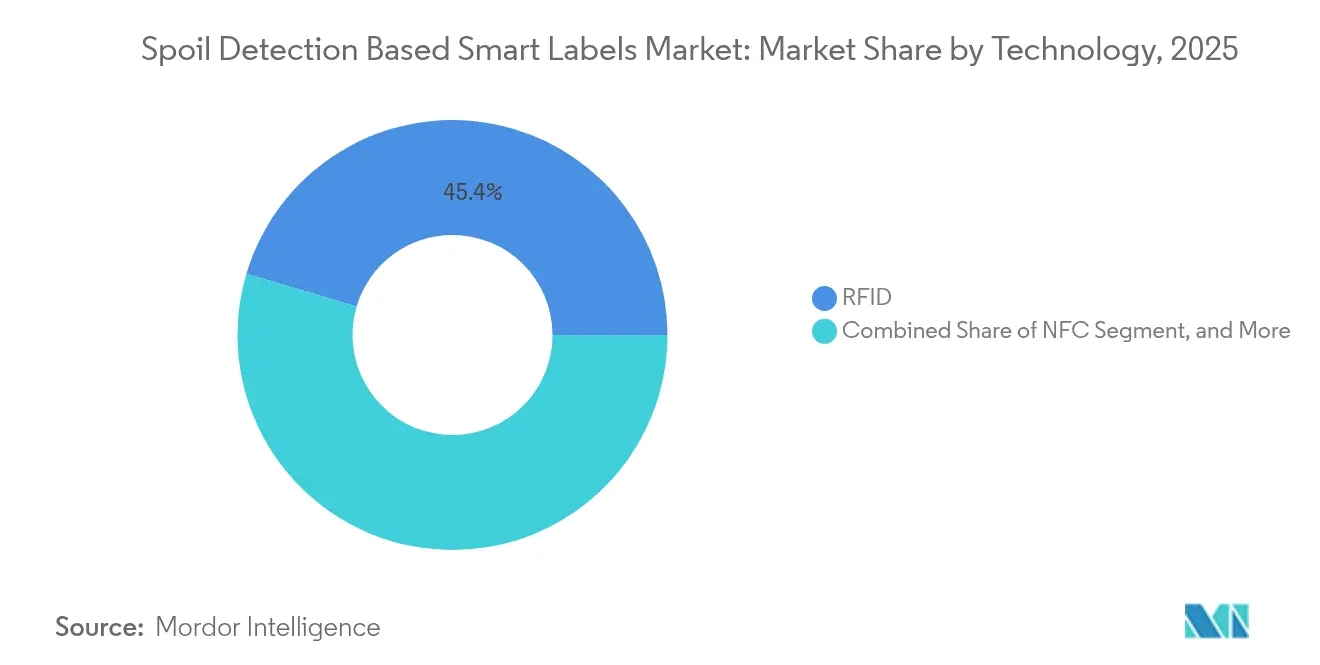
- By technology, RFID captured 45.40% of the spoil detection based smart labels market share in 2025, while NFC is expected to record the fastest 11.62% CAGR through 2031.
- By end-user industry, food and beverage accounted for 61.20% of 2025 revenue; logistics and supply-chain deployments are forecast to expand at an 11.34% CAGR between 2026-2031.
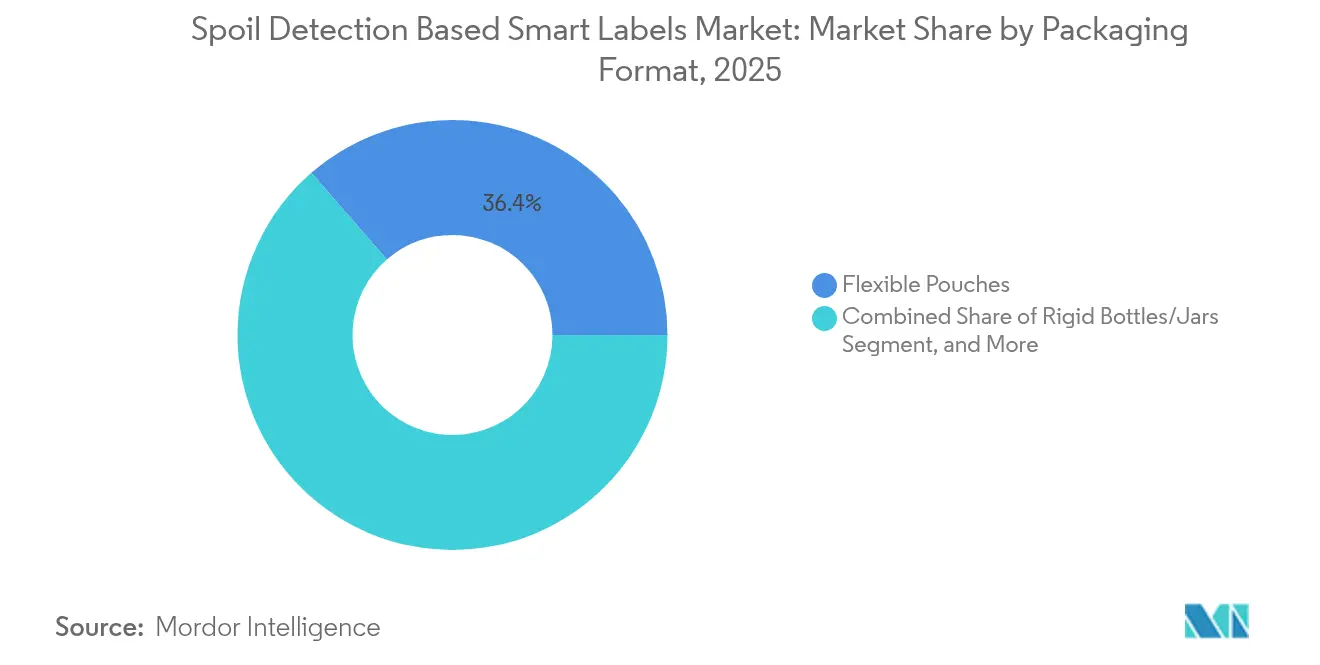
- By packaging format, flexible pouches held 36.40% of 2025 revenue, and this format is projected to increase at a 12.31% CAGR through 2031.
- By freshness-indicator mechanism, colorimetric chemical indicators led with 40.50% revenue in 2025, while biosensor-based indicators are set to grow at an 11.58% CAGR to 2031.
- Asia-Pacific commanded 32.10% of global 2025 revenue and is expected to post a 12.01% CAGR, the fastest regional expansion during the forecast period.
Note: Market size and forecast figures in this report are generated using Mordor Intelligence’s proprietary estimation framework, updated with the latest available data and insights as of 2026.
Global Spoil Detection Based Smart Labels Market Trends and Insights
Drivers Impact Analysis*
| Driver | (~) % Impact on CAGR Forecast | Geographic Relevance | Impact Timeline |
|---|---|---|---|
| Growing Demand for Real-Time Food Freshness Monitoring | 2.30% | Global, with early concentration in North America and Europe | Medium term (2-4 years) |
| Rising Consumer Emphasis on Food Safety and Hygiene | 1.80% | Global, strongest in Asia-Pacific urban centers and North America | Short term (≤ 2 years) |
| Expansion of Cold-Chain Logistics Networks Globally | 2.10% | Asia-Pacific core, spill-over to Middle East and Africa | Long term (≥ 4 years) |
| Integration of Spoil Detection Labels with IoT Platforms | 1.60% | North America and Europe, with pilot deployments in Asia-Pacific | Medium term (2-4 years) |
| Retailer Push for Dynamic Pricing Based on Freshness | 1.40% | Europe and North America, limited adoption in emerging markets | Short term (≤ 2 years) |
| Government Subsidies for Anti-Food-Waste Technologies | 1.20% | Europe (EU Horizon funding), Brazil (Green Seal), Japan (Food Loss Act) | Long term (≥ 4 years) |
| Source: Mordor Intelligence | |||


Growing Demand for Real-Time Food Freshness Monitoring
Food distributors are replacing static date codes with sensors that confirm freshness throughout transit, because time-temperature abuse can make products unsafe days before printed dates. The United Nations Environment Programme reported that 13.2% of food is lost between harvest and retail and a further 19% is wasted beyond retail, a footprint that generates 8-10% of global greenhouse-gas emissions. Walmart’s October 2025 requirement that suppliers attach RFID tags to all fresh-food shipments turns food waste into a compliance issue, pushing producers to adopt spoilage indicators that trigger automatic inventory adjustments.[1]Avery Dennison Corporation, “Walmart Partnership for RFID Fresh Food Tagging,” averydennison.com SpotSee’s battery-free WarmMark QR, launched in January 2025, offers ±1 °C accuracy and a two-year shelf life, illustrating the new economics that make single-use sensors viable at scale. The trajectory ensures that the spoil detection based smart labels market will benefit from both regulatory enforcement and private cost avoidance.
Rising Consumer Emphasis on Food Safety and Hygiene
Post-pandemic shoppers now treat verifiable freshness as essential, particularly parents and caregivers for immunocompromised consumers. Retail pilots in Japan and South Korea use NFC-enabled labels that allow smartphone scans, turning cold-chain data into a point-of-sale marketing asset. Brands that deliver real-time spoilage status gain shelf preference, while those relying solely on printed dates risk reputational damage. Price-premium segments such as organic produce and grass-fed meats can absorb the 5-10-fold cost premium of smart labels. China’s State Council cold-chain mandates reinforce the trend by penalizing non-compliant freshness monitoring.[2]Government of China, “State Council Cold-Chain Mandates,” gov.cn These forces promote steady penetration of the spoil detection based smart labels market in urban Asia-Pacific.
Expansion of Cold-Chain Logistics Networks Globally
Emerging markets are investing heavily in refrigerated storage and transport, and lenders now require documented temperature compliance before releasing funds. Brazil’s national cattle-tracking platform, announced in October 2024, sets a precedent for mandatory digital identifiers on perishables, a move that parallels smart label adoption in agricultural exports. In India, fragmented cold-chain capacity creates both risk and opportunity: demand for monitoring is high, yet inconsistent enforcement restrains immediate uptake. Nevertheless, multilateral finance and development-bank programs earmark significant capital for cold-chain monitoring, strengthening the long-term outlook for the spoil detection based smart labels market.
Integration of Spoil Detection Labels with IoT Platforms
High-volume retailers increasingly view spoil-detection data as an extension of store-wide IoT networks. Energous secured a scalable contract in December 2024 with a Fortune 10 retailer to deploy wireless power transmitters, signalling a shift from pilot to production scale. The company’s AI-enabled PowerBridge family, released in March 2025, supports battery-free sensor tags that broadcast freshness data, eliminating costly battery maintenance.[3]Energous Corporation, “PowerBridge Product Family Launch,” energous.com Kezzler’s February 2025 acquisition of Scanbuy marries serialization platforms with QR codes, enabling compliance with U.S. FSMA 204 and EU Digital Product Passport while delivering consumer-facing freshness proof.[4]Kezzler, “Acquisition of Scanbuy,” kezzler.com These converging technologies justify higher label expenditure by layering supply-chain visibility, consumer engagement, and regulatory traceability onto a single asset.
Restraints Impact Analysis*
| Restraint | (~) % Impact on CAGR Forecast | Geographic Relevance | Impact Timeline |
|---|---|---|---|
| High Unit Cost Versus Traditional Date Codes | -1.90% | Global, most acute in price-sensitive emerging markets | Short term (≤ 2 years) |
| Lack of Global Interoperability Standards | -1.30% | Global, with fragmentation across North America, Europe, and Asia-Pacific | Medium term (2-4 years) |
| Data-Privacy Concerns in NFC and RFID-Based Labels | -0.80% | Europe (GDPR), North America (CCPA), with spillover to Asia-Pacific | Medium term (2-4 years) |
| Limited Shelf-Life of Certain Chemical Indicator Inks | -0.60% | Global, particularly affecting tropical and high-humidity markets | Short term (≤ 2 years) |
| Source: Mordor Intelligence | |||
High Unit Cost Versus Traditional Date Codes
Smart labels cost five to ten times more than printed expiration dates, eroding margins on low-value SKUs such as bagged salads. Procurement teams revert to cheaper date codes unless compelled by regulation or retailer mandate. Energous and other vendors now pursue battery-free sensor designs to lower total cost of ownership, while SpotSee promotes WarmMark QR’s recyclable materials to align with sustainability-driven purchasing. The price hurdle is particularly binding in South America and Africa, where buyers prioritize refrigeration hardware over monitoring.
Lack of Global Interoperability Standards
ISO 18416 and GS1 offer partial guidance, yet no unified framework addresses sensor calibration or wireless protocols. Multinational brands juggle RFID in North America, NFC in Europe, and colorimetric indicators in Asia-Pacific, losing scale economies. GDPR Article 25 adds data-protection overhead for European NFC and RFID deployments. Brazil’s national agrochemical traceability scheme mandates Brasil-ID and Rastro-ID, further complicating harmonization and slowing global rollouts.
*Our forecasts treat driver/restraint impacts as directional, not additive. The impact forecasts reflect baseline growth, mix effects, and variable interactions.
Segment Analysis
By Technology: RFID Dominance Challenged by NFC Consumer Engagement
RFID captured 45.40% revenue in 2025, reflecting established reader infrastructure in warehouses and stores. The spoil detection based smart labels market size for RFID is projected to reach USD 0.94 billion by 2031, expanding in lockstep with automated inventory systems. Conversely, NFC is forecast to grow at 11.62%, outpacing the overall spoil detection based smart labels market as smartphone scanning becomes mainstream. The RAIN RFID Alliance highlights that ultra-high-frequency RFID reads hundreds of items per second without line-of-sight, making it indispensable for pallet and case tracking. NFC’s proximity requirement turns each package into a point of interaction, opening new promotional and data-collection channels. Energous’ battery-free e-Sense tags, introduced June 2025, promise to lower operating costs for both RFID and future ambient-IoT hybrids. As economies improve, hybrid deployments that alternate between long-range RFID for logistics and NFC for consumer engagement will accelerate.
Sensing labels and time-temperature indicators serve high-value pharmaceuticals, where regulators treat excursion records as part of batch-release documentation. Photonic and oxygen-reactive labels remain niche but are indispensable for modified-atmosphere packaging in ready-to-eat meals. Innovations such as printed graphene antennas and enzyme-linked biosensors will further diversify the technology mix, ensuring continued fragmentation and rapid innovation in the spoil detection based smart label industry.


By End-User Industry: Food Leads, Logistics Accelerates
Food and beverage maintained 61.20% of 2025 revenue, equal to the largest slice of the spoil detection based smart labels market size, and benefits directly from retailer mandates and stringent hygiene norms. Logistics and supply-chain applications are projected to post an 11.34% CAGR, lifting their share as third-party logistics providers embed liability protections. Pharmaceutical cold chains adopt the highest-cost sensor suites, because regulatory fines dwarf labelling expenses and because biologics spoilage is irreversible. Cosmetics, personal care, tissue samples, and specialty chemicals round out demand as spoilage detection crosses into new perishable categories. Walmart’s 2025 RFID requirement converts smart labels from optional to obligatory in North America, demonstrating how a single retailer can bend the growth trajectory of the spoil detection based smart labels market.
A shift toward direct-to-consumer grocery delivery widens use cases for item-level sensors. Brands that link fin-to-fork or farm-to-fork data in mobile apps gain measurable lifts in repeat purchase rates. Logistics providers, under pressure to document chain-of-custody, now view smart labels as both marketing moat and compliance shield, driving cross-industry convergence in device specifications.
By Packaging Format: Flexible Pouches Enable Seamless RFID Integration
Flexible pouches held 36.40% revenue in 2025, aided by the ability to embed antennas during laminate production, circumventing adhesive labels that can delaminate. The spoil detection based smart labels market share for pouches is predicted to rise by 260 basis points by 2031 as snack, meat, and liquid food brands migrate to ultra-light films. Rigid containers face higher application labour and risk tag detachment; however, they remain important for beverages, sauces, and pharmaceuticals that demand barrier-layer integrity. Cartons and boxes provide mid-range opportunities, especially in e-commerce, where smart labels simplify returns and warranty workflows. Best Package Solutions markets RFID-embedded pouches as inventory game-changers, while Thinfilm demonstrates NFC-printed electronics that integrate temperature sensing.
Unit economics vary simple colorimetric dots cost cents, whereas active NFC-enabled, multi-threshold sensors approach USD 2 per unit. As roll-to-roll printing yields improve and battery-free architectures proliferate, cost convergence across formats will reduce the differential and push wider adoption in the spoil detection based smart labels market.
By Freshness-Indicator Mechanism: Biosensors Gain on Colorimetric Incumbents
Colorimetric indicators secured 40.50% revenue in 2025 on the strength of simplicity and zero power requirement. Biosensor-based tags, however, are set to grow at an 11.58% CAGR, aided by pharmaceutical demand for enzyme-linked specificity. Gas-sensing indicators that detect oxygen, carbon dioxide, or ethylene now ship in modified-atmosphere packages for fresh-cut produce. Hybrid multi-parameter devices combine time, temperature, and gas measurement in a single label, commanding premium prices but supplying the most comprehensive assurance.
MIT researchers demonstrated an RFID pH sensor capable of wireless spoilage detection, signalling academic momentum behind biosensor commercialization. SpotSee’s ColdChain Complete and Evigence’s FreshSense platform illustrate how offline visual changes and cloud analytics can coexist, enabling low-infrastructure deployments alongside full IoT ecosystems. As rule-making bodies tighten tolerances for biologics and specialty foods, demand for high-specificity biosensors will intensify and drive diversification within the spoil detection based smart label industry.
Geography Analysis
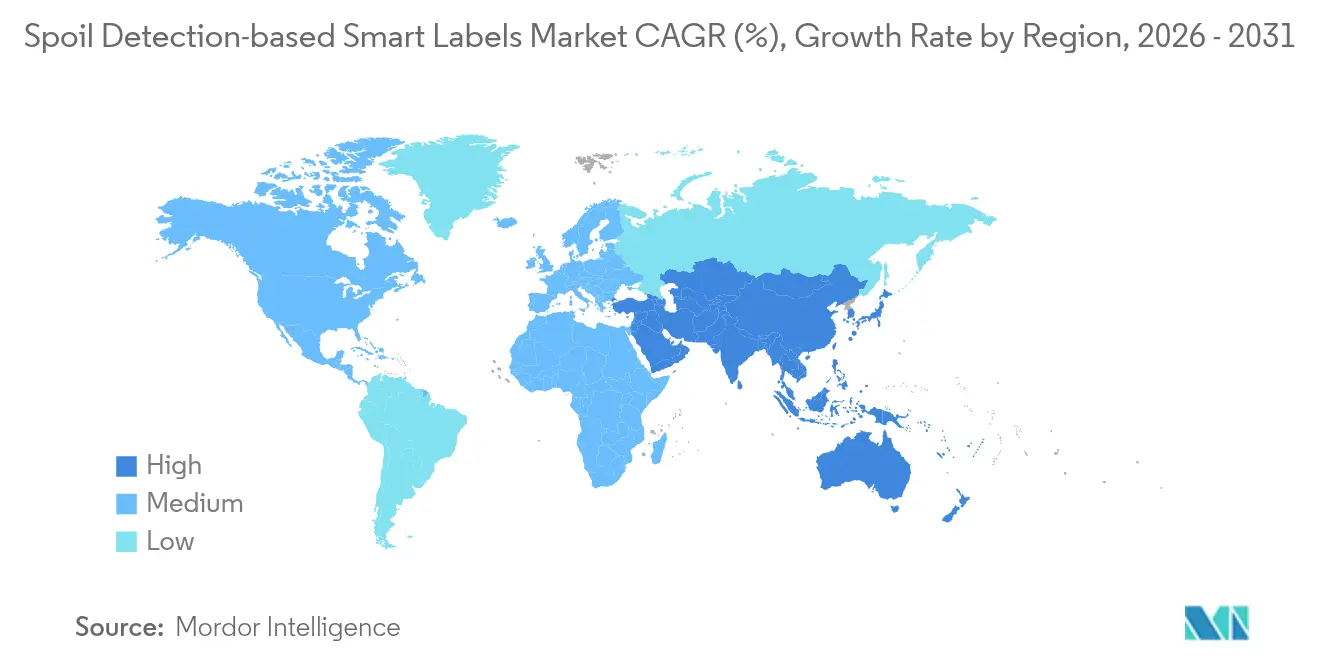
Asia-Pacific led with 32.10% 2025 revenue and is projected to expand at a 12.01% CAGR, the highest among all regions in the spoil detection based smart labels market. China’s State Council mandated end-to-end cold-chain traceability, transforming voluntary monitoring into legal obligation and boosting label uptake among importers and domestic packers. Japan’s Food Loss Reduction Promotion Act promotes technologies that extend shelf life or enable dynamic pricing, while South Korea funds smart farm projects that integrate spoilage sensors from greenhouse to retailer. India’s FSSAI guidelines create demand but uneven enforcement tempers near-term growth. Australia and New Zealand adopt sensors quickly for high-value meat exports, and Southeast Asian economies follow, spurred by cross-border retail chains.
North America benefits from mature RFID infrastructure. Walmart’s 2025 supplier mandate accelerates penetration, but retailer bargaining power compresses margins for label makers. The U.S. EPA Food Recovery Challenge nudges adoption, while Canada largely mirrors U.S. retailer requirements. Mexico’s emerging cold-chain corridor for berries and avocados creates incremental opportunities but lags in enforcement.
Europe enforces some of the strictest waste and traceability rules. The EU Farm-to-Fork Strategy sets 2030 food-waste reduction targets, and the Digital Product Passport demands life-cycle transparency. GDPR data-protection requirements add cost to NFC and RFID deployments, but retailers such as Tesco and Sainsbury’s test OnVu indicators to automate markdowns. Germany, the United Kingdom, and France dominate regional spend, while Eastern Europe and the Balkans follow at a slower pace. The Middle East and Africa show patchy adoption; however, Gulf Cooperation Council states invest in cold-chain security under Vision 2030, and South Africa’s organized retail sector is piloting smart labels for premium imports.

Regulatory Landscape
Spoil-detection smart labels sit at the intersection of food-contact materials rules, labeling requirements for active and intelligent packaging, and supply-chain traceability obligations. In the European Union, Regulation (EC) No 1935/2004 establishes the overarching framework for materials intended to come into contact with food, while Commission Regulation (EC) No 450/2009 sets specific requirements for active and intelligent materials. These include controls to avoid misleading consumers and requirements to label components that are not edible. Together, these rules influence how indicator chemistries, adhesives, and printed electronics are specified, especially where freshness indicators could be interpreted as interacting with the product or its headspace.
In the United States, food-contact substances that function as food additives require FDA pre-market authorization under the FD&C Act framework, affecting the choice of inks, adhesives, and functional layers used alongside sensor or indicator components. Separately, the FDA Food Traceability Rule (21 CFR part 1, subpart S) establishes additional recordkeeping requirements for certain high-risk foods, with compliance timelines centered around January 20, 2026. This is pushing suppliers and retailers toward digital identifiers and systems that can support faster product-level traceability. In India, the Food Safety and Standards (Packaging) Regulations, 2018, as compiled and updated by FSSAI (April 2025 compendium), reinforce food-grade requirements and migration limits for direct-contact materials. This shapes vendor qualification and the need for functional barriers when integrating spoilage-indicator elements into labels used on packaged foods.
Competitive Landscape
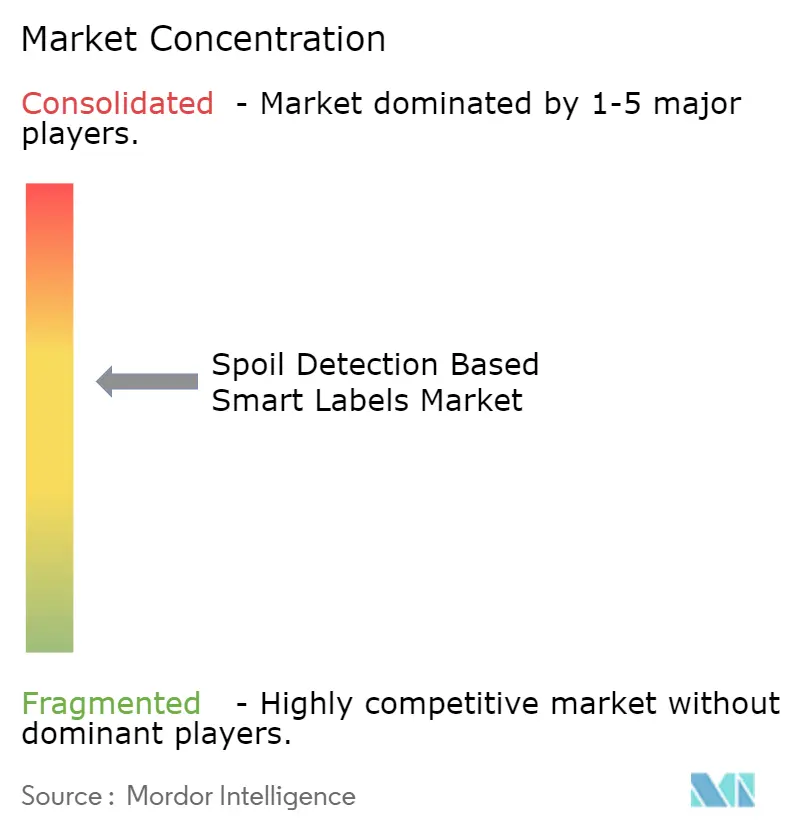
The spoil detection based smart labels market is moderately concentrated, with no vendor exceeding 15% share, yet consolidation is quickening. Avery Dennison’s acquisition of Smartrac’s RFID inlay unit in 2019 for EUR 225 million (USD 247 million) created the world’s largest UHF inlay platform and underpins Walmart-compliant M800 product launches. Kezzler’s February 2025 purchase of Scanbuy combines serialization, QR-code engagement, and cloud analytics, positioning the firm for FSMA 204 and Digital Product Passport workflows.
Strategic innovation centers on lowering cost and expanding functionality. Energous introduced the battery-free e-Sense tag in June 2025, pioneering ambient-IoT power harvesting and reshaping unit economics for temperature logging. Zebra Technologies’ Enterprise Visibility segment recorded a 33.1% 2024 sales lift driven by RFID printers and location technologies, underscoring retailer demand for integrated hardware. Start-ups such as Ynvisible pursue electrochromic displays for visual freshness cues without electronic readers, and Varcode’s Smart Barcode platform ties freshness data to dynamic pricing, appealing to retailers seeking markdown automation.
White-space opportunities center on biosensor indicators for pharmaceutical cold chains and wireless-power architectures that remove battery dependencies. Competitive differentiation increasingly depends on interoperability with cloud platforms, multi-region regulatory coverage, and total cost of ownership rather than unit price alone.
Spoil Detection Based Smart Labels Industry Leaders
Evigence Sensors
Insignia Technologies
Avery Dennison Corporation
Innoscentia
SpotSee
- *Disclaimer: Major Players sorted in no particular order

Market Opportunities and Future Outlook
White-space growth centers on solutions that combine item-level identity (RFID, QR, or NFC) with time-temperature or chemistry-based spoilage signals. The FDA Food Traceability Rule implementation milestones centered on January 20, 2026 further strengthen the case for these solutions by supporting faster investigations and smoother store operations.
Near-term opportunities focus on scaling manufacturing and conversion for battery-free, low-footprint designs that can run through existing packaging lines and reduce the total cost of deployed tags versus active, battery-based options. Industry activity also points to production-readiness work, including a May 2026 collaboration between George Schmitt and Co. and Wiliot to convert, test, and manufacture smart packaging solutions. Material innovation, including paper-based and printable sensor approaches showcased at industry forums (for example, the sensor and paper-based smart packaging exhibits at the AIPIA/AWA Smart Packaging World Congress in May 2026), supports broader adoption in formats like flexible packaging, while maintaining interoperability with enterprise platforms used for serialization and traceability. Across regions, differing food-contact compliance frameworks (EU 1935/2004 and 450/2009, US FDA authorization pathways, and India FSSAI packaging rules) keep certification and documentation capabilities as a differentiator for suppliers expanding globally.
Recent Industry Developments
- February 2026: Avery Dennison announced expansion of its AD IdentiFresh inlay series to multi-market deployment, signaling enterprise-scale adoption for fresh-food supply chains. The update broadens the reach of shelf-ready smart labels and supports more consistent, real-time inventory visibility across retailers and suppliers.
- October 2025: Avery Dennison collaborated with Walmart to launch RFID-enabled label technology for fresh food departments including meat, bakery, and deli. The collaboration advanced item-level tagging deeper into perishables, connecting compliance requirements with operational workflows such as receiving, stock rotation, and shrink reduction.
- July 2024: Evigence announced general availability of its Freshness Management Platform featuring FreshSense, using chemistry-embedded QR codes for item-level freshness monitoring and temperature tracking. The platform broadened market choice beyond RFID-only approaches by pairing visible, pack-level indicators with digital data capture.


Research Methodology Framework and Report Scope
Market Definition and Coverage
This market covers labels and tags that provide a visible or machine-readable signal about product freshness or spoilage risk across storage and transport, and the value is counted as the smart label component sold into end uses.
Scope exclusions: We exclude standard tracking-only labels that do not indicate freshness or spoilage conditions, and we do not count the value of the packaged product itself.
Segmentation Overview
- By Technology
- RFID
- NFC
- Sensing Labels
- Time-Temperature Indicators
- Photonic/Oxygen-Reactive Labels
- By End-User Industry
- Food and Beverage
- Pharmaceutical
- Logistics and Supply-Chain
- Cosmetics and Personal Care
- Other End-User Industries
- By Packaging Format
- Flexible Pouches
- Rigid Bottles/Jars
- Cartons and Boxes
- Other Packaging Format
- By Freshness Indicator Mechanism
- Colorimetric Chemical Indicators
- Biosensor-Based Indicators
- Gas-Sensing Indicators
- Hybrid Multi-Parameter Indicators
- By Geography
- North America
- United States
- Canada
- Mexico
- Europe
- United Kingdom
- Germany
- France
- Italy
- Rest of Europe
- Asia-Pacific
- China
- Japan
- India
- South Korea
- Rest of Asia
- Middle East
- Israel
- Saudi Arabia
- United Arab Emirates
- Turkey
- Rest of Middle East
- Africa
- South Africa
- Egypt
- Rest of Africa
- South America
- Brazil
- Argentina
- Rest of South America
- North America
Data Sources, Market Sizing, and Validation
Desk Research
Desk research is used to map the addressable demand pool for freshness monitoring and to set realistic input ranges before we model revenues. We rely on public references such as food loss and cold-chain statistics from the USDA, the US FDA, the European Commission, and FAO, and then we align that with packaging and labeling context from GS1 and relevant trade associations.
To keep the model usable by year and region, we also review company annual reports, investor presentations, press releases, and credible media coverage around intelligent packaging rollouts. Where needed, we use paid subscriptions for company financials and intelligence, patent databases, and shipment-level import and export data to cross-check production footprints, patenting intensity, and trade flows linked to smart label materials and components. These named sources are illustrative only, and other references were also used for data collection, validation, and clarification.
Primary Interviews and Surveys
Primary work is used to confirm what gets adopted in the field and what remains limited to pilots, because that can shift the spend curve for spoilage indicators. We speak with label converters, materials and sensor solution providers, packaging buyers, and logistics stakeholders across APAC, EMEA, and the Americas to confirm price bands, typical order sizes, and which freshness mechanisms are specified for each use case.
Distribution of primary research fieldwork respondents
| Company type | Respondent position | Region |
|---|---|---|
| Top tier: 39% | CXOs: 12% | APAC: 42% |
| Mid tier: 42% | Functional/Unit leaders: 39% | EMEA: 36% |
| Smaller Players: 19% | Managers: 49% | Americas: 22% |
Market-Sizing & Forecasting
Sizing starts with a top-down build where food, pharma, and cold-chain activity indicators are translated into a realistic pool of shipments and packs that can justify a freshness or spoilage signal. We then reconstruct spend using adoption rates and average label value. To keep inputs grounded, we track variables such as cold-chain expansion pace, regulatory and retailer push on date labeling and traceability, penetration of time-temperature and gas-sensing formats, average labels used per pack, and how unit pricing moves as volumes scale.
The totals are corroborated with selective bottom-up approximations, using sampled supplier and converter revenue disclosures, channel checks on typical program volumes, and ASP times volume math for common label formats. If parts of the chain do not disclose enough detail, we handle the gap through ranges anchored to packaging format mix, and we validate the range boundaries using the price bands collected during interviews.
Forecasting is run using scenario analysis supported by expert consensus. Adoption depends on program rollouts, cost targets, and shelf-life pain points that can vary by region and category, so we model those sensitivities and keep year-to-year steps tied to the same variables for traceability on client calls.
Data Validation & Update Cycle
Outputs are checked against independent signals, such as intelligent packaging activity levels, cold-chain growth indicators, and the rate of commercial rollouts mentioned in public disclosures. When a variance is too large, we review the assumptions behind adoption, price bands, and packaging mix, and we revisit the relevant interview themes before sign-off.
We apply a multi-step internal review so the final numbers stay consistent across segments, regions, and the total market. Reports are refreshed annually, and interim updates are triggered when there are material events such as major regulatory changes, large-scale retailer mandates, or step changes in component pricing. Before delivery, an analyst performs a fresh validation pass so the client receives the most current view available at that time.
Mordor Intelligence's Spoil Detection Based Smart Labels Market Size Compared With Other Published Estimates
It is normal to see different market sizes for spoilage-detection smart labels, even when the topic name looks the same, because the counted products, year references, and pricing logic can differ across publishers. Most of the spread comes from how each firm defines a spoilage indicator, how adoption is assumed to move from pilots to scaled programs, and how pricing is carried forward over the forecast window.
Some published figures bundle broader smart labeling activity. They can also treat tracking technologies as equivalent to freshness indication, which inflates the demand pool. For Mordor Intelligence, revenue is counted only when the label or tag is used for freshness or spoilage signaling across the stated end uses and packaging formats, and the starting year is aligned to the study base to avoid mixing year definitions.
Benchmark comparison
| Source | Market Size | Gaps in Research Methodology |
|---|---|---|
| Mordor Intelligence | USD 1.23 B (2026) | |
| Industry Publisher A | USD 3.40 B (2025) | Uses an earlier base year and a broader product-type framing that can pull in adjacent smart labeling and application scopes, and the longer horizon can also embed more aggressive adoption assumptions. |
| Research Portal B | USD 1.45 B (2024) | References a different base year and a shorter forecast window, and the scope description is less explicit on packaging formats and freshness-indicator mechanisms, which can lead to inconsistent inclusion across technologies. |
Taken together, the table shows that year selection and what gets counted as a true spoilage indicator explain most of the differences. Our approach keeps the totals tied to clear adoption and pricing drivers, and the same logic is applied consistently across regions and end uses so the number can be replicated and updated with new inputs.


Key Questions Answered in the Report
How large is the spoil detection based smart label market in 2026?
The spoil detection based smart label market size reached USD 1.23 billion in 2026.
What is the forecast CAGR for spoil-detection smart labels through 2031?
Market value is projected to rise at an 10.92% CAGR between 2026 and 2031.
Which technology segment is growing fastest?
NFC labels are forecast to expand at 11.62% CAGR, topping all other technologies.
Why is Asia-Pacific the fastest-growing region?
Government cold-chain mandates, rapid retail modernization, and strong consumer safety demand lift Asia-Pacific to a 12.01% CAGR.
What major factor restrains adoption?
Smart labels cost five to ten times more than printed date codes, limiting uptake in price-sensitive markets.
How are retailers influencing adoption?
Walmart’s 2025 requirement for RFID on fresh foods forces suppliers to deploy smart labels, shifting adoption from voluntary to mandatory.
Page last updated on:


 Your data is secure and never sold or shared.


