
Spinal Muscular Atrophy Treatment Market Size and Share
Market Overview
| Study Period | 2020 - 2031 |
|---|---|
| Market Size (2026) | USD 6.06 Billion |
| Market Size (2031) | USD 13.48 Billion |
| Growth Rate (2026 - 2031) | 17.33 % |
| Fastest Growing Market | Asia Pacific |
| Largest Market | North America |
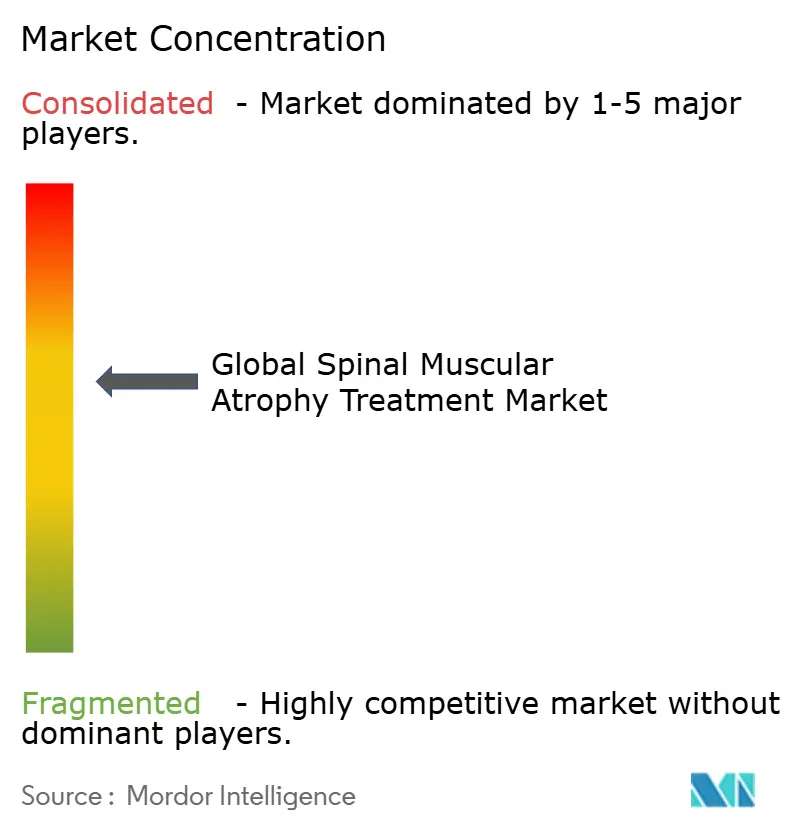
| Market Concentration | Medium |
Major Players *Disclaimer: Major Players sorted in no particular order Image © Mordor Intelligence. Reuse requires attribution under CC BY 4.0. | |
Spinal Muscular Atrophy Treatment Market Analysis by Mordor Intelligence
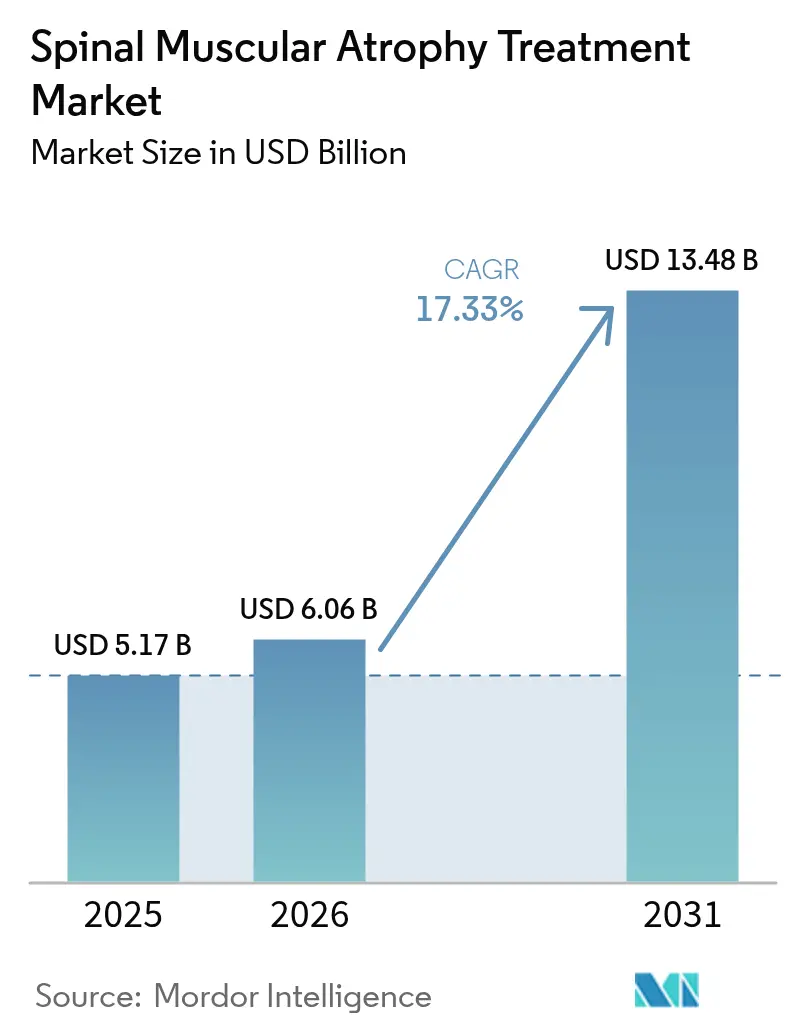
spinal muscular atrophy treatment market size in 2026 is estimated at USD 6.06 billion, growing from 2025 value of USD 5.17 billion with 2031 projections showing USD 13.48 billion, growing at 17.33% CAGR over 2026-2031. A mature newborn-screening infrastructure, rapid uptake of gene therapies, and supportive reimbursement policies combine to create the highest growth trajectory ever recorded for this rare-disease space. Early diagnostic confirmation drives presymptomatic treatment starts, while multiple SMN-targeting mechanisms expand clinical choice, reduce unmet need, and lift the overall spending ceiling. Pharmaceutical revenues further benefit from precision dosing strategies, combination-regimen trials, and steady geographic rollouts that add new payer budgets every year. At the same time, high-value outcomes data, particularly five-year survival gains, sustain premium prices even as additional entrants reach the market. Collectively these factors ensure the spinal muscular atrophy treatment market continues to outpace broader neurological drug segments through 2030.
Key Report Takeaways
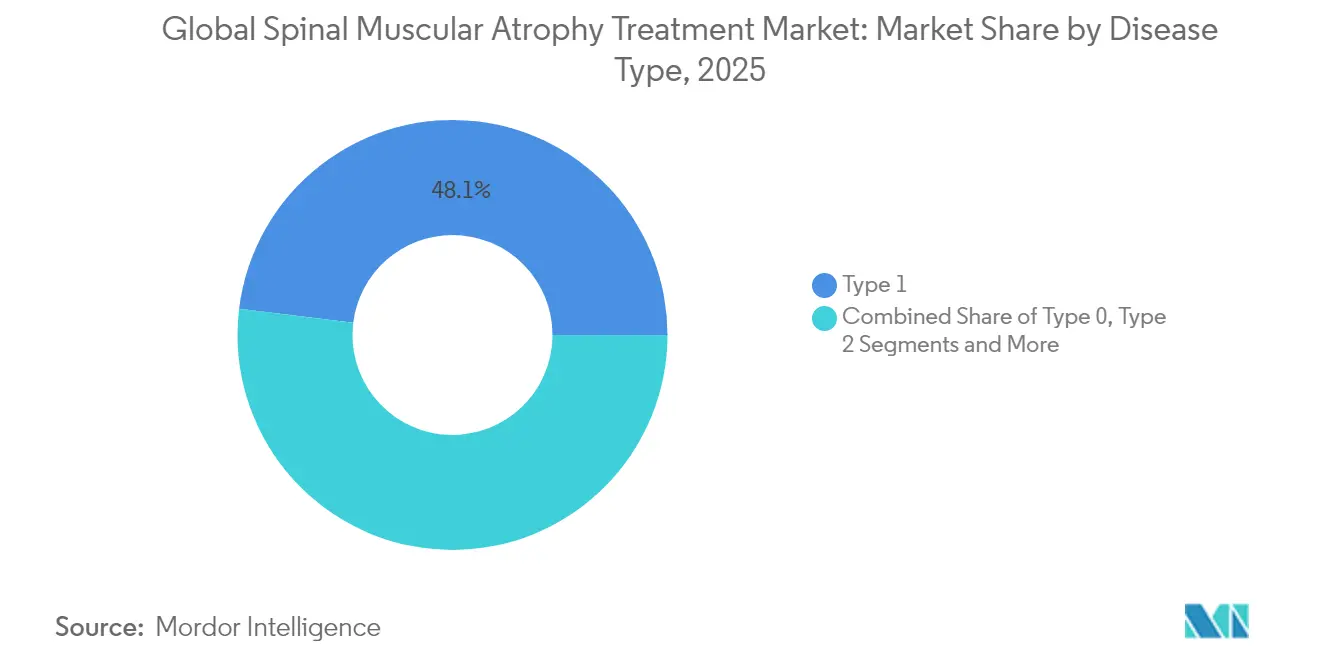
- By disease type, Type 1 SMA held 48.05% of the spinal muscular atrophy treatment market share in 2025; Type 0 is projected to expand at an 18.02% CAGR to 2031.
- By treatment modality, SMN2 splicing modifiers led with 42.35% revenue share in 2025; gene replacement therapy is on track for an 18.41% CAGR through 2031.
- By route of administration, intrathecal therapies accounted for 51.05% share of the spinal muscular atrophy treatment market size in 2025, while oral regimens advance at an 18.22% CAGR to 2031.
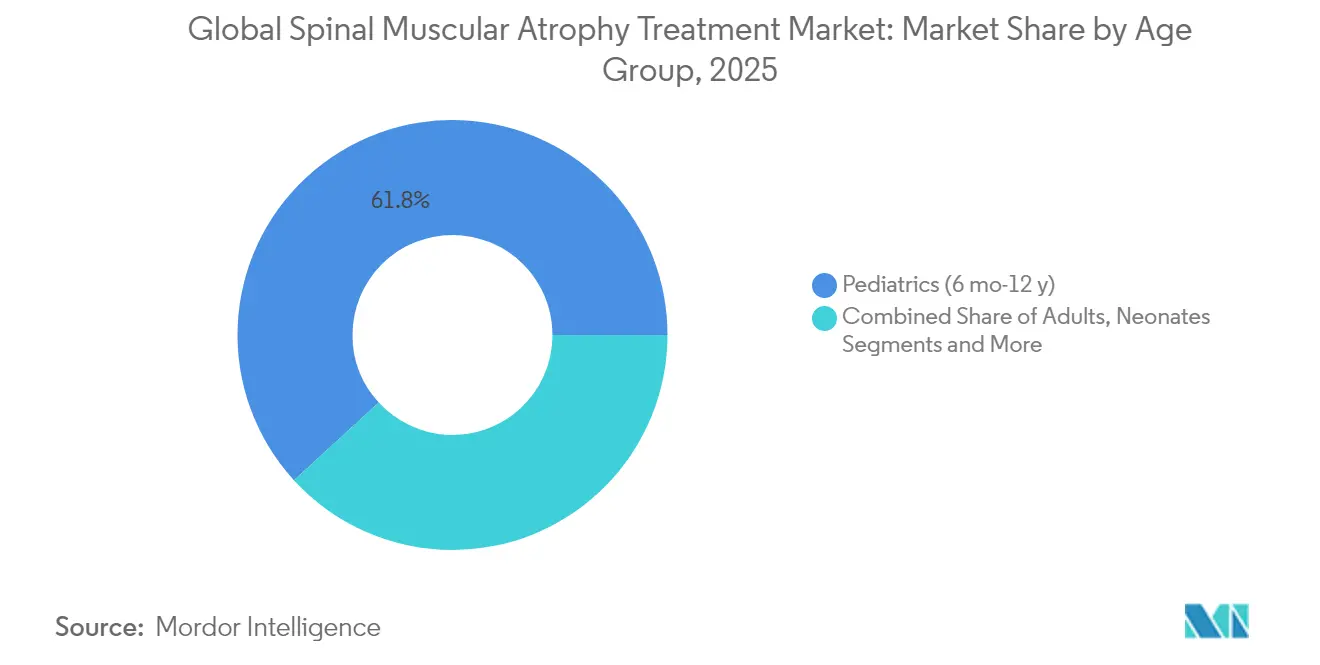
- By age group, pediatric patients captured 61.80% of the spinal muscular atrophy treatment market size in 2025; neonates record the fastest 18.05% growth through 2031.
- By distribution channel, hospital pharmacies controlled 46.85% revenue in 2025; online and retail outlets grow at 18.92% CAGR into 2031.
- By geography, North America dominated with 42.30% share in 2025, while Asia-Pacific is forecast to rise at a 18.96% CAGR through 2031.
Note: Market size and forecast figures in this report are generated using Mordor Intelligence’s proprietary estimation framework, updated with the latest available data and insights as of 2026.
Market Trends and Insights
Drivers Impact Analysis of Spinal Muscular Atrophy Treatment Market*
| Driver | (~) % Impact on CAGR Forecast | Geographic Relevance | Impact Timeline |
|---|---|---|---|
| Newborn Screening Mandates Expand Treatable Patient Pool | +3.2% | Global, with early gains in North America, Europe, Asia-Pacific | Short term (≤ 2 years) |
| Rapid Uptake Of SMN-Targeting Gene Therapies In High-Income Markets | +4.1% | North America & EU, spillover to APAC core markets | Medium term (2-4 years) |
| Global Payer Acceptance Of High-Value Rare-Disease Drugs | +2.8% | Global, concentrated in developed markets | Medium term (2-4 years) |
| Rising Advocacy-Group Funding For Early-Stage Trials | +1.9% | Global, with concentration in North America and Europe | Long term (≥ 4 years) |
| Pipeline Combination Regimens Targeting SMN & Myostatin | +3.5% | Global, initial deployment in high-income markets | Long term (≥ 4 years) |
| Home-Based Digital Adherence Platforms Boost Chronic Dosing | +1.8% | Developed markets initially, expanding to emerging economies | Medium term (2-4 years) |
| Source: Mordor Intelligence | |||
Newborn Screening Mandates Expand Treatable Patient Pool
Nationwide screening now active across all US states since January 2024 identifies SMA at a presymptomatic stage, enabling optimal timing for high-impact therapies. Taiwan, Hungary, and Serbia followed similar rollouts and collectively screened more than 650,000 infants, highlighting scalability across varied health systems [1]. Screening detects roughly 1 in 14,694 newborns, generating a predictable annual cohort that sustains therapy demand. Early detection translates into markedly improved motor outcomes, reinforcing payer willingness to reimburse expensive treatments. The practice also supplies essential epidemiological data that refine capacity planning for infusion centers and specialty pharmacies.
Rapid Uptake of SMN-Targeting Gene Therapies in High-Income Markets
SMN-targeting therapeutics now span antisense oligonucleotides, gene replacement vectors, and small-molecule splicing modifiers, offering clinicians multiple paths to restore SMN protein levels. Nusinersen dose-escalation showed a 94% reduction in plasma neurofilament light chain, supporting the clinical rationale for higher loading doses. Roche’s February 2025 tablet approval further lowers treatment burden without compromising exposure. Novartis achieved a 2.39-point HFMSE gain in older children using intrathecal onasemnogene abeparvovec, broadening gene-therapy eligibility. Together, these advances shorten the adoption curve and amplify the revenue base of the spinal muscular atrophy treatment market.
Global Payer Acceptance of High-Value Rare-Disease Drugs
Cost-effectiveness ratios for nusinersen often exceed USD 210,000 per QALY, yet nationwide SMA coverage persists across most US and major EU payers because early intervention averts lifelong ventilatory and orthopedic costs. Orphan-drug incentives, real-world evidence, and outcome-based contracts continue to reinforce reimbursability. The European SMA access tracker confirms an upward trend in favourable reimbursement decisions each year. Payer endorsement translates into steady revenue visibility and underpins multi-year investment in next-generation assets.
Rising Advocacy-Group Funding for Early-Stage Trials
Non-profit organisations such as Cure SMA, Muscular Dystrophy UK, and SMA Foundation direct grants toward exploratory approaches, including RNA editing and neuro-protective small molecules. Their involvement accelerates proof-of-concept phases, de-risks technology platforms, and attracts venture capital follow-on funding. Resulting trial networks shorten enrolment timelines, widen geographic reach, and maintain the innovation pipeline that sustains growth momentum for the spinal muscular atrophy treatment market.
Restraints Impact Analysis of Spinal Muscular Atrophy Treatment Market*
| Restraint | (~) % Impact on CAGR Forecast | Geographic Relevance | Impact Timeline |
|---|---|---|---|
| Million-dollar price tags and uncertain long-term reimbursement | -2.9% | Global; strongest in emerging markets | Medium term (2-4 years) |
| Intrathecal delivery complexities and capacity constraints at infusion centers | -1.8% | Global; acute where specialist density is low | Short term (≤ 2 years) |
| Shortage of pediatric neuromuscular specialists in emerging economies | -2.1% | Latin America, South Asia, Africa | Long term (≥ 4 years) |
| Viral-vector manufacturing bottlenecks for AAV supplies | -1.6% | Global; impacts gene-therapy rollouts | Medium term (2-4 years) |
| Source: Mordor Intelligence | |||
Million-Dollar Price Tags and Uncertain Long-Term Reimbursement
Zolgensma’s multi-million-dollar cost and a lifetime efficacy horizon strain payer budgets, especially in middle-income countries. Incremental cost-effectiveness ratios remain above traditional thresholds, prompting risk-sharing arrangements that delay uptake. Where coverage is approved, reimbursement often includes outcomes-based milestones, adding administrative complexity and revenue deferral for manufacturers. This drag limits penetration potential despite compelling clinical benefit.
Intrathecal Delivery Complexities and Capacity Constraints at Infusion Centers
Intrathecal dosing requires lumbar-puncture expertise and fluoroscopy equipment unavailable in many regional hospitals. Scheduling backlogs now reach several weeks at some US and EU centers, delaying therapy start within the critical presymptomatic window [2]. Pediatric spinal deformities increase procedural risk and lengthen appointment slots, further squeezing capacity. These bottlenecks cap the near-term growth pace of the spinal muscular atrophy treatment market.
*Our forecasts treat driver/restraint impacts as directional, not additive. The impact forecasts reflect baseline growth, mix effects, and variable interactions.
Spinal Muscular Atrophy Treatment Market Segment Analysis
By Disease Type:
Type 1 Severity Drives Market ConcentrationType 1 SMA retained 48.05% share of the spinal muscular atrophy treatment market in 2025. Its life-threatening nature prompts immediate therapy initiation and supports premium pricing. Universal newborn screening has shifted diagnoses into the presymptomatic stage, improving ventilatory-free survival and reinforcing clinical consensus for early gene therapy use. Type 0, historically excluded from trials, now logs an 18.02% CAGR as regulatory guidance broadens eligibility criteria and compassionate-use precedents confirm safety. Types 2 and 3 generate steady, recurring revenue because lifelong maintenance dosing remains standard practice. Type 4 adult-onset cases remain a niche today but grow as awareness climbs.
Presymptomatic treatment markedly improves motor milestones for Type 1 patients, evidenced by Taiwanese screen-and-treat cohorts achieving independent sitting in 100% of gene-therapy recipients. Later-onset groups experience slower but durable gains, supporting chronic therapy continuation. Variations in disease severity influence modality choice: gene replacement is favored in Type 1, while SMN2 splicing modifiers and antisense oligonucleotides dominate Types 2-4 due to flexible dosing and straightforward logistics.

By Treatment Modality:
SMN2 Splicing Dominance Faces Gene-Therapy ChallengeSMN2 splicing modifiers commanded 42.35% of the spinal muscular atrophy treatment market share in 2025. Competitive advantages include pan-phenotype eligibility, oral or intrathecal options, and favorable safety records. Gene-replacement therapy shows the fastest 18.41% CAGR as manufacturing yields improve and intrathecal formulations remove weight caps for older children. Antisense oligonucleotides hold steady with dose-escalation protocols, boosting neurofilament clearance metrics.
Muscle-directed agents such as apitegromab promise synergistic benefits when layered onto SMN-restoring backbones. Supportive therapies—ventilation aids, nutritional support, orthopedics—still feature in multidisciplinary care but shrink in revenue share as disease-modifying agents delay or prevent complications. An emerging pipeline of RNA-editing tools could eventually converge with existing modalities, sustaining innovation depth for the spinal muscular atrophy treatment market.
By Route of Administration:
Intrathecal Infrastructure Enables Oral GrowthIntrathecal delivery held 51.05% share of the spinal muscular atrophy treatment market size in 2025. Long-standing lumbar-puncture protocols and infusion suites create entrenched practice patterns. However, oral risdiplam and the newly approved Evrysdi tablet grow at 18.22% CAGR thanks to at-home dosing convenience and comparable CNS exposure. Intravenous gene-therapy infusions remain important for infants under 13.5 kg but face expansion limits due to AAV manufacturing capacity.
Patient-centric flexibility now guides administration decisions. Families living far from infusion centers often prefer oral routes, whereas infants screened presymptomatically may receive single-dose gene therapy followed by periodic laboratory monitoring. Intrathecal capacity investments—additional fluoroscopy suites, nurse-practitioner training—continue, yet they also raise fixed costs that hospitals aim to amortize through high treatment throughput, further anchoring intrathecal share even as oral uptake accelerates.
By Age Group:
Pediatric Concentration Reflects Early-Intervention FocusThe pediatric cohort aged 6 months to 12 years captured 61.80% of the spinal muscular atrophy treatment market size in 2025. Neurologists prefer aggressive therapy before irreversible motor-unit loss, making this segment the primary revenue engine. Neonatal prescriptions rise 18.05% annually, fueled by presymptomatic screen-and-treat programs. Adolescents and adults account for a smaller but rising share as diagnostic algorithms catch late-onset cases, and payers recognize quality-of-life gains even in established disability.
Early-treated infants now reach normative developmental percentiles, forcing regulators to revise functional endpoints that once relied on motor-score increments. Adult-onset SMA brings separate needs: managing fatigue, scoliosis, and metabolic demands. Tailored dosing and rehabilitation adjuncts expand total addressable spend per patient, maintaining growth momentum for the sspinal muscular atrophy treatment market.
By Distribution Channel:
Hospital Pharmacies Anchor Specialist Care NetworksHospital pharmacies dispensed 46.85% of therapies in 2025. Complex logistics—cold chain, inventory of gene-therapy vectors, emergency response readiness—justify their central role. Specialty clinics coordinate dosing schedules, collect real-world data, and interface with payers on outcomes-based contracts. Online and retail pharmacies grow at 18.92% CAGR, powered by direct-to-home delivery of oral formulations and remote adherence monitoring tools.
Hybrid hub models now link hospital-based infusion services with community pharmacists who oversee refill timeliness, nutritional consults, and telemedicine check-ins. Such integration reduces caregiver burden and supports lifelong adherence, thereby protecting pharmacotherapy revenue streams within the spinal muscular atrophy treatment market.
Geography Analysis
North America and Europe Spinal Muscular Atrophy Treatment Market
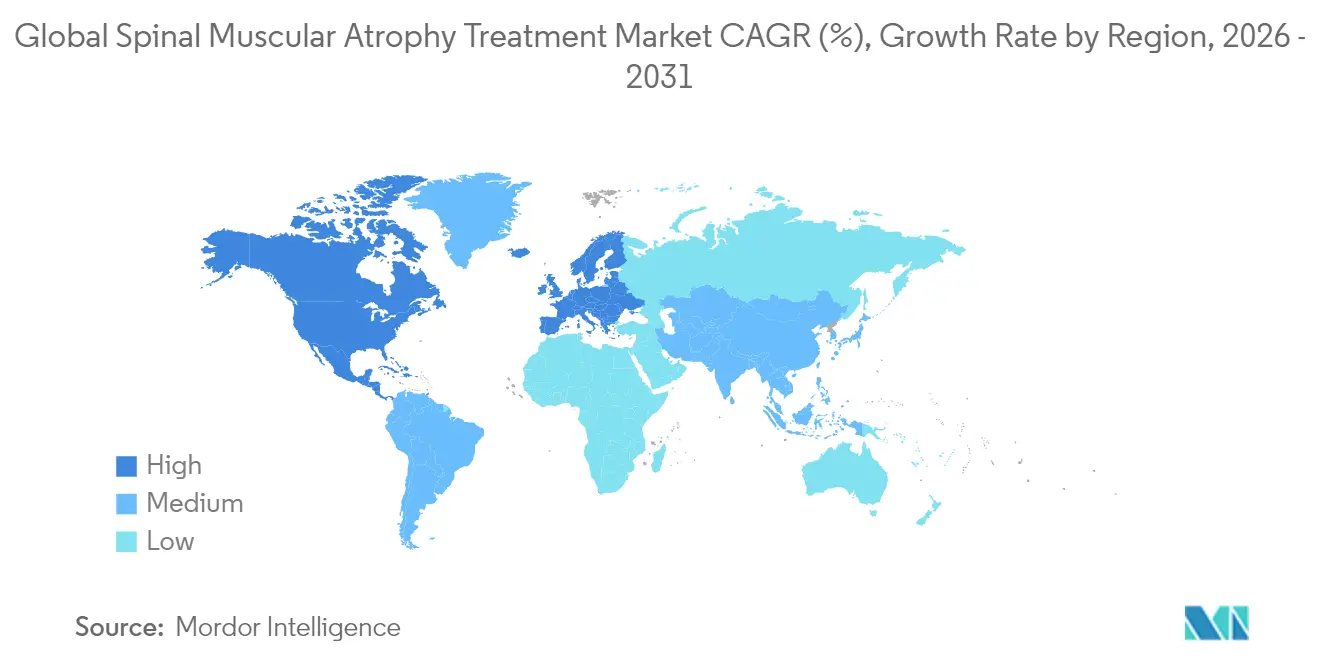
North America retained 42.30% of global revenue in 2025, underpinned by exhaustive newborn screening coverage, dense neuromuscular-specialist networks, and mature payer mechanisms that accommodate six- to seven-figure price tags. The US CMS infant-screening mandate guarantees near-universal early detection, while private insurers and Medicaid programs negotiate milestone-based contracts that secure wide access. Canada’s single-payer system funds risdiplam and nusinersen nationwide, yet gene-therapy reimbursement remains provincial in scope, leading to cross-border treatment outflow from western provinces to US centers. Europe shows steady incremental gains as EMA centralized approvals streamline label harmonization, but individual country negotiators stagger market entry times. Germany and France implement compulsory sickness-fund coverage for all approved SMA therapies, preserving high uptake. Conversely, Italy and Spain apply age or weight caps to gene-therapy funding, directing older children toward splicing modifiers instead. Eastern Europe accelerates newborn-screening adoption, with Serbia screening 54,000 infants within twelve months of program launch .
APAC Spinal Muscular Atrophy Treatment Market
Asia-Pacific records the fastest 18.96% CAGR through 2031 thanks to rising health-insurance penetration, expanding molecular-diagnostics capacity, and government rare-disease lists that waive import tariffs. Japan leads on per-capita spend, screening every newborn since 2023 and funding all three SMN-targeted classes. China approved nusinersen in 2024 and included it in the NRDL formulary at a negotiated discount that accelerates provincial uptake. India’s Union Health Ministry pilots state-funded screening in Kerala and Maharashtra, laying groundwork for broader scale. Australia and South Korea complete the region’s high-income cluster, leveraging robust genomic labs and telehealth to reach rural patients. Collectively, these expansions add tens of thousands of eligible patients to the spinal muscular atrophy treatment market each year.
Regulatory Landscape
Regulatory pathways for SMA therapies continue to evolve around orphan-drug incentives, lifecycle management, and real-world evidence. In March 2026, the US FDA approved Biogen's high-dose Spinraza regimen, supported by updated dosing data, indicating a more flexible approach to label updates within existing antisense oligonucleotide programs. Gene therapy regulation has also broadened across age groups: the US FDA approved Itvisma (onasemnogene abeparvovec-brve) in November 2025, and in July 2026 the European Commission approved Itvisma for people aged two years and older, after an EMA CHMP positive opinion in April 2026.
On the access side, NHS England managed access arrangements (NICE TA588 variation) and Australia's PBS processes continue to operate as payer-linked controls for high-cost orphan therapies while maintaining national coverage mechanisms.
Value Chain Analysis
The SMA treatment value chain begins with genetic testing and newborn screening to identify eligible patients, followed by specialist confirmation and treatment selection across Spinraza, Evrysdi, and Itvisma. Administration and delivery depend on site capabilities: intrathecal therapies require lumbar-puncture capacity at infusion centers, while oral regimens are supported by specialty distributors, online channels, and retail pharmacies, alongside adherence services. Manufacturing and distribution remain the most differentiated links, with gene therapies depending on qualified networks and buy-and-bill pathways.
Competitive Landscape
The spinal muscular atrophy treatment market remains top-heavy, with Biogen, Novartis, and Roche together controlling well above two-thirds of global revenue. Each firm occupies a distinct mechanism niche—antisense, gene therapy, and oral splicing modulation—minimizing direct substitution and allowing parallel prescribing in many treatment algorithms. Defensive strategies include lifecycle management (higher-dose nusinersen, intrathecal gene vectors) and geographic expansion into emerging regions where reimbursement is still evolving.
Pipeline disruptors target complementary biology rather than head-on competition. Scholar Rock’s apitegromab, an anti-myostatin antibody, delivered 30.4% responder rates on top of background SMN therapy, positioning it as the first add-on muscle-build option. Roche started a Phase II/III combo study pairing risdiplam with RO7204239, aiming to quantify dual-pathway benefit. Manufacturing innovation also reshapes competitive moats: Novartis doubled AAV vector yield in 2025 by integrating suspension HEK293 systems, reducing per-dose cost, and mitigating supply constraints.
Strategic alliances expand global footprint. Biogen renewed its logistic partnership with UPS Healthcare to enhance cold-chain reliability into Latin America, while Roche licensed a Chinese CDMO to handle regional fill-finish and accelerate NRDL-linked supply timeline. M&A interest focuses on platform enrichment; myostatin and neuro-protective small-molecule startups report increased term-sheet activity. Overall, competition centers on combination versatility, supply security, and payer-linked patient-support infrastructure rather than price discounting, sustaining healthy margins across the spinal muscular atrophy treatment market.
Spinal Muscular Atrophy Treatment Industry Leaders
-
Biogen
-
F. Hoffmann - La Roche Ltd
-
Cytokinetics, Inc.,
-
Novartis AG
-
Catalyst Pharmaceutical
- *Disclaimer: Major Players sorted in no particular order
Spinal Muscular Atrophy Treatment Market Companies Covered in this Report
- Biogen
- Roche Holding AG (Genentech)
- Novartis
- Ionis Pharmaceuticals
- PTC Therapeutics
- Scholar Rock Inc.
- Cytokinetics
- Sarepta Therapeutics
- NMD Pharma A/S
- Astellas Pharma
- Pfizer
- Chugai Pharmaceutical
- Sanofi S.A. (Genzyme)
- Catalyst Pharmaceuticals
- Regenxbio Inc.
- Biohaven Pharmaceutical Holding Co.
- Audentes Therapeutics (Astellas Gene Therapies)
- BridgeBio Pharma Inc.
- Shionogi & Co., Ltd.
Read Analysis of Spinal Muscular Atrophy Treatment Companies
Market Opportunities and Future Outlook
The main opportunity is expanding the treatable population while improving functional outcomes beyond the classic infant window, as care increasingly shifts toward chronic optimization and personalized regimens. Regulatory actions in 2025-2026 create identifiable whitespace: Itvisma secured US approval in November 2025 and EU approval in July 2026 for patients aged two years and older, widening the addressable pool for gene replacement beyond infant constraints. Biogen's March 2026 approval of a high-dose Spinraza regimen provides an additional lever for clinics and payers that already manage nusinersen pathways, reinforcing expanded functional targets and biomarker-driven care.
Recent Industry Developments in Spinal Muscular Atrophy Treatment Market
- June 2026: Biogen announced that the US FDA granted Breakthrough Therapy Designation to salanersen, an investigational antisense oligonucleotide for spinal muscular atrophy. The designation is intended to accelerate development and regulatory interactions, expanding Biogen's SMA portfolio beyond nusinersen.
- April 2026: Novartis finalized plans for a new Morrisville, North Carolina facility for API manufacturing tied to RNA therapeutics and solid dosage forms within a broader US investment program. The project strengthens domestic supply resilience and supports scale-up of RNA-based SMA components.
- February 2025: Roche (Genentech) secured US FDA approval for Evrysdi (risdiplam) 5 mg tablets for people aged two years and older with spinal muscular atrophy. The solid oral dosage form reduces handling and administration friction versus liquid dosing, reinforcing at-home therapy models and retail or specialty dispensing pathways.
Spinal Muscular Atrophy Treatment Market Report Scope and Research Methodology
Market Definition and Coverage
This market covers the revenues generated from treating spinal muscular atrophy (SMA) using disease-modifying therapies and related drug and gene replacement treatment procedures that are prescribed and administered to SMA patients across healthcare settings.
Scope exclusions: Supportive devices and non-therapy services (such as ventilation equipment purchases, wheelchairs, and long-term rehabilitation programs) are not counted as market revenue.
Segments Covered in This Report
- By Disease Type
- Type 0
- Type 1
- Type 2
- Type 3
- Type 4
- By Treatment Modality
- Gene Replacement Therapy
- SMN2 Splicing Modifiers
- Antisense-Oligonucleotide Therapy
- Muscle-Directed / Myostatin Inhibitors
- Supportive & Assistive Therapies
- By Route of Administration
- Oral
- Intrathecal
- Intravenous
- By Age Group
- Neonates (0–6 mo)
- Pediatrics (6 mo–12 y)
- Adolescents (12–18 y)
- Adults (>18 y)
- By Distribution Channel
- Hospital Pharmacies
- Specialty Clinics
- Online & Retail Pharmacies
- By Geography
- North America
- United States
- Canada
- Mexico
- Europe
- Germany
- United Kingdom
- France
- Italy
- Spain
- Rest of Europe
- Asia-Pacific
- China
- Japan
- India
- Australia
- South Korea
- Rest of Asia-Pacific
- Middle East & Africa
- GCC
- South Africa
- Rest of Middle East & Africa
- South America
- Brazil
- Argentina
- Rest of South America
- North America
Data Sources, Market Sizing, and Validation
Desk Research
Desk research starts with building a clean disease and treatment map so later assumptions do not drift. We reviewed public health and epidemiology references such as CDC newborn screening information, NIH and NLM resources, and peer reviewed studies indexed in PubMed to understand incidence, diagnosis age, and the patterns of patients who move into treatment.
To translate that clinical picture into an addressable demand pool, we also used payer and regulatory signals, including FDA labels and approvals, CMS coverage updates, and comparable national reimbursement guidance in major regions. For market context, we referenced company filings and investor presentations, audited annual reports where available, and reputable press releases for launch timelines and therapy access. Select paid subscriptions for company financials and patent databases were used to cross-check R&D direction and disclosed revenue cues. These sources are illustrative only, and many other public documents were also used for data collection, validation, and clarification.
Primary Interviews and Surveys
Primary work focused on validating what portion of diagnosed patients are actually treated each year, and how therapy choice changes by SMA type and the care pathway. We spoke with a mix of clinicians, hospital pharmacy and reimbursement stakeholders, patient group representatives, and industry roles across APAC, EMEA, and the Americas so we could check pricing logic, access delays, and switching behavior before finalizing assumptions.
Distribution of primary research fieldwork respondents
| Company type | Respondent position | Region |
|---|---|---|
| Top tier: 34% | CXOs: 19% | APAC: 46% |
| Mid tier: 47% | Functional/Unit leaders: 22% | EMEA: 36% |
| Smaller Players: 19% | Managers: 59% | Americas: 18% |
Market-Sizing & Forecasting
Our sizing model is built from a top-down treated cohort logic where incidence, diagnosis and screening rates, and therapy eligibility are used to reconstruct the annual pool of patients who can realistically receive SMA therapies in each region. Once that pool is defined, expected uptake is applied by procedure category and route of administration, and pricing is converted into annual revenue using consistent currency timing and treatment cadence assumptions.
To keep totals realistic, we corroborate outputs with selective bottom-up approximations. This included checking therapy revenue signals in public financial disclosures, sampling typical per patient annual cost ranges discussed in clinical and reimbursement contexts, and validating volume direction through channel checks with hospital and specialty stakeholders. Key inputs include newborn screening penetration, time to diagnosis, proportion of presymptomatic starts, switching and discontinuation behavior, and mix shifts between gene replacement therapy and drug therapy. Forecasts are generated using scenario analysis supported by expert views on access expansion and label changes, followed by trend smoothing when adoption curves show early saturation. Where local data is thin, we use proxy rates from similar healthcare systems and then adjust them after follow-up validation.
Data Validation & Update Cycle
Before numbers are finalized, model outputs are compared with independent signals such as approval timelines, screening rollout pace, and regional reimbursement coverage changes, and then large variances are investigated until the drivers are clear. We run multi-step checks for outliers, including sudden share jumps, unrealistic price drops, and patient volumes that do not match the epidemiology ranges.
A separate analyst review is completed before sign-off, and assumptions that materially move the forecast are re-tested through re-contact triggers with relevant respondents. The report is refreshed annually, and interim updates are made when major events occur, such as new label expansions, reimbursement decisions, or meaningful pricing actions. Right before delivery, a final pass is performed so clients receive the most current view available.
Mordor Intelligence's Spinal Muscular Atrophy Treatment Market Size Measured Against Other Published Estimates
Published market sizes for SMA treatment do not always match because firms make different choices on what is counted as treatment revenue, and how quickly uptake is assumed to move after approvals. Differences also show up when one estimate relies more on early launch pricing, while another assumes faster price normalization or quicker access in newer geographies.
In practice, the main gap drivers are scope and timing. Some estimates blend broader supportive care and adjacent neuromuscular services into the total, or they may carry a more aggressive assumption on presymptomatic treatment starts following newborn screening scale-up. Others use a base year anchored to earlier years and extrapolate with a uniform CAGR, which can miss step changes tied to reimbursement rollouts and shifts in route of administration.
Benchmark comparison
| Source | Market Size | Gaps in Research Methodology |
|---|---|---|
| Mordor Intelligence | USD 6.06 B (2026) | |
| Global Consultancy A | USD 4.40 B (2024) | Uses an earlier base year and a 2024 anchored demand pool, which can understate later-year uptake acceleration from newborn screening expansion and reimbursement broadening, especially outside North America. |
| Industry Publisher B | USD 4.32 B (2024) | Leans on a revenue base tied to 2024 and may apply broader segment rollups that mix channel and end user splits without fully rechecking treated cohort assumptions by SMA type and therapy procedure. |
The table indicates the spread is largely explained by base year choice and how quickly the treated cohort is allowed to expand with screening and access. By anchoring totals to 2026 treated patient logic and stress-testing uptake and price paths by procedure and route, the estimate stays closer to real-world treatment eligibility patterns, a modeling choice applied by Mordor Intelligence.
Key Questions Answered in the Report
What is the current Global Spinal Muscular Atrophy Treatment Market size?
The spinal muscular atrophy therapeutics market is projected to rise from USD 6.06 billion in 2026 to USD 13.48 billion by 2031, delivering a 17.33% CAGR over the period.
Who are the key players in Global Spinal Muscular Atrophy Treatment Market?
Biogen, F. Hoffmann - La Roche Ltd, Cytokinetics, Inc.,, Novartis AG and Catalyst Pharmaceutical are the major companies operating in the Global Spinal Muscular Atrophy Treatment Market.
Why does Asia-Pacific show the fastest growth?
Rising health-insurance coverage, expanding molecular-diagnostic capacity, and government incentives for rare-disease drugs drive a 18.96% CAGR for Asia-Pacific through 2031.
Which therapy class currently holds the largest revenue share?
SMN2 splicing modifiers led with 42.35% market share in 2025, supported by established safety profiles and applicability across all SMA types.