
Specialty Tapes Market Size and Share
Market Overview
| Study Period | 2020 - 2031 |
|---|---|
| Market Size (2026) | USD 52.69 Billion |
| Market Size (2031) | USD 71.63 Billion |
| Growth Rate (2026 - 2031) | 6.33 % |
| Fastest Growing Market | Asia Pacific |
| Largest Market | Asia Pacific |
| Market Concentration | Medium |
Major Players *Disclaimer: Major Players sorted in no particular order Image © Mordor Intelligence. Reuse requires attribution under CC BY 4.0. | |
Specialty Tapes Market Analysis by Mordor Intelligence
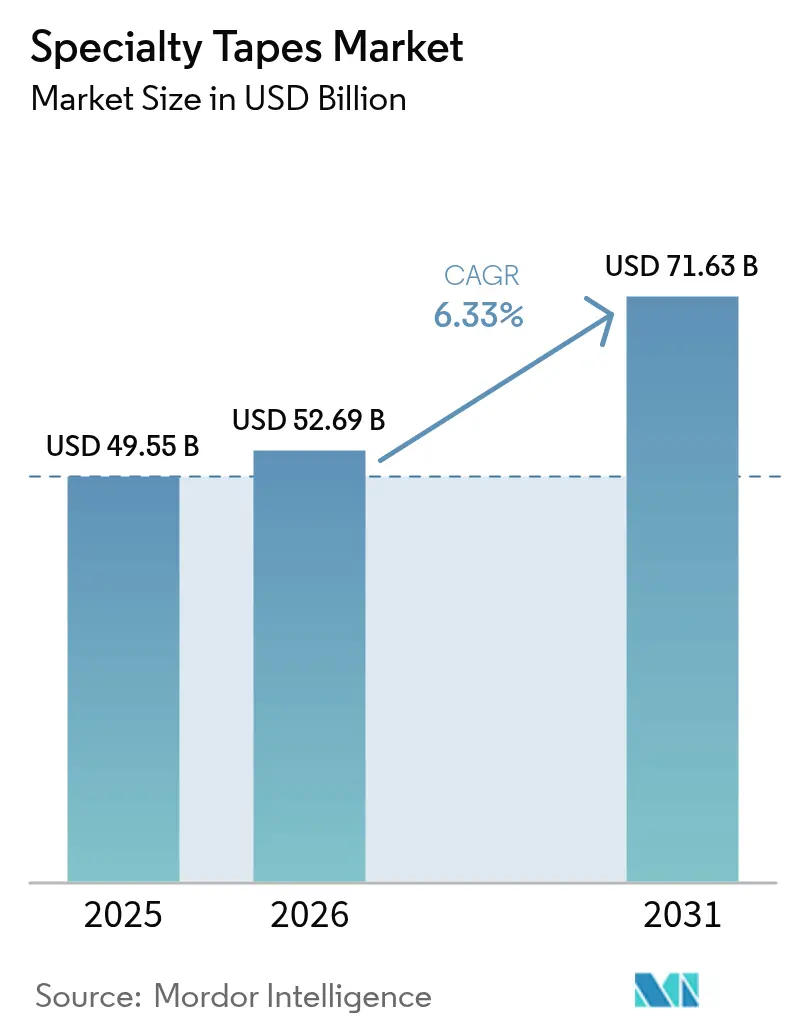
The Specialty Tapes Market size is expected to grow from USD 49.55 billion in 2025 to USD 52.69 billion in 2026 and is forecast to reach USD 71.63 billion by 2031 at 6.33% CAGR over 2026-2031. Strong demand from electronics, healthcare, and electric-vehicle manufacturing drives accelerated adoption of high-performance bonding, sealing, and protection solutions. Structural adhesive tapes continue to displace mechanical fasteners in weight-sensitive assemblies, while solvent-free chemistries support compliance with tightening emissions rules. Innovation in skin-friendly formulations for medical wearables and optically clear adhesives for foldable displays further increases product differentiation. Suppliers that combine vertical integration with sustainable material development capture rising orders as PFAS restrictions and VOC caps reshape customer specifications.
Key Report Takeaways
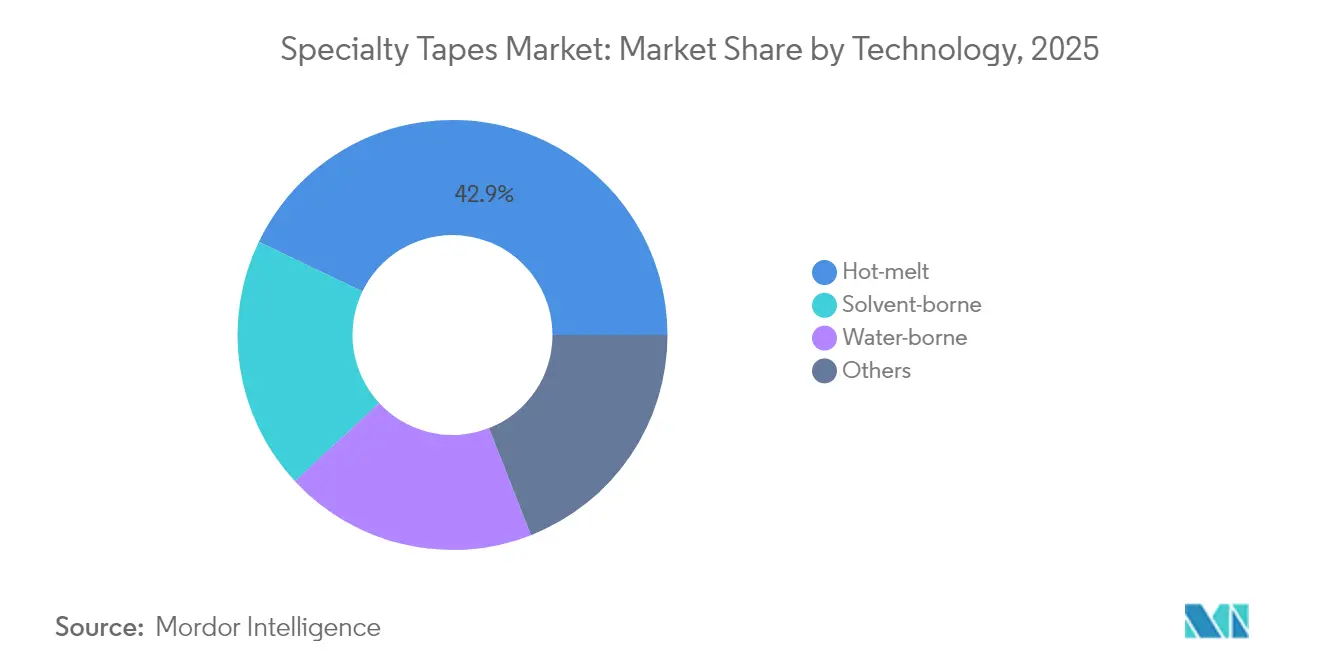
- By technology, hot-melt systems led with 42.85% of the specialty tapes market size in 2025 and are set to grow at a robust 6.98% CAGR.
- By adhesive resin, acrylics dominated with 46.75% revenue share in 2025; rubber-based formulations are poised for the highest 7.52% CAGR to 2031.
- By type, polyvinyl chloride accounted for 36.95% of specialty tapes market size in 2025, while woven/non-woven substrates will record the fastest 7.18% CAGR.
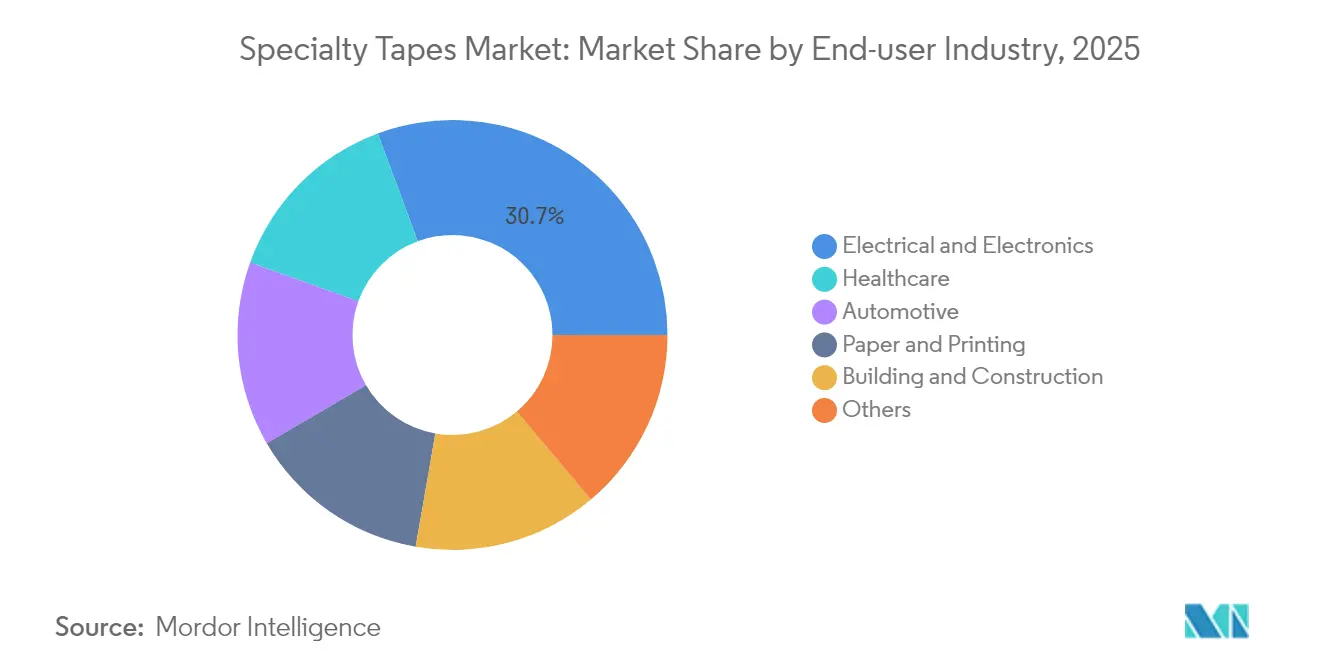
- By end-user industry, the electrical and electronics segment held 30.65% of specialty tapes market share in 2025, whereas healthcare is projected to expand at the fastest 7.35% CAGR through 2031.
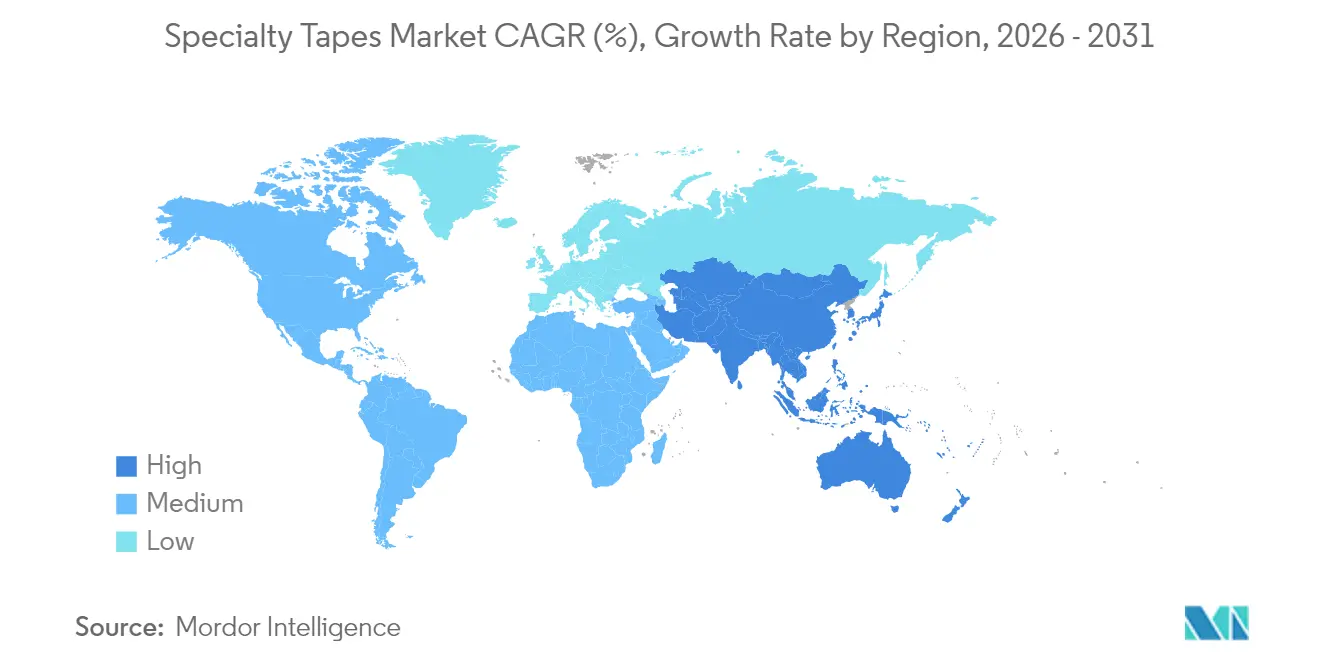
- By geography, Asia Pacific captured 40.85% of specialty tapes market share in 2025 and is forecast to record the strongest 7.76% CAGR.
Note: Market size and forecast figures in this report are generated using Mordor Intelligence’s proprietary estimation framework, updated with the latest available data and insights as of 2026.
Market Trends and Insights
Drivers Impact Analysis of Specialty Tapes Market*
| Drivers | % Impact on CAGR Forecast | Geographic Relevance | Impact Timeline |
|---|---|---|---|
| Expanding healthcare and wearable-device demand | +1.2% | Global, with concentration in North America and APAC | Medium term (2-4 years) |
| Growth in flexible electronics and EV battery packs | +1.0% | APAC core, spill-over to North America and Europe | Long term (≥ 4 years) |
| Construction boom in Asia Pacific green buildings | +0.8% | APAC core, emerging in MEA | Medium term (2-4 years) |
| Lightweighting trend in auto and rail interiors | +0.7% | Global, with early adoption in Europe and North America | Long term (≥ 4 years) |
| Emergence of thermal-management tapes for EV cells | +0.6% | Global, with concentration in China, Europe, North America | Long term (≥ 4 years) |
| Source: Mordor Intelligence | |||
Expanding Healthcare and Wearable-Device Demand
Medical wearables such as continuous glucose monitors, smart bandages, and cardiac patches increasingly rely on skin-compatible tapes that combine strong initial tack with atraumatic removal. Growing adoption of remote patient monitoring accelerates demand for breathable, moisture-managing adhesives, with Avery Dennison Medical emphasizing long-term comfort in extended-wear devices[1]. Optically clear constructions that maintain transparency under dynamic skin movement enable advanced biosensor integration, shifting formulation priorities toward biocompatibility and low-trauma removal.
Growth in Flexible Electronics and EV Battery Packs
Foldable smartphones, rollable televisions, and ultra-thin displays require optically clear tapes that endure thousands of bend cycles without haze formation while safeguarding internal circuitry. Thermal interface tapes in EV battery modules mitigate cell-to-cell heat transfer, improving pack safety during thermal runaway. LINTEC Corporation’s focus on semiconductor packaging tapes targets reflow-resistant, EMI-shielding solutions for advanced chip designs. Structural adhesive tapes now replace screws in battery pack assembly, trimming weight while boosting vibration resistance.
Construction Boom in Asia Pacific Green Buildings
LEED-oriented regulations spur adoption of low-VOC specialty tapes in curtain-wall and building-envelope systems[2]. tesa’s 2024 expansion in Mumbai and Bengaluru positions production close to India’s energy-efficient building market, including solar installations and modular construction. High-performance tapes enhance air- and water-sealing functions in prefabricated modules, supporting faster site assembly while maintaining weatherproofing integrity.
Lightweighting Trend in Auto and Rail Interiors
Automakers replace mechanical fasteners with pressure-sensitive tapes to reduce mass and improve noise, vibration, and harshness in EV cabins. Avery Dennison offers foam and fiber bonding adhesives that handle diverse substrates such as polyurethane foams and EPDM elastomers. Rail operators adopt tapes for panel attachment, leveraging stress-distribution and thermal-expansion benefits. Advanced adhesive lines allow reworkability during assembly while delivering enduring structural performance once vehicles enter service.
Restraints Impact Analysis of Specialty Tapes Market*
| Restraints | % Impact on CAGR Forecast | Geographic Relevance | Impact Timeline |
|---|---|---|---|
| Petrochemical feedstock price volatility | -0.9% | Global, with higher impact in regions dependent on imported feedstocks | Short term (≤ 2 years) |
| Tight VOC/solvent-emission regulations | -0.6% | North America and EU, expanding to APAC | Medium term (2-4 years) |
| PFAS-related litigation and reformulation costs | -0.4% | North America and EU primarily | Long term (≥ 4 years) |
| Source: Mordor Intelligence | |||
Petrochemical Feedstock Price Volatility
Acrylic and rubber resin costs rise sharply when crude-oil-derived monomer prices spike, compressing margins for manufacturers unable to pass increases downstream. Ethylene volatility feeds through to polyvinyl chloride backings. European chemical producers report sustained energy-cost pressure, further tightening supply. Vertical integration and long-term supply contracts remain key hedges against cost swings.
Tight VOC/Solvent-Emission Regulations
The US EPA banned methylene chloride in consumer adhesives in 2024, accelerating migration to water-based and hot-melt lines. Europe’s Chemicals Strategy for Sustainability employs generic risk assessment to restrict solvent systems across industries, prompting multimillion-dollar reformulation programs. Smaller suppliers without research and development scale face exit or acquisition as compliance timelines shorten.
*Our forecasts treat driver/restraint impacts as directional, not additive. The impact forecasts reflect baseline growth, mix effects, and variable interactions.
Specialty Tapes Market Segment Analysis
By Technology:
Hot-Melt Dominance ContinuesHot-melt systems contributed 42.85% of specialty tapes market size in 2025, and their 6.98% CAGR indicates enduring preference for solvent-free, fast-setting options suitable for high-speed automated lines. Water-borne variants gain traction where substrates cannot tolerate 150 °C application temperatures, particularly in sensitive medical diagnostics.
Sustainability targets spur adoption of bio-sourced hot-melt resins based on tall-oil fatty acids and sugar-derived polyols. Henkel and Packsize demonstrated a 32% greenhouse-gas reduction with corn-based formulations in 2025 packaging trials. Equipment vendors broaden nozzle technology to apply patterns that cut adhesive use by up to 25%, aligning with both cost-reduction and ESG goals.

By Adhesive Resin:
Acrylic Leadership ChallengedAcrylics commanded 46.75% specialty tapes market share in 2025 through balanced adhesion, UV stability, and cost profile. Specialty tapes market size for rubber-based formulations, however, is on track to expand 7.52% annually as OEMs seek flexibility under cold-temperature impact and rapid assembly adhesion. Silicone adhesives service high-temperature zones up to 260 °C, critical for electronics coupling and aerospace masking, yet their premium cost caps broader penetration. Hybrid chemistries that graft silicone blocks onto acrylic backbones emerge to balance temperature tolerance with price.
By Type:
Woven Solutions Gain TractionPolyvinyl chloride captured 36.95% specialty tapes market share in 2025, favored for chemical resistance, flame retardancy, and cost efficiency. Specialty tapes market size for woven and non-woven substrates, however, is forecast to expand at 7.18% CAGR, outpacing PVC as OEMs seek breathable, drapable materials for body-worn sensors and vehicle interior upholstery. Polyethylene terephthalate remains indispensable in flexible printed circuit board assembly owing to its dimensional stability under 260 °C reflow peaks. Paper and kraft backings serve masking, splicing, and easy-tear applications but face substitution risk where humidity exposure is high.
By End-User Industry:
Healthcare Drives InnovationThe healthcare vertical accounted is projected to grow at 7.35% CAGR through 2031. Electrical and electronics still represent the largest revenue pool at 30.65%, reflecting entrenched reliance on thermal interface and EMI-shielding tapes for semiconductor packaging. Rising adoption of remote patient monitoring accelerates demand for breathable, skin-friendly constructions, prompting material suppliers to prioritize low-trauma removal and moisture management. The specialty tapes market continues to penetrate automotive assemblies, where lightweighting initiatives align with electrification goals by replacing clips and screws with advanced adhesive lines. Structural bonding in packaging machinery, paper converting, and printing maintains a steady baseline, cushioning cyclical downturns in discretionary sectors.
Geography Analysis
APAC Specialty Tapes Market
Asia Pacific’s 40.85% specialty tapes market share in 2025 underscores the region’s integration across electronics, construction, and mobility supply chains India’s Smart Cities Mission finances green-building retrofits that favor low-VOC window tapes capable of sustaining −10 °C to +70 °C service temperatures. In Japan, automotive OEMs source double-sided acrylic foam tapes for pillar trim, cutting assembly time by 30% relative to clip-based methods.
The Americas and EMEA Specialty Tapes Market
North America capitalizes on medical-grade demand from 6,000 hospitals and a rapidly expanding at-home diagnostics sector. Europe benefits from regional automotive electrification mandates that raise thermal-management tape consumption. The Middle East and Africa posts mid-single-digit growth as megaprojects like NEOM integrate high-performance façade sealing systems. South America’s share is anchored by Brazil’s white-goods and flexible-packaging output; domestic suppliers invest in acrylic monomer plants to curb import dependence. Across emerging regions, government subsidies for solar farms and wind turbines enlarge demand for UV-stable adhesive films that endure 25-year outdoor exposure.
Regulatory Landscape
Specialty tape formulations are increasingly shaped by chemical-management rules that target both solvents and fluorinated chemistries. In the United States, the EPA TSCA Section 8(a)(7) PFAS reporting rule creates a documentation and reporting burden for any PFAS used since 2011, with the submission window open from April 13, 2026, to October 13, 2026. This is pushing manufacturers and converters to improve substance traceability across adhesives, backings, and process aids.
In Europe, the PFAS restriction process under REACH has advanced through socioeconomic analysis consultation, which closed on May 25, 2026. Reformulation programs are tightening alongside this review cycle, and customer specifications for electronics, automotive, and construction tapes are becoming more stringent. At the same time, standards activity continues to influence specialty adhesive use in construction-linked applications, including the publication of EN 15425:2023+A1:2026 (June 2026) for PUR adhesives in load-bearing timber, which supports demand for compliant, low-emission bonding and sealing systems in building envelopes and related assemblies.
Value Chain Analysis
The specialty tapes value chain runs from petrochemical and specialty raw materials (acrylic, rubber, and silicone resins; polymers; films; foams; paper; and release liners) through adhesive formulation, coating and lamination, slitting, and converting (die-cuts, roll formats, and engineered parts) to end users in electrical and electronics, healthcare, automotive, and building and construction. Coating technology choices (hot-melt, water-borne, solvent-borne) shape capital intensity and compliance requirements, while converters add application engineering that is critical for medical wearables, EV battery pack assembly, and semiconductor packaging.
Upstream exposure to energy and logistics disruption remains a constraint because many inputs are petrochemical-derived, and sourcing can tighten quickly when trade frictions or shipping disruptions affect specific grades. The chain is also moving toward tighter collaboration and integration across materials, converting, and application development. For example, QuadAlliance (tesa with ZEISS, Saint-Gobain Sekurit, and Hyundai Mobis) links tape and materials expertise to automotive display platforms, while manufacturing-side workflow partnerships such as Lohmann with BOBST and UPM Adhesive Materials with Mark Andy focus on process integration and faster qualification cycles for labeling and specialty tape programs.
Competitive Landscape
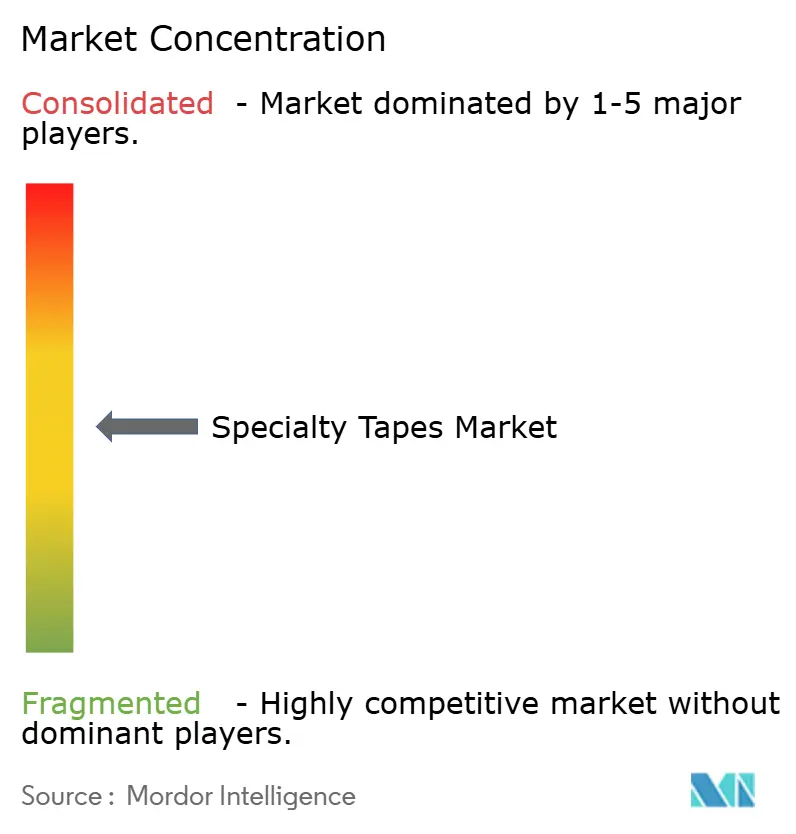
The market is moderately fragmented. Multinationals including 3M, Nitto Denko, and tesa steward broad portfolios spanning PVC electrical tapes to high-end optically clear and thermally conductive grades. Patent barriers remain significant. Regional specialists differentiate through converting agility and custom die-cutting services, especially for short-run medical and electronics programs where speed trumps scale.
Specialty Tapes Industry Leaders
-
3M
-
Avery Dennison Corporation
-
Nitto Denko Corporation
-
tesa SE
-
Intertape Polymer Group
- *Disclaimer: Major Players sorted in no particular order
Specialty Tapes Market Companies Covered in this Report
- 3M
- Adhesives Research Inc.
- Avery Dennison Corporation
- Coroplast Tape Corporation
- DuPont
- Gergonne Industrie
- Henkel AG & Co. KGaA
- Intertape Polymer Group
- Lintec Corporation
- Lohmann GmbH & Co. KG
- Nichiban Co. Ltd
- Nitto Denko Corporation
- Rogers Corporation
- Saint-Gobain
- Scapa Group plc
- Sekisui Chemical Co. Ltd
- Shurtape Technologies LLC
- Teraoka Seisakusho Co. Ltd
- tesa SE
- Vybond (Nautic Partners)
Market Opportunities and Future Outlook
Advanced electronics and semiconductor process needs are creating room for higher-performance specialty tapes, especially temporary bonding and handling solutions that tolerate reflow temperatures and support damage-free release. Sekisui Chemical has been advancing commercialization of SELFA UV-release temporary bonding tape for semiconductor back-end processes (with thermal resistance up to 260 C), and Lintec reported plans for roughly JPY 7 billion investment tied to EUV-related dust-proof film production in 2026. Together, these actions point to sustained focus on precision films and tapes used in high-end chip manufacturing and packaging.
Regional supply resilience and solvent-free processing are also creating practical pathways for new capacity and localized supply hubs that shorten lead times for automotive, industrial, and packaging customers. Avery Dennison Yongle Tape opened a manufacturing facility in Selangor, Malaysia (its first Yongle site outside China), and ATP Adhesives launched North American operations with a solvent-free adhesive tape plant in Columbia, South Carolina, as producers place assets closer to demand while aligning with VOC-related customer and regulatory requirements. In Europe, tesa expanded its Offenburg, Germany site with a 4,500-square-meter production building, reflecting continued investment in in-region manufacturing footprints for specialty tape grades.
Recent Industry Developments in Specialty Tapes Market
- July 2026: 3M launched the Scotch Kids Tape line for young creators. While positioned for consumer crafting, the launch reinforces 3M's brand-led tape portfolio strategy and supports channel visibility in a category where differentiation and shelf presence influence volume.
- January 2026: Henkel announced an agreement to acquire ATP Adhesive Systems, a specialist in high-performance water-based specialty tapes serving automotive, electronics, medical, and construction end markets. The deal strengthens Henkel's access to water-based tape technologies that align with tightening VOC and solvent-emission requirements and adds depth in specialty converting know-how.
- November 2024: Berry Global agreed to sell its Specialty Tapes business to Nautic Partners for USD 540 million, and the unit began operating as Vybond under Nautic ownership. The carve-out created a focused, independent platform in pressure-sensitive adhesive tapes and changed competitive dynamics for customers seeking agile supply and tailored product development.
Specialty Tapes Market Report Scope and Research Methodology
Market Definition and Coverage
For this study, the specialty tapes market is defined as revenue generated from engineered adhesive tapes that deliver specific performance needs, such as higher temperature resistance, electrical insulation, surface protection, bonding strength, or clean removability, across industrial and professional use.
Scope exclusions: This sizing does not include general-purpose commodity tapes sold mainly for routine household use where specialty performance is not the buying requirement.
Segments Covered in This Report
- By Technology
- Solvent-borne
- Water-borne
- Hot-melt
- Others
- By Adhesive Resin
- Acrylic
- Rubber
- Silicone
- Others (Cyanoacrylate, Epoxy, PU)
- By Type
- Woven / Non-woven
- Polyvinyl Chloride
- Polyethylene Terephthalate
- Paper
- Polypropylene
- Others
- By End-user Industry
- Healthcare
- Electrical and Electronics
- Automotive
- Paper and Printing
- Building and Construction
- Others
- By Geography
- Asia-Pacific
- China
- India
- Japan
- South Korea
- ASEAN
- Rest of Asia-Pacific
- North America
- United States
- Canada
- Mexico
- Europe
- Germany
- United Kingdom
- France
- Italy
- Spain
- Russia
- Rest of Europe
- South America
- Brazil
- Argentina
- Rest of South America
- Middle-East and Africa
- Saudi Arabia
- United Arab Emirates
- South Africa
- Rest of Middle-East and Africa
- Asia-Pacific
Data Sources, Market Sizing, and Validation
Desk Research
Desk work starts by mapping the demand and supply signals that explain tape consumption by application and by geography. We relied on public sources such as USITC trade statistics, UN Comtrade, the US Census Bureau manufacturing and shipment series, Eurostat structural business and trade data, and IEA electricity and industry indicators that help frame electronics and industrial output trends.
The desk phase is also where definitions get tightened using product and end-use descriptions from association pages and standards bodies, followed by cross-checking material and chemical context through sources such as OECD chemical information and peer-reviewed journals on adhesives and polymer backings. Company annual reports, investor decks, and reputable press were used to understand capacity moves and pricing commentary. For company financials, patent tracking, and shipment-level import and export checks, we also used relevant paid database subscriptions where they are available. These are illustrative examples, and many other sources were referenced to collect data, validate patterns, and clarify open questions.
Primary Interviews and Surveys
Primary work is used to pressure-test the desk assumptions that most affect value, especially the split between industrial uses and the smaller, more fragmented professional channels. We spoke with tape converters, raw material suppliers, and downstream buyers in electronics, automotive, building, and healthcare, and then we validated typical pricing ladders, substitution risk, and regional demand mix across APAC, EMEA, and the Americas.
Distribution of primary research fieldwork respondents
| Company type | Respondent position | Region |
|---|---|---|
| Top tier: 29% | CXOs: 14% | APAC: 42% |
| Mid tier: 52% | Functional/Unit leaders: 38% | EMEA: 35% |
| Smaller Players: 19% | Managers: 48% | Americas: 23% |
Market-Sizing & Forecasting
The core model is built using a top-down approach where manufacturing output and trade flows are reconstructed by tape-relevant material families, and then converted into an addressable demand pool using usage intensity by end-use industries. We then corroborate totals using selective bottom-up approximations, such as sampled average selling price bands multiplied by estimated volumes for priority tape formats, followed by channel checks with converters and distributors.
Key inputs used in the model include electronics and electrical production indices, automotive production volumes, construction activity indicators, healthcare consumption proxies, and adhesive resin and film or paper backing price direction (which influences mix and value growth). Where direct volume is not visible, gaps are handled through bounded assumptions that are anchored in import-export movements and validated in interviews, before totals are adjusted.
For forecasting, scenario analysis is applied around a base case, because tape demand depends on a few macro end markets that can swing by region. Growth paths for the main demand drivers are projected first, and then tape value is forecast by combining expected volume changes with a realistic price progression that reflects resin cycles and mix shift into higher-performance grades.
Data Validation & Update Cycle
Validation happens in layers, starting with cross-checks against independent signals like trade balances, manufacturing output trends, and end-use activity indicators. If the model shows a jump that is not supported by these signals, the assumption is reopened and the relevant primary inputs are re-contacted for clarification.
Before sign-off, the work goes through multiple analyst reviews that check arithmetic, units, currency conversions, and whether the scope boundary stayed consistent across years. Reports are refreshed annually, and interim updates are completed when material events occur, such as major capacity additions, sharp resin price changes, or policy shifts affecting trade. Right before delivery, the analyst runs a final update pass so the output reflects the latest available information.
Mordor Intelligence's Specialty Tapes Market Size Compared With Other Published Estimates
Published market values for specialty tapes do not always line up because the scope boundary is not identical across studies, and because price and mix assumptions are handled differently. Differences also show up when the base year changes, when currency conversion timing is not consistent, or when the underlying end-use demand signals are not checked against measurable activity.
Trade movements for tape-related backings and adhesive inputs, along with end-market production indices, are the evidence used to keep the Mordor Intelligence estimate aligned to a defined demand pool, which results in a 2026 size of USD 52.69 B rather than a figure anchored to a 2024 or 2025 base year. Some publishers also fold more adjacent adhesive products into the tape total, or apply a faster price escalation that is not supported by resin and backing price direction discussed by industry participants.
Benchmark comparison
| Source | Market Size | Gaps in Research Methodology |
|---|---|---|
| Mordor Intelligence | USD 52.69 B (2026) | |
| Global Consultancy A | USD 58.70 B (2024) | Uses a different base year and may capture a wider set of tape-like solutions under advanced materials, which can lift the starting value even before forecasting begins. |
| Industry Publisher B | USD 61.44 B (2025) | Relies on a later base year with a stronger price and mix uplift assumption, and the scope boundary can be broader across resin-led categories, which increases the counted revenue pool. |
The spread in the table mainly comes from base-year choice and what is counted as specialty tape versus adjacent adhesive products. By tying value build-up to observable end-market activity and then checking pricing and mix through interviews, the method stays traceable and repeatable, which helps users reconcile year-to-year movement with real demand signals.
Key Questions Answered in the Report
What is the current value of the specialty tapes market?
The specialty tapes market stands at USD 52.69 billion in 2026 and is on track to reach USD 71.63 billion by 2031.
Which end-user segment is growing the fastest?
Healthcare applications are expanding at a 7.35% CAGR, driven by wearables and advanced medical devices that require skin-friendly, breathable adhesives.
Why are hot-melt specialty tapes so dominant?
Hot-melt tapes combine solvent-free compliance with rapid processing, commanding 42.85% market share in 2025 and maintaining a 6.98% growth rate as VOC regulations tighten.
How significant is Asia Pacific in specialty tape consumption?
Asia Pacific captured 40.85% of global revenue in 2025 and is expected to post the strongest 7.76% CAGR through 2031 on the back of electronics and EV production.
What regulatory trends most affect specialty tapes producers?
Key pressures include VOC emission caps, PFAS restrictions, and escalating litigation tied to hazardous-substance designations, all driving costly reformulation initiatives.