
Specialty Pharmaceuticals Market Size and Share
Market Overview
| Study Period | 2020 - 2031 |
|---|---|
| Market Size (2026) | USD 22.12 Billion |
| Market Size (2031) | USD 99.63 Billion |
| Growth Rate (2026 - 2031) | 35.12 % |
| Fastest Growing Market | Asia Pacific |
| Largest Market | North America |
| Market Concentration | Medium |
Major Players *Disclaimer: Major Players sorted in no particular order Image © Mordor Intelligence. Reuse requires attribution under CC BY 4.0. | |
Specialty Pharmaceuticals Market Analysis by Mordor Intelligence
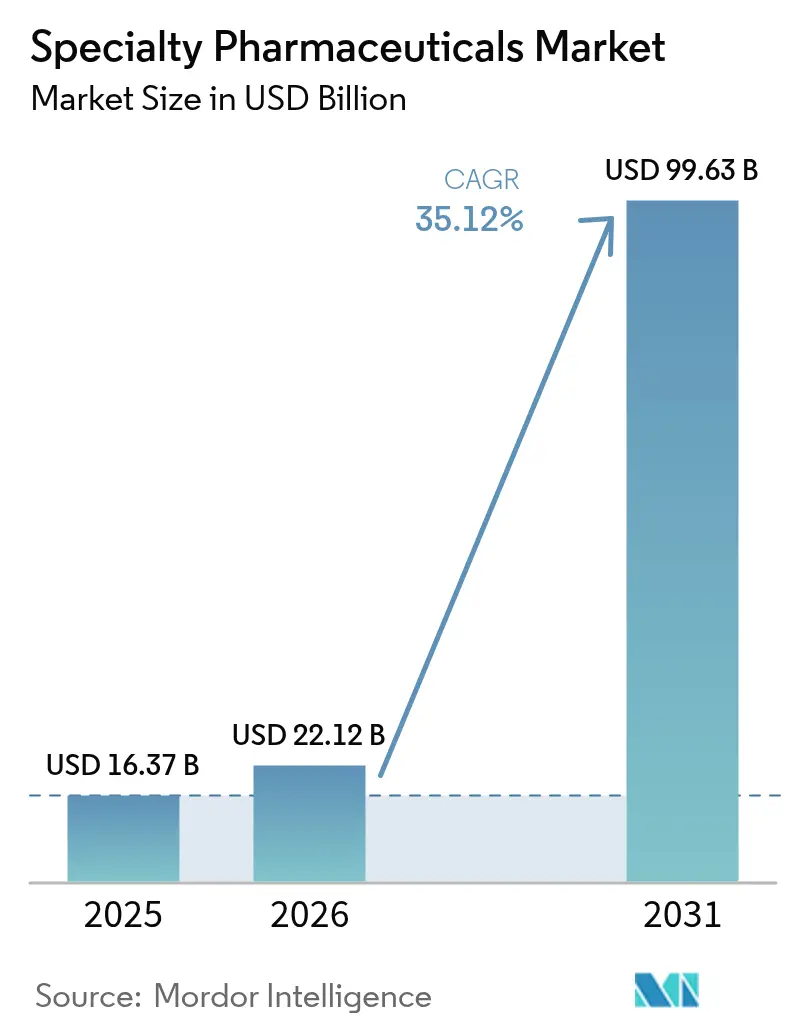
The specialty pharmaceuticals market size was valued at USD 16.37 billion in 2025 and estimated to grow from USD 22.12 billion in 2026 to reach USD 99.63 billion by 2031, at a CAGR of 35.12% during the forecast period (2026-2031). Robust demand for high-complexity therapies, the protection of launch-phase pricing power under the Inflation Reduction Act, and rapid biologics innovation together underpin this steep curve. Checkpoint inhibitor label expansions, orphan-drug designations, and priority-review vouchers are shortening commercialization cycles, while integrated specialty-pharmacy networks improve patient onboarding and adherence. Capital flows into manufacturing led by GLP-1 capacity expansions, CAR-T contract development, and facility retrofits for ultra-cold storage signal sustained interest in new modalities. Payer constraints are tightening, yet outcomes-based agreements and indication-specific pricing carve-outs remain viable access routes for breakthrough assets.
Key Report Takeaways
- By application, oncology led with 35.55% of the specialty pharmaceuticals market share in 2025. Rare and orphan disorders are projected to expand at a 36.85% CAGR through 2031.
- By drug class, biologics accounted for 60.53% of the specialty pharmaceutical market in 2025. Gene and cell therapies are advancing at a 37.75% CAGR between 2026-2031.
- By mode of administration, injectables and parenterals accounted for 76.15% of the specialty pharmaceuticals market size in 2025. Intravitreal delivery is growing at a 36.82% CAGR to 2031.
- By distribution channel, hospital pharmacies accounted for 45.52% of revenue in 2025. Online pharmacies are forecast to climb at a 37.12% CAGR through 2031.
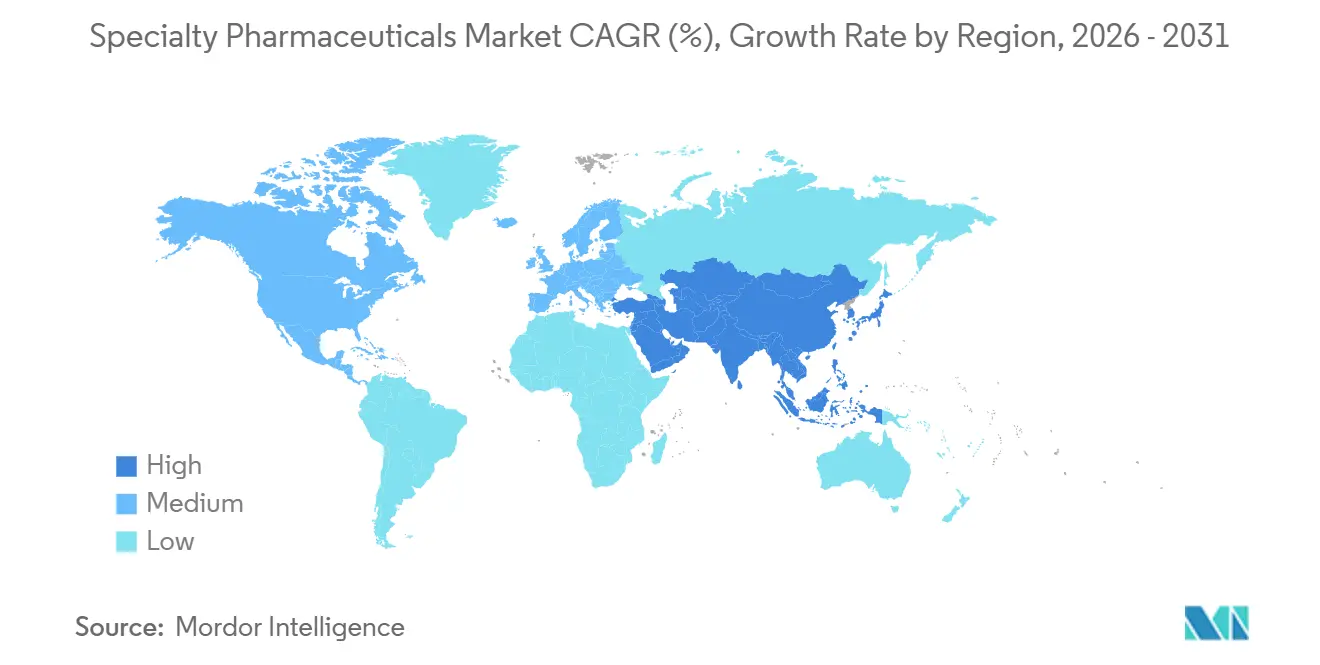
- By geography, North America retained leadership with a 46.62% share in 2025, but Asia-Pacific will post the fastest CAGR of 36.22% through 2031.
Note: Market size and forecast figures in this report are generated using Mordor Intelligence’s proprietary estimation framework, updated with the latest available data and insights as of 2026.
Market Trends and Insights
Drivers Impact Analysis of Specialty Pharmaceuticals Market*
| Driver | (~) % Impact on CAGR Forecast | Geographic Relevance | Impact Timeline |
|---|---|---|---|
| Rising Prevalence of Chronic & Rare Diseases | +8.2% | Global, with concentration in North America and Europe due to advanced diagnostics | Long term (≥ 4 years) |
| Rapid Expansion of Biologics & Biosimilars Pipeline | +9.5% | Global, APAC gaining share via India and China manufacturing scale-up | Medium term (2-4 years) |
| Growth of Integrated Specialty-Pharmacy Networks | +6.8% | North America core, early adoption in Western Europe | Medium term (2-4 years) |
| Orphan-Drug Priority Review Voucher Arbitrage | +4.1% | United States, with spillover to EU via regulatory harmonization | Short term (≤ 2 years) |
| Pay-for-Performance Contracts Unlocking Niche Access | +6.6% | North America and select EU markets (Germany, UK, Italy) | Long term (≥ 4 years) |
| Source: Mordor Intelligence | |||
Rising Prevalence of Chronic & Rare Diseases
More than 300 million people live with one of roughly 5,500 recognized rare diseases, yet diagnostic rates remain under 50% in many low- and middle-income countries[1].Next-generation sequencing now costs well below USD 1,000 per genome, enabling earlier identification of monogenic disorders and widening the treatment pool for enzyme-replacement and gene therapies. Chronic disease incidence is also climbing; six in ten U.S. adults live with at least one chronic condition, intensifying demand for long-term oncology, immunology, and endocrine regimens. In 2024, the FDA granted 46 orphan-drug designations, including gene therapies targeting Angelman syndrome and pregnancy complications, underscoring sustained sponsor interest in ultra-rare indications[2]. Accelerated-approval corridors, relied on for 72% of 2025 novel approvals, enable faster market entry but place post-marketing evidence burdens on manufacturers.
Rapid Expansion of Biologics & Biosimilars Pipeline
Seven orphan biologics cleared FDA review in 2024, headlined by the first engineered T-cell receptor therapy and a gene-edited treatment for leukodystrophy. Biosimilars are catching up; U.S. adalimumab analogs captured over 90% penetration by Q4 2024, eroding a USD 21 billion franchise. Europe’s prescribing quotas accelerate similar uptake, although interchangeable rules differ by country, complicating pan-European launches. China approved 82 innovative biologics in 2024, while CDMO majors are racing to open vector suites that reduce lead times from 18 months to near 12 months. Autologous CAR-T manufacture still needs 22-28 days per patient, pressuring innovators to develop off-the-shelf allogeneic platforms.
Growth of Integrated Specialty-Pharmacy Networks
Cardinal Health’s purchase of Specialty Networks typifies the vertical-integration push that merges dispensing, data, and patient support inside one entity. Health-system-owned specialty pharmacies now account for one-quarter of accredited U.S. locations, helping hospitals keep high-cost infused therapies in-house and skirt manufacturer 340B shipment limits. Outcomes-based deals are easier to execute within integrated networks; Zolgensma’s five-year installment model ties payment to motor milestone achievement, and CMS is piloting multi-state risk-pooling for one-time gene therapies. Still, disparate electronic health record systems and non-standardized real-world-evidence formats slow payer assessments of long-term efficacy.
Orphan-Drug Incentives & Favorable Reimbursement
Priority review vouchers sold for USD 100-150 million each through 2024, subsidizing the development of ultra-rare therapies. BioMarin and CSL Behring used voucher proceeds to offset the USD 2.9-3.5 million list prices for their hemophilia gene therapies. The sunset of the U.S. program eliminates this liquidity, while Europe lacks a similar voucher, driving sponsors to secure U.S. exclusivity first, then pursue EMA approval. Japan’s Sakigake pathway offers advice and priority review but lacks a tradable instrument, limiting its financial appeal.
Restraints Impact Analysis of Specialty Pharmaceuticals Market*
| Restraint | (~) % Impact on CAGR Forecast | Geographic Relevance | Impact Timeline |
|---|---|---|---|
| Escalating Treatment Costs & Payer Cost-Containment | -7.3% | Global, acute in U.S. due to IRA negotiation, Europe via HTA fragmentation | Medium term (2-4 years) |
| Complex Cold-Chain & Handling Logistics | -4.9% | Global, most pronounced in APAC and MEA due to infrastructure gaps | Long term (≥ 4 years) |
| Fragmented Real-World-Evidence Standards Slowing Uptake | -3.2% | Global, with divergence between FDA, EMA, and APAC regulatory frameworks | Long term (≥ 4 years) |
| Sustainability Pressure on Single-Use Delivery Devices | -2.8% | Europe core (EU MDR compliance), expanding to North America via ESG investor mandates | Medium term (2-4 years) |
| Source: Mordor Intelligence | |||
Escalating Treatment Costs & Payer Cost-Containment
Medicare’s first round of negotiated prices delivered mean discounts of 79%, slashing Enbrel to USD 2,355 and Imbruvica to USD 9,319 per month. Without out-of-pocket caps at USD 2,000 from 2025, plans and manufacturers shoulder greater cost, accelerating formulary exclusions and step-therapy rules. Private PBMs now require metformin trials before GLP-1 coverage, and UnitedHealthcare excluded Zepbound in favor of Wegovy to leverage higher rebates[3]. Gene-therapy pricing remains contentious; Casgevy’s USD 2.2 million tag faces scrutiny over 20-year durability, yet pivotal data cover only 31 patients. International reference pricing in Germany and other EU markets further compresses launch-year margins.
Complex Cold-Chain & Handling Logistics
Gene-therapy vials shipped at -80 °C incur 15-20% temperature deviations that trigger costly product loss. Treatment centers must install bespoke freezers, limiting Zynteglo and Roctavian access to ~40 U.S. sites. Roche’s Vabysmo permits only 24 hours at room temperature post-refrigeration; breaches require disposal, inflating waste. Dry-ice logistics contribute to a 15 million-ton carbon footprint, drawing ESG scrutiny. Smart containers with GPS and deviation alerts are rolling out, yet hospital inventory systems seldom integrate automatically, delaying dosing. EU Medical Device Regulation now demands lifecycle assessments for single-use injectors, adding compliance cost without delivering reusable alternatives.
*Our forecasts treat driver/restraint impacts as directional, not additive. The impact forecasts reflect baseline growth, mix effects, and variable interactions.
Specialty Pharmaceuticals Market Segment Analysis
By Application:
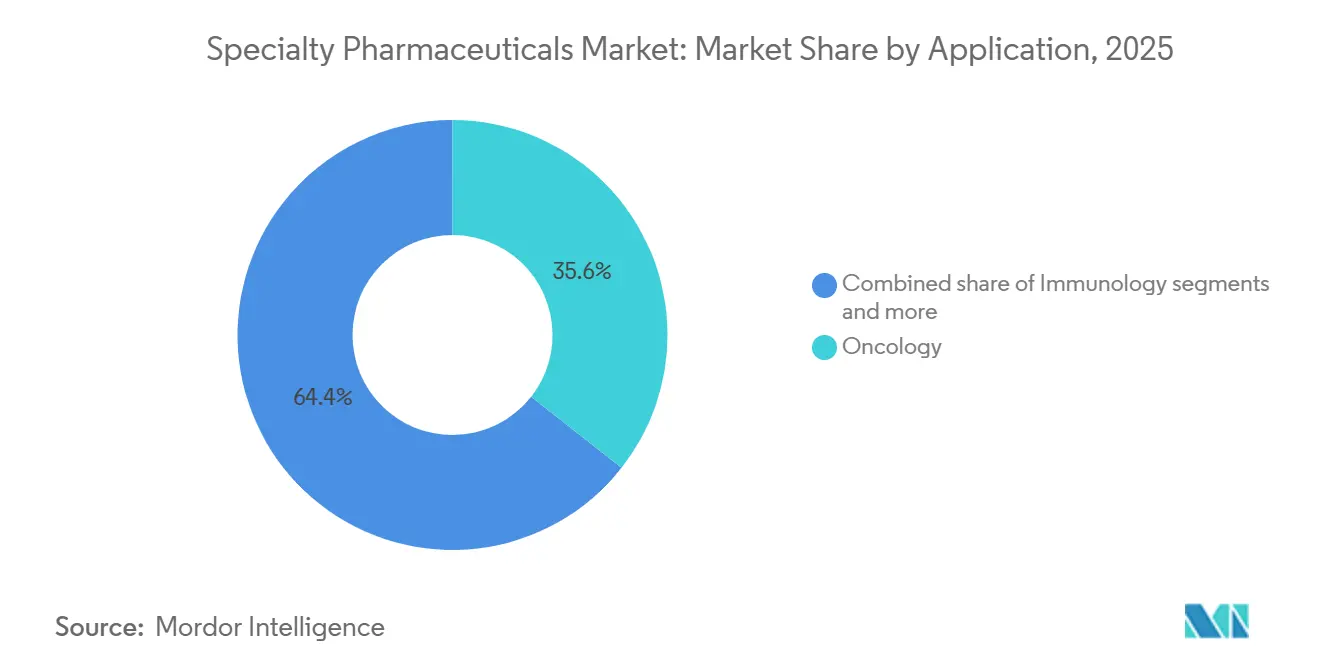
Oncology Dominance Meets Rare-Disease AccelerationOncology retained 35.55% of the specialty pharmaceuticals market share in 2025, driven by checkpoint inhibitors, antibody-drug conjugates, and CAR-T therapies. Rare-disease therapies, while smaller, are set to grow at a 36.85% CAGR through 2031 as the FDA fast-tracks ultra-orphan candidates. The specialty pharmaceuticals market size for oncology is projected to surpass USD 40 billion by 2031, while rare-disease revenue could multiply six-fold on the same horizon. Competitive intensity rises as new PD-1/TIGIT combinations and bispecific antibodies challenge incumbents.
Growth vectors differ. Oncology pipelines prioritize tumor-agnostic indications, whereas rare-disease sponsors focus on first-in-class gene-replacement approaches. Reimbursement hurdles diverge as well: value-based oncology contracts hinge on overall survival endpoints, while orphan therapies often face single-payer negotiations over ultra-high per-patient prices. The player mix reflects that divergence: big pharma dominates oncology, whereas venture-backed biotech maintains leadership positions in diseases with <10,000 patients globally.

By Drug Class:
Biologics Lead, Gene Therapies SurgeBiologics accounted for 60.53% of the 2025 specialty pharmaceutical market, buoyed by monoclonal antibodies, fusion proteins, and recombinant enzymes. Gene and cell therapies, though <5% revenue, are set for a 37.75% CAGR to 2031 as manufacturing bottlenecks ease. Within small molecules, targeted kinase inhibitors remain entrenched but face earlier generic erosion.
Commercial dynamics favor biologics for chronic diseases, with high refill frequency sustaining revenue, while one-time gene therapies rely on payer acceptance of multi-million-dollar price tags. Manufacturing scale is the swing factor; a single 2,000-liter bioreactor run can generate USD 500 million of monoclonal antibody supply, whereas autologous cell-therapy capacity remains patient-specific. Platform advances such as CRISPR-based off-the-shelf edits could shift that calculus.
By Mode of Administration:
Injectables Prevail, Intravitreal Innovations AccelerateInjectables accounted for 76.15 of % specialty pharmaceuticals market share in 2025, reflecting the dominance of parenteral biologics[4]. Intravitreal injections, though niche, will advance at a 36.82% CAGR on the back of extended-release port systems and dual-pathway inhibitors. Oral specialty agents hold a loyal niche in oncology and immunology but are not well-suited to clinical settings that demand rapid titration and adherence monitoring.
Patient preference is reshaping formats. Subcutaneous formulations of formerly IV drugs, such as infliximab, increase at-home dosing, while ocular implants, such as refillable ranibizumab reservoirs, reduce clinic visits by 90%. Still, adverse-event monitoring requirements tether many therapies to infusions at certified centers, sustaining procedure-based revenue streams for hospitals.
By Distribution Channel:
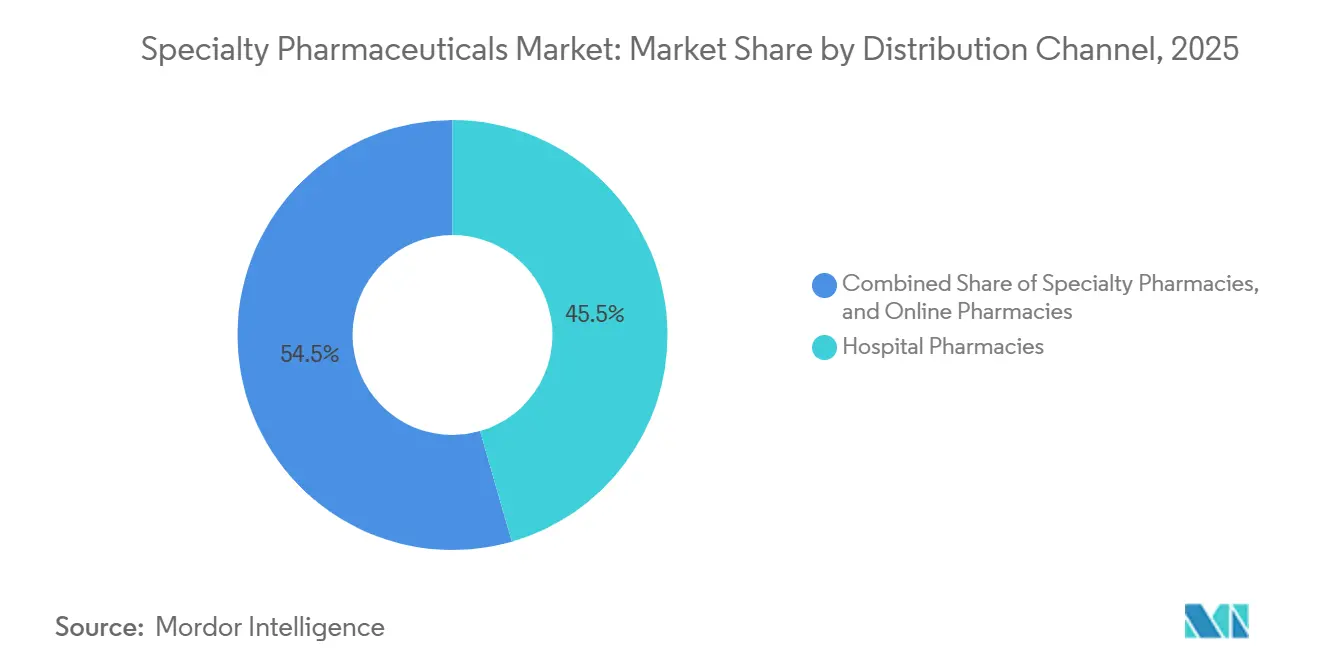
Hospital Pharmacies Lead, Online Platforms SurgeHospital pharmacies captured 45.52% of the specialty pharmaceutical market share in 2025, driven by infusion-center dominance. Online pharmacies, predicted to expand at a 37.12% CAGR, leverage telehealth triage, home delivery, and automated prior-authorization engines to win convenience-seeking patients.
Regulatory compliance will separate winners from laggards. Risk Evaluation and Mitigation Strategies restrict the distribution of high-risk therapies, giving accredited specialty networks an advantage over pure-play e-pharmacies. Yet state-level licensure reciprocity is expanding, and Amazon Pharmacy’s national footprint, along with One Medical’s telehealth node, creates an end-to-end virtual channel that could redirect chronic injectable refills away from brick-and-mortar outlets.
Geography Analysis
North America Specialty Pharmaceuticals Market
North America generated 46.62% of 2025 revenue as Medicare Part D specialty spend exceeded USD 133 billion, even before IRA negotiations trimmed headline prices. The United States commands the region through higher unit prices. Keytruda exceeds USD 200,000 annually and dense infusion-center networks. Canada enforces median international pricing, delaying several gene-therapy launches, while Mexico’s social-security expansion broadens biologic access but leaves large uninsured populations exposed.
Europe Specialty Pharmaceuticals Market
Europe trails in revenue but leads in biosimilar penetration. Germany’s early benefit assessment and AMNOG negotiations cut list prices by up to 50% within 1 year of launch. France, Italy, and Spain pursue parallel HTA reviews even under the EU’s 2025 joint-assessment regulation, extending market-access timelines by 12-18 months. The United Kingdom’s QALY-based pricing cap keeps many gene therapies in “managed access” schemes.
APAC and GCC Specialty Pharmaceuticals Market
Asia-Pacific delivers the steepest growth trajectory at a 36.22% CAGR and could match North America’s revenue by 2031. China green-lit 82 novel therapies in 2024, and Beijing’s volume-based procurement lowers prices yet expands volumes. India’s biosimilar export boom benefits from FDA mutual inspections; Biocon and Dr. Reddy’s secure first-to-file slots for denosumab and aflibercept analogs. Japan’s Sakigake pathway speeds review, but biennial price cuts erode five-year revenue curves. Australia, South Korea, and GCC states broaden reimbursement but still negotiate aggressive risk-sharing deals, limiting upside.
Regulatory Landscape
Specialty pharmaceuticals face a tight coupling of expedited review pathways and intensifying price and supply-chain scrutiny across major markets. In the United States, FDA/CDER maintained a high pace of innovation review, with 46 novel drugs approved in 2025, and expedited programs supporting a large share of those approvals. By July 7, 2026 (through July 7), CDER had already cleared 24 new molecular entities and biological therapeutics.
In Europe, the EMA continued to steer innovation through mechanisms such as the PRIME scheme, with CHMP adopting new eligibility recommendations in April 2026, and CHMP opinions in 2026 covering specialty-therapy decisions spanning oncology and advanced modalities. Policy is also reshaping commercialization and sourcing strategies. In April 2026, the White House issued a proclamation to adjust U.S. imports of pharmaceuticals and pharmaceutical ingredients, combining tariff actions with pathways tied to MFN pricing and onshoring-type agreements, which increases the importance of localized manufacturing and pricing commitments for global suppliers. Legislative attention to supply-chain economics also increased in early 2026 with the introduction of S.3751 (Prescription Drug Supply Chain Pricing Transparency Act), signaling additional oversight pressure on pricing-related compensation structures in the distribution chain that affects specialty drug access and contracting.
Competitive Landscape
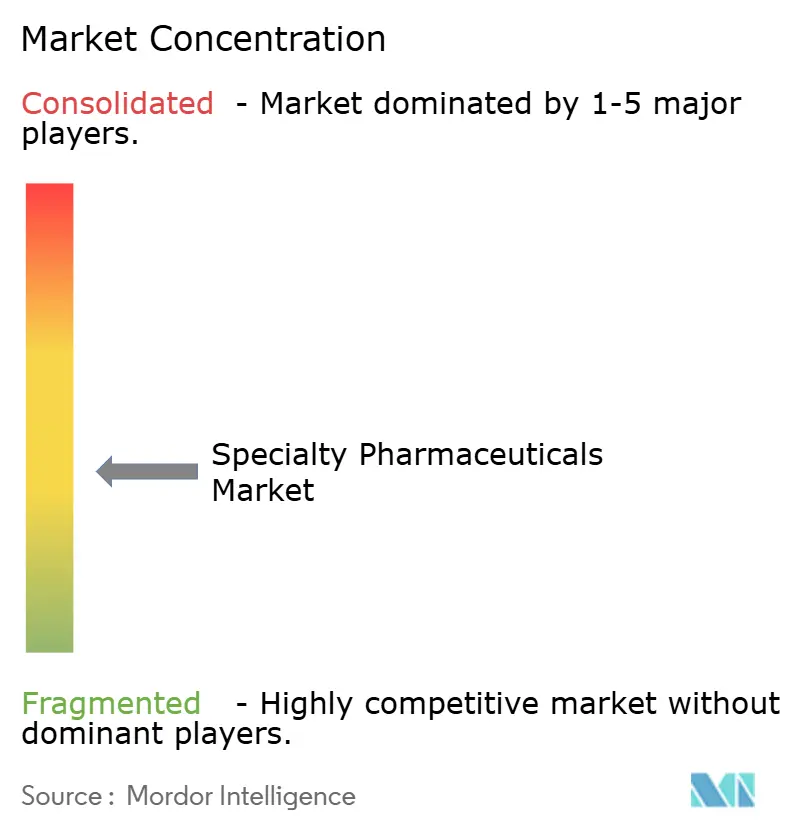
Ten manufacturers capture the majority of specialty pharmaceutical market revenue, signaling moderate concentration. AbbVie, Pfizer, Roche, Novartis, Johnson & Johnson, Eli Lilly, Novo Nordisk, Bristol Myers Squibb, Amgen, and Merck dominate oncology, immunology, and metabolic franchises. Consolidation accelerates: Amgen bought Horizon for USD 27.8 billion, acquiring Tepezza for thyroid eye disease; Pfizer paid USD 43 billion for Seagen’s antibody-drug conjugates.
Biosimilars disrupt established cash cows. Humira analogs reached 90% penetration by Q4 2024, collapsing AbbVie’s adalimumab revenue below USD 3 billion. GLP-1 capacity lags demand despite Novo Nordisk and Eli Lilly investing >USD 9 billion in new plants, opening gray-market compounding channels. Gene-therapy pioneers such as Sarepta and Vertex punch above their weight in valuation, leveraging single-asset orphan exclusivity to command multibillion-dollar revenue streams.
Strategy tilts toward digital wrap-arounds. Novo Nordisk’s connected pens transmit adherence data, Eli Lilly’s diabetes platform bundles remote coaching, and Roche’s Foundation Medicine aligns diagnostics with targeted therapy sales. Patent strategies remain aggressive; AbbVie filed >130 Humira patents, delaying biosimilars by eight years, and similar “patent thickets” shield Skyrizi and Rinvoq until late decade. ESG and MDR compliance now influence injector design and carbon accounting, elevating the bar for new entrants.
Specialty Pharmaceuticals Industry Leaders
-
Teva Pharmaceutical Industries Ltd.
-
AbbVie, Inc.
-
Amgen Inc.
-
Johnson and Johnson
-
Bristol-Myers Squibb Company
- *Disclaimer: Major Players sorted in no particular order
Specialty Pharmaceuticals Market Companies Covered in this Report
- Abbvie
- Amgen
- AstraZeneca
- Bayer
- Biogen
- BioMarin
- Boehringer Ingelheim
- Bristol-Myers Squibb
- CSL Behring
- Eli Lilly and Company
- Gilead Sciences
- GlaxoSmithKline
- Horizon Therapeutics
- Johnson & Johnson
- Merck
- Moderna
- Novartis
- Novo Nordisk
- Pfizer
- Regeneron
- Roche
- Sanofi
- Sarepta Therapeutics
- Takeda Pharmaceuticals
- Teva Pharmaceutical Industries
- UCB
- Vertex Pharmaceuticals
Market Opportunities and Future Outlook
Manufacturing capacity and localization initiatives are creating near-term whitespace for specialty modalities that depend on complex production and delivery requirements. PCI Pharma Services outlined investments exceeding USD 1 billion in U.S. sterile fill-finish and drug-device combination capabilities, while Evonik committed USD 100 million over five years to modernize its Tippecanoe Labs site in Indiana for small-molecule drug substance demand. In peptides and related high-complexity chemistries that support specialty injectables and next-generation formulations, AmbioPharm expanded its North Augusta, South Carolina footprint by adding 68,000 square feet for peptide API synthesis in March 2026. Capacity additions in India also reinforce upstream build-out for chronic specialty therapies, with Aarti Pharmalabs commissioning a Tarapur block to reach 9,600 TPA xanthine derivatives capacity in July 2026.
Portfolio consolidation and rights acquisitions in rare disease and other specialty segments are also creating commercialization opportunities for companies with established specialty-pharmacy access, patient services, and reimbursement infrastructure. Shionogi completed the acquisition of global rights to RADICAVA (edaravone) for USD 2.5 billion in April 2026, and Angelini Pharma completed the acquisition of Catalyst Pharmaceuticals in July 2026 to strengthen its position in brain health and rare diseases. Separately, on the regulatory side, the European Union reached political agreement in March 2026 on a comprehensive pharmaceutical reform package that shortens standard EMA scientific assessment timelines from 210 to 180 days and introduces tighter supply-disruption notification and shortage prevention plan requirements, which supports access for well-prepared dossiers and adds compliance-driven demand for more resilient, monitorable supply chains.
Recent Industry Developments in Specialty Pharmaceuticals Market
- July 2026: AbbVie reported that Allergan Aesthetics received European Commission approval for Boey (trenibotulinumtoxinE) for the temporary improvement of frown lines in adult patients. The approval adds a differentiated rapid-onset, short-duration neurotoxin option in Europe, expanding AbbVie's specialty aesthetics portfolio and reinforcing its regulatory execution in the region.
- August 2025: SERB Pharmaceuticals agreed to acquire Y-mAbs Therapeutics for USD 412 million in cash, adding Danyelza to its oncology portfolio. The deal strengthened SERB's specialty oncology footprint and broadened its commercial base in high-complexity, hospital-administered therapies.
- June 2024: The FDA granted 46 orphan-drug designations during the year, sustaining the pipeline flow for ultra-rare specialty indications. This volume of designations supports continued utilization of expedited pathways and encourages sponsors to build evidence and access strategies tailored to small, high-need patient populations.
Specialty Pharmaceuticals Market Report Scope and Research Methodology
Market Definition and Coverage
In this report, we size specialty pharmaceuticals as high cost therapies that are complex to handle or monitor, often requiring special distribution, patient support, and reimbursement steps across retail, hospital, and specialty pharmacy settings.
Scope exclusions: We exclude conventional mass market small molecule drugs, OTC products, and non-drug services that may sit around care delivery.
Segments Covered in This Report
- By Application
- Oncology
- Immunology
- Endocrinology
- Infectious Diseases
- Neurology
- Rare & Orphan Disorders
- Cardiovascular
- Ophthalmology
- By Drug Class
- Biologics
- Small-molecule specialty drugs
- Gene & Cell Therapies
- Peptide Therapeutics
- By Mode of Administration
- Injectable/ Parenteral
- Oral
- Intravitreal / Ocular
- Others
- By Distribution Channel
- Hospital Pharmacies
- Specialty Pharmacies
- Online Pharmacies
- By Geography
- North America
- United States
- Canada
- Mexico
- Europe
- Germany
- United Kingdom
- France
- Italy
- Spain
- Rest of Europe
- Asia-Pacific
- China
- India
- Japan
- Australia
- South Korea
- Rest of Asia-Pacific
- Middle East and Africa
- GCC
- South Africa
- Rest of Middle East and Africa
- South America
- Brazil
- Argentina
- Rest of South America
- North America
Data Sources, Market Sizing, and Validation
Desk Research
Desk research was used to build the initial demand and supply picture and to set guardrails for therapy mix, pricing, and access dynamics. We relied on public and official sources such as FDA databases for approvals and labels, the CDC for disease burden indicators, the WHO for global epidemiology framing, and OECD health statistics for spending and utilization context. For trade and availability signals, we also reviewed sources such as the US International Trade Commission data and patent databases to understand innovation intensity around biologics and advanced therapies.
Alongside this, we used company filings, investor presentations, earnings call transcripts, and credible press coverage to track product launches, loss of exclusivity events, and patient support approaches that change realized revenues. Select paid subscriptions for company financials and news were referenced to standardize company level disclosures across regions, and then our assumptions were cross checked back to public evidence. The sources named above are illustrative and not exhaustive, and many other references were used to collect data, validate assumptions, and clarify definitions during the research process.
Primary Interviews and Surveys
Primary work focused on validating what is actually treated as specialty in day to day contracting and dispensing, since definitions differ by payer and channel. We spoke with stakeholders across manufacturers, specialty pharmacies, hospital pharmacies, distributors, payers, and clinicians to pressure test therapy level uptake, typical patient journey steps, and price realization versus list price. Coverage was kept global so regional differences in reimbursement, cold chain handling, and site of care shifts could be built into the model assumptions.
Distribution of primary research fieldwork respondents
| Company type | Respondent position | Region |
|---|---|---|
| Top tier: 32% | CXOs: 17% | APAC: 46% |
| Mid tier: 51% | Functional/Unit leaders: 38% | EMEA: 30% |
| Smaller Players: 17% | Managers: 45% | Americas: 24% |
Market-Sizing & Forecasting
The market is built using a combined top-down and bottom-up approach so the totals stay realistic while still reflecting how specialty drugs are actually purchased and reimbursed. On the top-down side, we reconstruct the specialty demand pool by therapy area using treated patient volumes and therapy adoption patterns, and then translate that into value using typical annual therapy cost and net price adjustments. Once that structure is in place, it is checked with selective bottom-up approximations such as sampled company revenue attribution, channel level splits (hospital pharmacy versus specialty pharmacy), and price per patient checks for high value therapies.
A few inputs matter more than others, and they are tracked closely because they move the value in a visible way. These include the number of specialty eligible patients by major indications, biologics and advanced therapy penetration, site of care shifts from hospital to alternate infusion settings, access restrictions such as prior authorization intensity, and list to net dynamics influenced by rebates and patient assistance programs. For forecasting, we mainly use scenario analysis supported by simple trend fitting, since pipeline approvals, label expansions, and payer behavior can change stepwise rather than smoothly. Where bottom-up inputs are missing for smaller countries or limited distribution products, gaps are handled through proxy pricing bands and regional adoption curves, and then reconciled back to the top-down totals.
Data Validation & Update Cycle
Validation is done through triangulation across independent checks so the model does not rely on a single source type. We compare outputs against related signals such as pharma spending direction, major therapy class growth patterns, and publicly visible launch timing, and then investigate any large variance before the numbers are finalized. When we see outliers, the assumptions are revisited, and respondents may be re-contacted to confirm whether a change came from pricing, access, or patient volumes.
Each dataset and key assumption goes through multi-step analyst review, followed by a final sign-off pass that checks arithmetic, definitions, and year over year movements. Reports are refreshed at least once a year, and interim adjustments are made when material events occur, such as major regulatory decisions or reimbursement rule changes. Before delivery, the latest news flow and public data releases are reviewed again so clients receive an updated view.
Mordor Intelligence's Specialty Pharmaceuticals Market Size Compared With Other Published Estimates
Published market sizes for specialty pharmaceuticals often look far apart because the term specialty is not used the same way across payers, channels, and regions. The gap usually comes from what is counted as in-scope therapy revenue, which years are used as the starting point, and whether list prices or net realized prices are used in the math.
By tracking therapy level treated patient counts, net price adjustments, and annual definition refreshes, Mordor Intelligence keeps the estimate aligned to drugs that are actually managed through specialty handling and reimbursement workflows, rather than folding in broader branded pharma revenue. Some estimates include large swaths of biologics without checking specialty channel routing, and others apply aggressive growth curves that assume fast, uniform uptake across all regions. Currency conversion timing and the way pipeline driven step changes are handled also create differences, especially in years when high value therapies see label expansions or access tightening.
Benchmark comparison
| Source | Market Size | Gaps in Research Methodology |
|---|---|---|
| Mordor Intelligence | USD 16.37 B (2025) | |
| Global Publisher A | USD 129.23 B (2024) | Uses a wider specialty label that can capture broad biologics value across channels, and it is anchored to a different base year, which makes the scale larger even before forecasting assumptions are applied. |
| Industry Research Group B | USD 330.00 B (2024) | Applies an expansive specialty pharma revenue pool with limited visibility on net price logic and channel level qualification, which can pull in adjacent branded categories not treated as specialty under stricter access and handling criteria. |
Overall, the spread in the table is mainly a scope and pricing-definition issue, followed by base year choice. Our approach stays repeatable because each step ties back to observable patient volumes, therapy level adoption, and realistic net pricing assumptions that can be rechecked when the market shifts.
Key Questions Answered in the Report
What is the projected value of the specialty pharmaceuticals market by 2031?
It is forecast to reach USD 99.63 billion by 2031 on a 35.1% CAGR trajectory.
Which therapeutic area held the largest share in 2025?
Oncology led with 35.55% specialty pharmaceuticals market share in 2025.
How fast are gene and cell therapies expected to grow?
They are projected to expand at a 37.75% CAGR between 2026-2031.
Why are hospital pharmacies still dominant in distribution?
Many infused and injectable therapies require on-site monitoring, giving hospital pharmacies 45.52% revenue share in 2025.
Which region will grow the quickest through 2031?
Asia-Pacific, propelled by faster regulatory approvals in China and expanding biosimilar exports from India, is set to grow at a 36.22% CAGR.