
Specialty PACS Market Size and Share
Market Overview
| Study Period | 2020 - 2031 |
|---|---|
| Market Size (2026) | USD 2.95 Billion |
| Market Size (2031) | USD 4.07 Billion |
| Growth Rate (2026 - 2031) | 6.64 % |
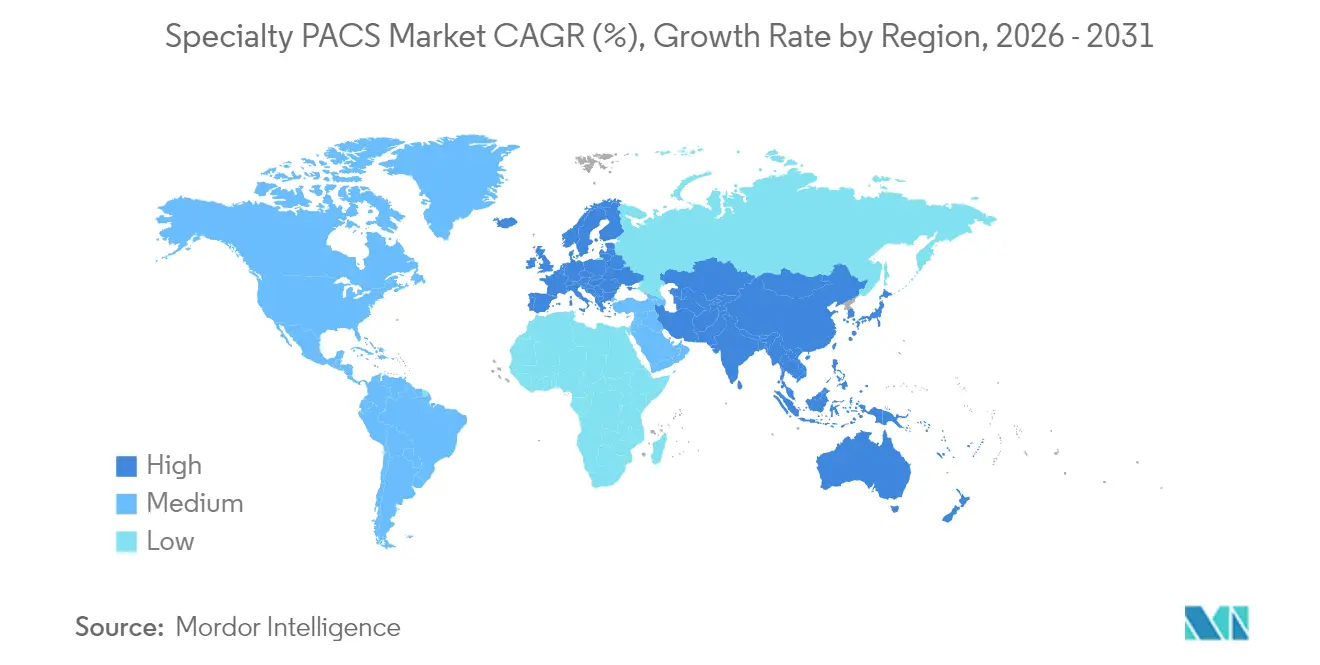
| Fastest Growing Market | Asia Pacific |
| Largest Market | North America |
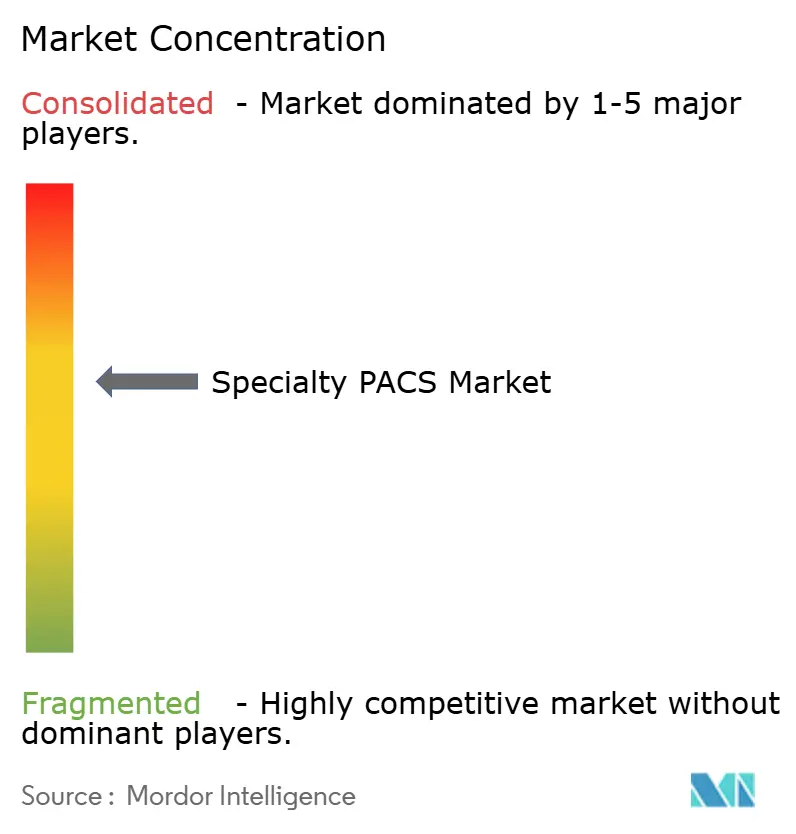
| Market Concentration | Medium |
Major Players *Disclaimer: Major Players sorted in no particular order Image © Mordor Intelligence. Reuse requires attribution under CC BY 4.0. | |
Specialty PACS Market Analysis by Mordor Intelligence
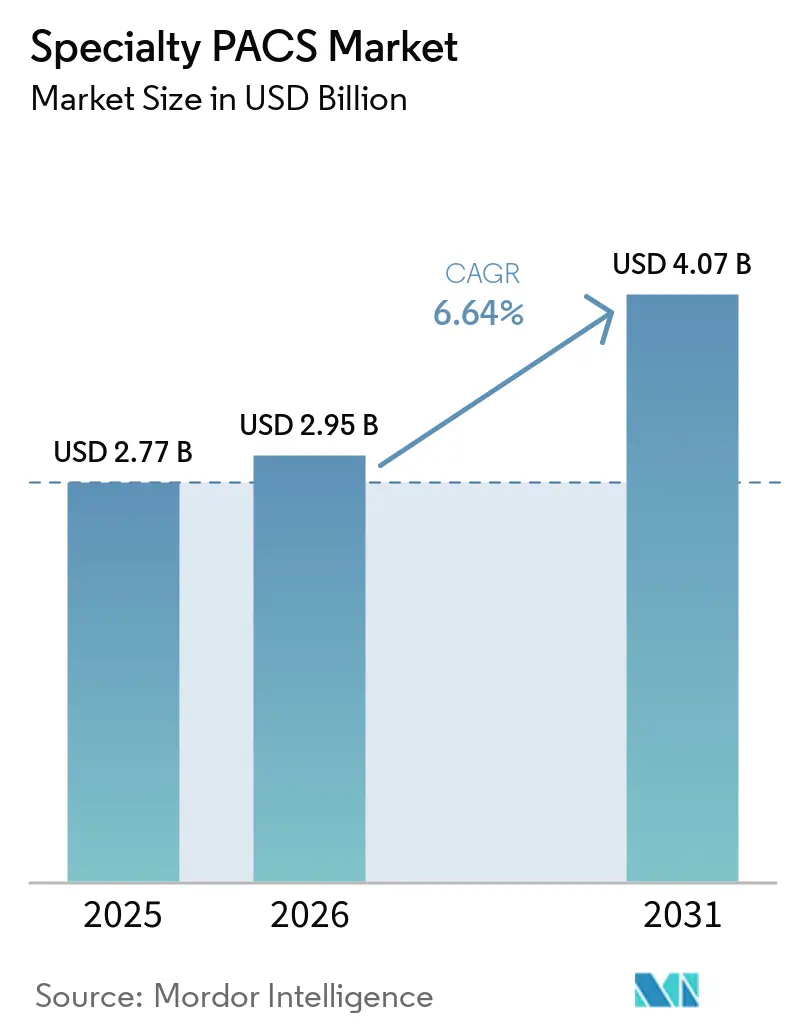
The Specialty PACS market size was valued at USD 2.77 billion in 2025 and estimated to grow from USD 2.95 billion in 2026 to reach USD 4.07 billion by 2031, at a CAGR of 6.64% during the forecast period (2026-2031). Increasing enterprise-wide imaging adoption, rapid cloud migration, and AI-ready architectures are reinforcing long-term revenue visibility for the Specialty PACS market. Vendors with robust cybersecurity and regulatory compliance credentials are attracting larger contracts as hospitals prioritize managed cloud services that lower total cost of ownership. Meanwhile, AI-driven workflow orchestration tools are becoming indispensable as imaging volumes surge and reimbursement models reward analytics-enabled quality improvements. The widening capability gap between modern cloud platforms and legacy departmental systems is expected to keep replacement cycles brisk, notably in North America and Asia-Pacific.
Key Report Takeaways
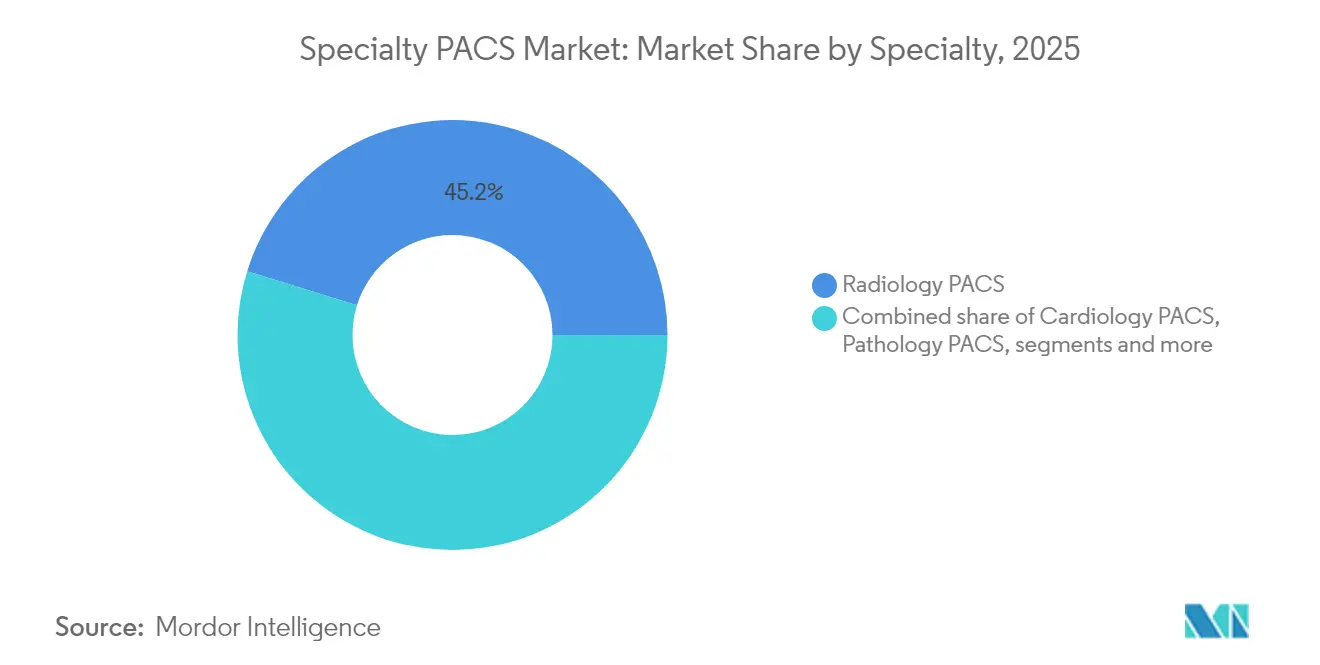
- By specialty, Radiology commanded 45.20% of the Specialty PACS market share in 2025, whereas Ophthalmology PACS is projected to expand at an 7.28% CAGR through 2031.
- By component, software led with a 58.70% share of the Specialty PACS market size in 2025, yet services are on course for an 8.18% CAGR over 2026-2031.
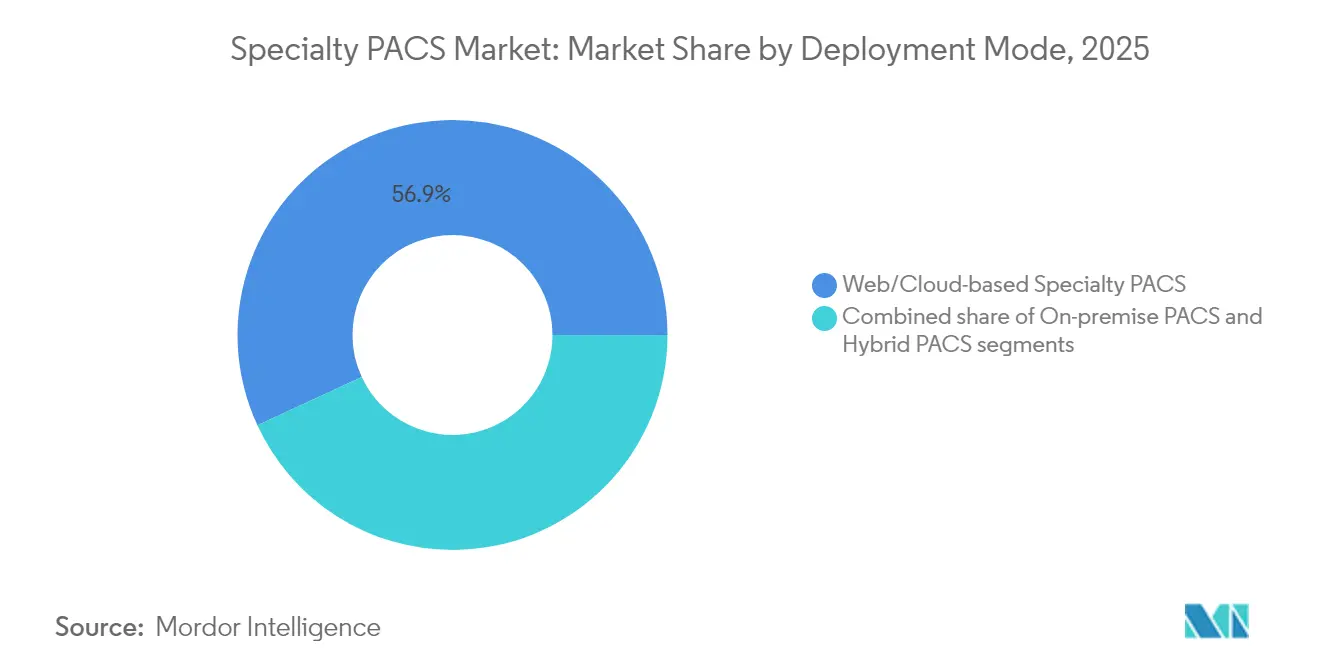
- By deployment model, web/cloud platforms captured 56.90% of the Specialty PACS market share in 2025 and are expected to grow at a 8.86% CAGR.
- By end user, hospitals accounted for 61.95% of the Specialty PACS market size in 2025, while diagnostic imaging centers are poised for an 8.05% CAGR.
- By geography, North America held 43.85% of Specialty PACS market share in 2025; Asia-Pacific is the fastest growing region at a 9.15% CAGR.
Note: Market size and forecast figures in this report are generated using Mordor Intelligence’s proprietary estimation framework, updated with the latest available data and insights as of 2026.
Market Trends and Insights
Drivers Impact Analysis of Specialty PACS Market*
| Driver | (~) % Impact on CAGR Forecast | Geographic Relevance | Impact Timeline |
|---|---|---|---|
| Growing use of imaging devices | +1.8% | Global, North America & APAC | Medium term (2-4 years) |
| Increasing burden of chronic diseases | +1.5% | Global, chiefly APAC & MEA | Long term (≥ 4 years) |
| Enterprise-wide imaging adoption | +1.2% | North America & EU, APAC catching up | Medium term (2-4 years) |
| AI-ready architecture demand | +1.1% | North America & EU core, APAC spillover | Short term (≤ 2 years) |
| Reimbursement-linked image analytics | +0.9% | North America, selected EU markets | Medium term (2-4 years) |
| Decentralized trials & tele-imaging | +0.7% | Global, rural and underserved zones | Short term (≤ 2 years) |
| Source: Mordor Intelligence | |||
Growing Use of Imaging Devices
Advanced photon-counting CT and digital SPECT entered commercial deployment in 2025, intensifying imaging throughput and expanding modality diversity. Point-of-care ultrasound adoption remains high in post-pandemic environments, compelling providers to select Specialty PACS market platforms that manage data from mobile devices as effortlessly as radiology suites. Double-digit reimbursement growth for coronary CT angiography further increases scan volumes, magnifying the need for vendor-neutral archives. These dynamics elevate AI-driven workflow tools that automate triage and reporting across modalities, underscoring why health systems are modernizing Specialty PACS market infrastructure rather than extending legacy contracts.
Increasing Burden of Chronic Diseases
Global diabetes prevalence and aging populations are reshaping ophthalmology and cardiology imaging workflows. AI models now deliver 100% sensitivity in diabetic retinopathy screening, prompting eye clinics to embed longitudinal comparison features within Specialty PACS market environments. Echocardiography studies also require integrated cardiovascular information systems for precise trend analysis, while oncology practices demand cross-specialty image aggregation to align with precision medicine protocols.
Enterprise-wide Imaging Adoption
Health systems continue to replace departmental silos with unified archives that span radiology, cardiology, and pathology, eliminating accessibility barriers that impede multidisciplinary care. More than 95% of North American providers have active cloud migration plans, a shift that accelerates Specialty PACS market uptake as vendor-neutral archives become mandatory for future-proofing investments.[1]Improved data liquidity simultaneously streamlines AI model deployment across larger, more diverse datasets, enhancing algorithm robustness and clinical value.
AI-ready Architecture Demand
The FDA’s 2025 guidance on predetermined change-control plans is catalyzing hospital confidence in AI workflows. PACS-AI platforms now enable real-time inferencing at the modality console, reducing documentation time by 45% and boosting critical-care response by 37.8%. Cloud-native Specialty PACS market solutions deliver the elasticity needed for continuous algorithm training without costly on-premises GPU clusters, advancing predictive analytics adoption beyond early-adopter academic centers.
Restraints Impact Analysis of Specialty PACS Market*
| Restraint | (~) % Impact on CAGR Forecast | Geographic Relevance | Impact Timeline |
|---|---|---|---|
| Data security & privacy concerns | -1.3% | Global, North America & EU heightened | Short term (≤ 2 years) |
| High capex & migration costs | -1.1% | Global, small systems hit hardest | Medium term (2-4 years) |
| Vendor lock-in risk | -0.8% | Global, fragmented markets | Long term (≥ 4 years) |
| Cloud/AI skills gap | -0.9% | Global, acute in emerging markets | Medium term (2-4 years) |
| Source: Mordor Intelligence | |||
Data Security & Privacy Concerns
Ransomware groups such as Rhysida are targeting imaging archives, with one Pennsylvania breach costing USD 65 million in settlements and drawing attention to PACS vulnerabilities. Upcoming mandatory U.S. cybersecurity requirements will likely drive urgent Specialty PACS market upgrades, yet lengthy security assessments delay go-lives. Vendors now tout zero-trust architectures and end-to-end encryption, but steep learning curves can slow clinician adoption.
High Capex & Migration Costs
Supply-chain turbulence has added USD 100,000–200,000 to premium scanner prices, inflating replacement budgets. Smaller community hospitals often defer Specialty PACS market projects, increasing the risk of data silos. Cloud subscriptions cut upfront spend by up to 30%, though CIOs remain wary of recurring fees and egress costs.[2]
*Our forecasts treat driver/restraint impacts as directional, not additive. The impact forecasts reflect baseline growth, mix effects, and variable interactions.
Specialty PACS Market Segment Analysis
By Specialty:
Radiology Dominance Faces Ophthalmology DisruptionRadiology accounted for 45.20% of the Specialty PACS market share in 2025, a testament to its status as the imaging backbone for acute and outpatient care. Adoption remains steady as enterprise imaging budgets prioritize large-volume radiology workflows. In contrast, Ophthalmology posted an 7.28% CAGR outlook to 2031, spurred by AI-enabled retinal screening programs that flag diabetic macular edema with 97% accuracy. The Specialty PACS market size for ophthalmology is projected to widen as public health agencies sponsor mass screening, demanding longitudinal comparison features absent from older departmental systems. Cardiology PACS growth continues via tight integration with echocardiography reporting suites, whereas digital pathology gains momentum through telepathology mandates in Europe.
Second-tier specialties such as neurology and women’s health are integrating AI modules for stroke detection and breast density assessment, catalyzing adoption beyond tertiary centers. Orthopedic and dermatology segments benefit from sports medicine demand and AI lesion analysis but contend with interoperability gaps that lengthen procurement cycles. The Specialty PACS market ultimately favors vendors offering configurable workflows that honor specialty nuances while sharing a common enterprise backbone.

By Component:
Services Surge Amid Software SaturationSoftware retained 58.70% share of the Specialty PACS market size in 2025, reflecting entrenched license footprints across hospital networks. However, services—hosting, migration, cybersecurity, and AI model management—are forecast for an 8.18% CAGR, outpacing software due to hospitals’ shift toward outcome-based contracts. Increasingly, CIOs choose managed cloud PACS to offset talent shortages and rapidly deploy new features. The Specialty PACS market now rewards vendors that bundle 24/7 monitoring and continuous performance tuning rather than relying on periodic version upgrades.
Hardware revenues plateau as data center consolidation and virtualization reduce workstation refresh volumes. Nevertheless, high-resolution diagnostic displays and local caching appliances remain essential for latency-sensitive use cases. Subscription models linked to imaging volume provide budget predictability, aligning vendor incentives with provider operational efficiency goals.
By Deployment Model:
Cloud Acceleration Reshapes InfrastructureWeb/cloud deployments held 56.90% of Specialty PACS market share in 2025 and carry the highest 8.86% CAGR outlook. COVID-19 spurred telework policies that entrenched demand for secure remote reading, while mounting ransomware incidents pushed executives toward professionally managed environments. Hybrid approaches give cautious systems a migration runway, retaining critical archives on-premises yet leveraging cloud elasticity for AI processing. On-premise deployments persist in defense and academic centers with bespoke cybersecurity requirements, but their proportion will shrink as network bandwidth improves.
Cloud-native architectures unlock real-time analytics and conversational reporting. Radiologists using generative AI dictation within a cloud-based Specialty PACS market environment have reported 20% productivity gains, boosting morale amid workforce shortages. Secure multi-tenant designs also streamline updates, allowing simultaneous rollout of FDA-cleared AI algorithms across an enterprise without weekend downtime.
By End User:
Hospitals Lead While Imaging Centers AccelerateHospitals represented 61.95% of Specialty PACS market size in 2025, anchored by enterprise imaging investments that converge radiology, cardiology, and pathology repositories. Large IDNs leverage economies of scale to negotiate bundled hardware-software-service agreements. Yet diagnostic imaging centers are slated for an 8.05% CAGR to 2031 as payers push procedures to lower-cost outpatient settings. These centers favor cloud PACS that require minimal onsite IT, enabling rapid site expansion.
Ambulatory surgery centers and specialist clinics add imaging modalities to retain referrals, selecting lightweight Specialty PACS market platforms with embedded AI triage for musculoskeletal and breast imaging. Academic institutes continue deploying research PACS for clinical trials, reinforcing the need for configurable de-identification workflows.
Geography Analysis
North America Specialty PACS Market
North America held 43.85% of Specialty PACS market share in 2025, supported by mature reimbursement schemes and leading-edge cloud strategies. CMS telehealth expansions and an FDA AI framework foster a permissive environment for rapid product iteration. Canon Medical’s USD 34 million Cleveland facility underscores the region’s pull for R&D investment. Heightened cybersecurity mandates, however, raise compliance expenses and lengthen implementation testing cycles.
APAC Specialty PACS Market
Asia-Pacific is forecast to post a 9.15% CAGR, the fastest among all regions. Singapore earmarked USD 200 million for AI innovation, while South Korea’s 1.2 trillion won (USD 830 million) smart-hospital program accelerates Specialty PACS market penetration.Cloud PACS adoption mitigates IT staffing gaps, and private equity funds target regional imaging chains for roll-up strategies. The AI in medtech segment is projected to reach USD 250 million by 2028, further bolstering imaging IT demand.
Europe Specialty PACS Market
Europe enjoys steady uptake driven by GDPR-aligned cloud services and cross-border digital-health projects. Philips expanded enterprise imaging on AWS to service EU providers, integrating automated AI reporting while safeguarding data privacy. Nevertheless, divergent national procurement rules lengthen sales cycles, compelling vendors to maintain multi-jurisdiction regulatory teams.
Regulatory Landscape
Specialty PACS is regulated primarily as medical device software when intended for diagnostic image management. In the United States, PACS-related products are commonly classified under FDA Class II medical image management and processing system requirements (21 CFR 892.2050) and reviewed through the 510(k) pathway. Clearance activity continued in 2026, including the FDA 510(k) clearance for CliniComp International's CCI PACS VIEWER (K254237, April 23, 2026), reinforcing the need for validated performance, cybersecurity controls, and disciplined change management for clinical imaging viewers and archives.
Interoperability and AI governance are tightening in parallel. ISO published ISO 12052:2026 (DICOM) in February 2026, replacing the 2017 edition and setting an updated baseline for imaging data formatting and exchange that specialty PACS vendors must support across modalities and enterprise imaging programs. In Europe, MDCG 2025-6 (June 2025) provides guidance on aligning medical device software technical documentation with the EU AI Act (Regulation (EU) 2024/1689). The European Commission also issued COM(2025) 1023 final (December 2025), proposing MDR/IVDR amendments intended to simplify elements of the framework and adjust transition mechanisms, which can affect market access planning and documentation strategies for vendors selling into EU health systems.
Value Chain Analysis
The specialty PACS value chain spans (1) infrastructure inputs such as servers, storage, networking, diagnostic workstations, and cybersecurity tooling, (2) core software development for image ingestion, archive, viewers, workflow, and specialty-specific modules, and (3) deployment, integration, and managed services delivered by vendors and system integrators into hospitals, imaging centers, and specialty clinics. Cloud delivery has increased the importance of hyperscale infrastructure and managed security operations upstream, while downstream value increasingly concentrates in implementation services, data migration, and ongoing platform operations as providers look to reduce internal IT burden.
Interoperability standards influence vendor selection and the integration effort. DICOM remains foundational for image objects, with growing emphasis on web and API-based exchange using DICOMweb (e.g., WADO-RS, STOW-RS) and HL7 FHIR imaging resources (e.g., ImagingStudy, ImagingSelection) to support enterprise imaging, multi-site reading, and cross-organization exchange. In the United States, image-enabled exchange initiatives align with broader interoperability infrastructure such as TEFCA and USCDI-related discussions. RSNA comments submitted in March 2026 urged stronger incorporation of DICOM and imaging FHIR resources into national interoperability requirements, pushing vendors to invest in standards conformance, identity matching, and governance capabilities across radiology, cardiology, pathology, and other specialties.
Competitive Landscape
The competitive field remains moderately fragmented, with top players such as Siemens Healthineers, GE HealthCare, Agfa HealthCare, Philips, and Canon Medical Systems executing targeted acquisitions to expand AI portfolios. Siemens’ 7.6% imaging revenue jump in Q1 2025 and its “New Ambition” program for 6-8% annual growth underline a strategy to deepen digital offerings. GE HealthCare’s purchase of MIM Software and Intelligent Ultrasound’s AI business extends its multimodality analytics suite.
Cloud-first entrants promote pay-as-you-go pricing and rapid deployment, resonating with ambulatory centers seeking minimal infrastructure overhead. Yet FDA rigor and customer demands for service-level guarantees favor incumbents with broad regulatory and support resources. Vendor-neutral archives have become deal-breakers, placing pressure on proprietary PACS suppliers to open interfaces or risk share erosion.
Intellectual property battles over AI algorithms are intensifying, with companies racing to secure patents for organ-specific detection models. Meanwhile, strategic alliances between modality vendors and AI start-ups accelerate integrated solutions, closing feature gaps and raising switching costs.
Specialty PACS Industry Leaders
-
Siemens Healthineers
-
Fujifilm Holdings Corporation
-
Agfa HealthCare
-
GE Healthcare
-
Sectra AB
- *Disclaimer: Major Players sorted in no particular order
Specialty PACS Market Companies Covered in this Report
- Agfa HealthCare
- Canon
- FUJIFILM
- Merative L.P.
- Mckesson
- Novarad
- Koninklijke Philips
- Sectra
- Siemens Healthineers
- Topcon
- GE Healthcare
- Carestream Health
- Change Healthcare (Optum, Inc.)
- Intelerad Medical Systems
- RamSoft
- Visage Imaging
- Infinitt Healthcare
- Konica Minolta Healthcare
- Cerner Corporation (Orcale Health)
- Hyland Healthcare
- Mach7 Technologies
Market Opportunities and Future Outlook
White space is expanding at the intersection of enterprise imaging consolidation and specialty workflow depth. Health systems replacing departmental silos are seeking modular architectures that combine enterprise-wide archival and security with specialty-tailored reading, reporting, and longitudinal comparison. This approach can reduce vendor lock-in risk while keeping workflows optimized for radiology, cardiology, ophthalmology, and pathology. Large-provider programs provide tangible signals of this procurement shift, including GE HealthCare and Sutter Health announcing a seven-year strategic partnership in January 2025 to integrate imaging clinical workflows, which raises requirements for scalable, interoperable specialty PACS and enterprise imaging platforms.
Another opportunity area is standards-driven interoperability for digital pathology and multi-ology imaging, where adoption is moving from proprietary scanner-viewer stacks toward interoperable integrations. The IHE PaLM Technical Committee published the Digital Pathology Workflow, Image Acquisition (DPIA) Profile in March 2026, defining messaging transactions for digital asset acquisition and supporting more consistent integration of whole slide imaging into enterprise imaging programs. As providers modernize toward cloud and hybrid architectures, vendors that operationalize DICOM, DICOMweb, and FHIR-based exchange, and that embed AI results directly into the clinical viewer and workflow, are positioned to win multi-department rollouts that bundle software with migration and managed services.
Recent Industry Developments in Specialty PACS Market
- June 2026: Sectra announced that Oak Valley Health in Canada selected Sectra One Cloud to consolidate radiology and breast imaging on a single managed platform. The selection supports enterprise standardization and strengthens cybersecurity posture through a cloud-delivered operating model.
- January 2025: GE HealthCare and Sutter Health announced a seven-year strategic partnership focused on integrating imaging clinical workflows and advancing imaging delivery. The agreement elevates demand for scalable, interoperable imaging IT across departments and creates a larger runway for enterprise imaging and specialty PACS modernization.
- November 2024: Konica Minolta Healthcare launched Exa Enterprise, a cloud-based image management solution designed for hospitals and imaging centers. The release reflects ongoing vendor investment in cloud-native platforms aimed at consolidating imaging content across sites and reducing on-premises infrastructure dependency.
Specialty PACS Market Report Scope and Research Methodology
Market Definition and Coverage
This market covers specialty picture archiving and communication systems used to store, manage, and view medical images and related clinical data for a defined specialty workflow in healthcare settings.
Scope exclusions: We exclude general-purpose PACS that are not configured for specialty-specific imaging workflows, along with unrelated hospital IT modules not used for image archiving and viewing.
Segments Covered in This Report
- By Specialty
- Radiology PACS
- Cardiology PACS
- Pathology PACS
- Ophthalmology PACS
- Orthopedic PACS
- Oncology PACS
- Dermatology PACS
- Neurology PACS
- Women’s Health PACS
- Other Specialty PACS
- By Component
- Software
- Services
- Hardware
- By Deployment Model
- On-premise PACS
- Web/Cloud-based Specialty PACS
- Hybrid PACS
- By End User
- Hospitals
- Diagnostic Imaging Centers
- Ambulatory Surgical Centers & Clinics
- Research & Academic Institutes
- Others
- By Geography
- North America
- United States
- Canada
- Mexico
- Europe
- Germany
- United Kingdom
- France
- Italy
- Spain
- Rest of Europe
- Asia-Pacific
- China
- Japan
- India
- Australia
- South Korea
- Rest of Asia-Pacific
- Middle East and Africa
- GCC
- South Africa
- Rest of Middle East and Africa
- South America
- Brazil
- Argentina
- Rest of South America
- North America
Data Sources, Market Sizing, and Validation
Desk Research
Desk research was used to set the starting structure for the market and to establish realistic bounds for demand and pricing. We relied on non-paywalled sources such as the US FDA device and software listings where applicable, the US National Library of Medicine for clinical imaging literature, OECD and World Bank health expenditure series, and CDC health care utilization statistics as directional indicators, along with select national health ministry releases for digitization initiatives.
To connect these indicators to revenue, we also reviewed company annual reports, investor presentations, press releases, and guidance from regulatory or standards bodies that influences imaging storage, cybersecurity, and interoperability requirements. We used paid subscriptions for company financials and news intelligence, plus patent databases, to confirm product activity and investment intensity in specialty imaging software. These sources are illustrative, and we also used other public and proprietary references for data collection, cross-checking, and clarification.
Primary Interviews and Surveys
Primary discussions were completed with a mix of specialty imaging software providers, healthcare IT integrators, and end users such as hospitals and diagnostic imaging centers, so that adoption patterns could be checked against on-the-ground deployment practices. Coverage was balanced across Americas, EMEA, and APAC because installation cycles, cloud acceptance, and budget priorities can differ by region, and these differences feed into the final size assumptions.
Distribution of primary research fieldwork respondents
| Company type | Respondent position | Region |
|---|---|---|
| Top tier: 30% | CXOs: 19% | APAC: 48% |
| Mid tier: 49% | Functional/Unit leaders: 34% | EMEA: 30% |
| Smaller Players: 21% | Managers: 47% | Americas: 22% |
Market-Sizing & Forecasting
The core model uses a top-down build where imaging digitization signals and healthcare delivery capacity are converted into an addressable pool for specialty image storage and viewing, and then filtered through adoption and deployment patterns. To keep the result grounded, the totals are corroborated using selective bottom-up approximations such as sampled average selling price ranges, channel checks with integrators, and a limited roll-up of specialist solution revenues where disclosure is available.
Inputs used in the model include imaging procedure volumes and modality mix, hospital and diagnostic center counts, cloud versus on-premise deployment share, average contract duration with renewal behavior, and expected software and services price progression tied to storage needs and compliance requirements. Where bottom-up information is missing for smaller countries, we applied proxy ratios based on comparable health spending and imaging intensity, and then adjusted using interview feedback.
Forecasting was done using scenario analysis supported by trend lines in procedure growth and IT spending, followed by an exponential smoothing step for near-term adoption changes where purchasing cycles create short-term volatility. Assumptions were revisited until the forecast direction matched what respondents described for specialty workflow upgrades and cloud migration timing.
Data Validation & Update Cycle
Validation is done through multiple checks so the model stays aligned with real buying behavior. We compare outputs with independent signals such as health IT budget growth, imaging utilization trends, and the pace of cloud transition reported by providers and end users. Any anomalies are reviewed and corrected before sign-off.
A second analyst review is completed to check calculations, year-to-year jumps, and any outlier pricing or penetration assumptions. The report is refreshed annually, and interim updates are triggered when material events occur such as major regulation shifts, reimbursement changes that affect imaging demand, or notable technology shifts in enterprise imaging. Before delivery, a final pass is completed so clients receive the most up-to-date view available at that time.
Mordor Intelligence's Specialty Pacs Market Estimate Compared With Other Published Estimates
Published market sizes for specialty PACS can look far apart, even when they are tracking the same broad adoption story. The differences usually come from what is counted as specialty PACS revenue, how cloud subscriptions and services are treated, and what year and currency conversion timing is used.
The benchmark table shows a lower 2025 value versus some other publications, and in the Mordor Intelligence model the count stays within specialty-focused PACS software and associated services and hardware, instead of combining adjacent enterprise imaging, broader PACS bundles, or other hospital IT modules. Differences also show up when one estimate uses an aggressive cloud migration curve, or when prices are projected forward without checking renewal discounts and multi-year contract structures through interviews.
Benchmark comparison
| Source | Market Size | Gaps in Research Methodology |
|---|---|---|
| Mordor Intelligence | USD 2.77 B (2025) | |
| Global Research Publisher A | USD 3.94 B (2025) | Uses a wider revenue basket that can include enterprise imaging elements and broader specialty definitions, which can lift the 2025 total even if end-user counts are similar. |
| Industry Report Publisher B | USD 3.34 B (2025) | Leans on a faster near-term growth path and a different treatment of deployment pricing, where subscription uplift and services attachment are applied more uniformly across regions. |
Taken together, the spread is mainly explained by scope and pricing logic rather than a disagreement on demand direction. Our approach stays traceable to observable healthcare capacity and imaging activity, and it is then pressure-tested through interviews so the final number is repeatable and easy to audit year over year.
Key Questions Answered in the Report
What is driving the rapid growth of the Specialty PACS market?
Widespread cloud migration, AI-ready architectures, and rising imaging volumes are accelerating adoption, pushing the global market toward USD 4.07 billion by 2031 at a 6.64% CAGR.
Which specialty segment is expanding the fastest?
Ophthalmology PACS is projected to grow at an 7.28% CAGR, buoyed by AI-enabled diabetic retinopathy and macular degeneration screening programs.
Why are services outpacing software in growth?
Hospitals prefer managed cloud services that reduce IT staffing needs and provide continuous AI model updates, resulting in an 8.18% CAGR for services compared with software’s slower trajectory.
How significant is cloud deployment in this industry?
Web/cloud platforms already command 56.90% of market share and are forecast for a 8.86% CAGR, reflecting provider appetite for scalable, secure, and remotely accessible imaging solutions.
What regions offer the highest growth potential?
Asia-Pacific leads with a projected 9.15% CAGR through 2031, driven by large-scale government digital-health investments and rising private-sector funding.