
Specialty Injectable Generics Market Size and Share
Market Overview
| Study Period | 2020 - 2031 |
|---|---|
| Forecast Data Period | 2026 - 2031 |
| Historical Data Period | 2020 - 2024 |
| Growth Rate | 10.04 % |
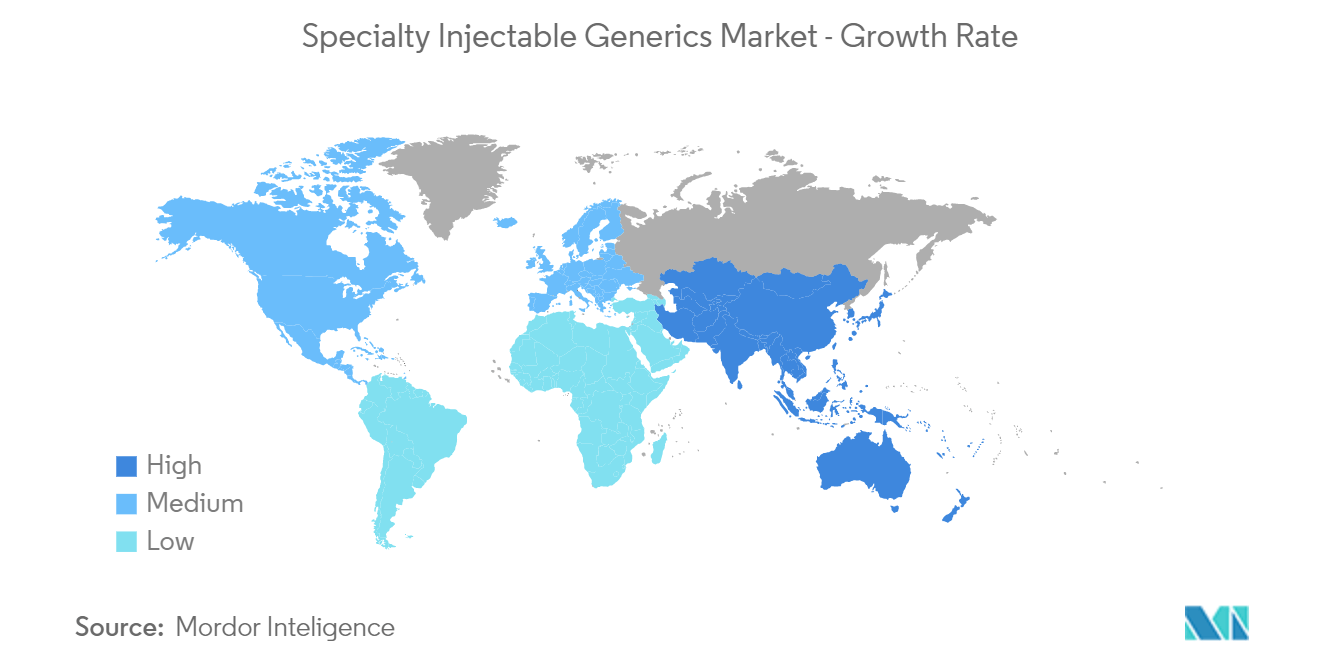
| Fastest Growing Market | Asia-Pacific |
| Largest Market | North America |
| Market Concentration | Medium |
Major Players *Disclaimer: Major Players sorted in no particular order Image © Mordor Intelligence. Reuse requires attribution under CC BY 4.0. | |
Specialty Injectable Generics Market Analysis by Mordor Intelligence
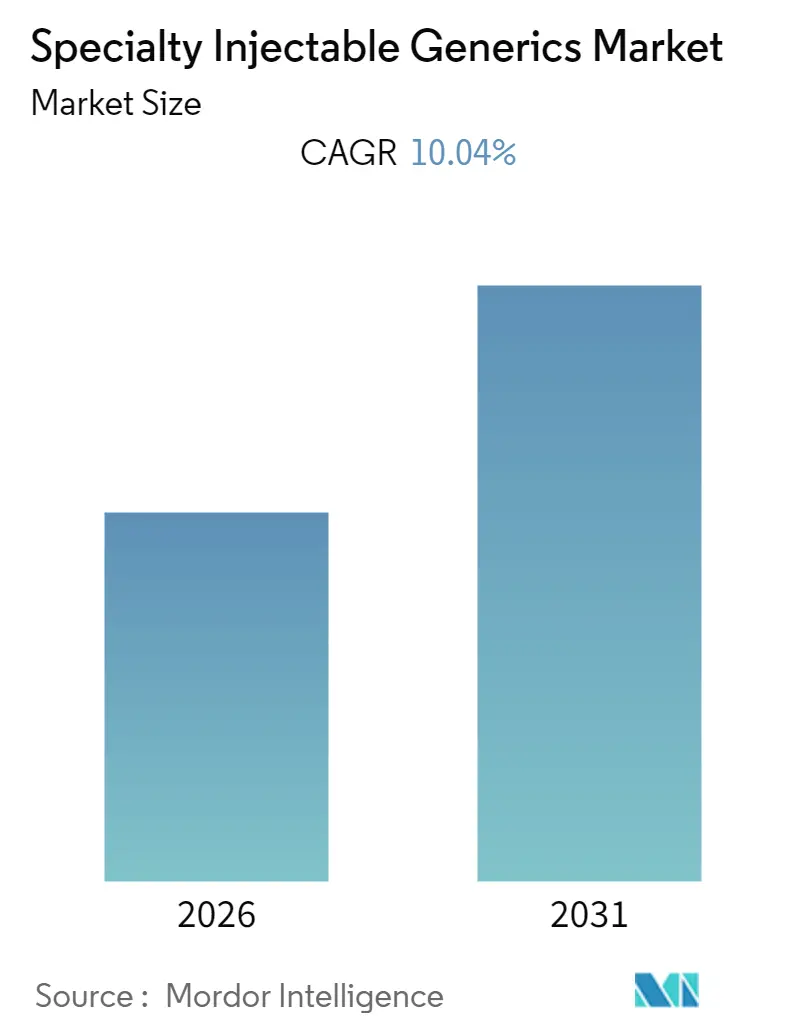
The Specialty Injectable Generics Market size is expected to register a CAGR of 10.04% during the forecast period (2026-2031).
The COVID-19 pandemic disrupted the research and development of other therapies and drugs for medical conditions other than COVID-19. This also impacted the studied market of the specialty injectable generic market around the world. For instance, as per the research study published in April 2020, titled, 'The Consequence of COVID-19 on the Global Supply of Medical Products: Why Indian Generics Matter for the World?', India is the largest manufacturer of generic drugs and Indian firms import almost 70% of their bulk drugs from China, where the production of active pharmaceutical ingredients (APIs) and supply chain logistics have taken a big hit due to the COVID-19 pandemic. Potential shortages as a result of export bans in India and China, which are major suppliers of generics, have prompted governments in many countries to consider supply chain self-sufficiency and to issue regulations to prevent shortages in such a crisis. Hence, the COVID-19 pandemic is likely to have a negative impact on the market. However, the market will grow in the upcoming period.
Factors such as the rising prevalence of diseases and the increasing number of patent expirations are expected to increase the market share. In recent times, the burden of chronic diseases, such as cancer, cardiovascular diseases, and arthritis, among others, has increased significantly, which has led to a serious burden on the healthcare expenditure of people.
Specialty injectable generic drugs are not only effective but also cheaper as compared to conventional medicines, and that's why they are gaining popularity among people suffering from chronic diseases, thus, driving growth in the market. According to the article titled' The Patterns of Non-Communicable Disease Multimorbidity in Iran: A Multilevela Analysis' published in February 2020 Non-Communicable Disease multimorbidity affects more young people in low-middle income countries. the mean prevalence was 7.8% in 28 developing countries. Thus, the demand for specialty injectable generic drugs is expected to increase over the period in low- and middle-income countries as NCDs are more prevalent in these countries, and they cannot afford costly drugs, but specialty injectable generic drugs are cheap, and that's why its consumption is expected to increase over the forecast period, and the market is expected to grow.
According to the Patented Medicine Prices Review Board report 2020, the average price of generic medicines in Canada has dropped substantially by 60% relative to price levels. The decrease in prices is one of the key factors for the growth of the market, as low-price medicines are most accessible to the end-users. Due to lower costs, specialty injectable generic medicines are likely to be preferred, which would increase the growth of the market. Additionally, In August 2020, the regulatory agency in Mexico (COFEPRIS) put forward new operating rules for the approval of generic drugs in Mexico, based on the following guidelines: COFEPRIS will have a special procedures window for the generic pharmaceutical products. These applications for approvals of generics could be filed the day after the granting of the patent related to the innovative medicine. The respective applications would be decided at any time prior to the expiration of the patent. If the registration or approval is given, COFEPRIS will provide a provisional official communication, which would be exchanged for the definitive sanitary registration or approval, the day after the expiration of the validity of the patent.
Furthermore, the launch of injectable generic drugs is anticipated to drive the segment growth over the forecast period. For instance, in October 2021, Adalvo completed a mandatory requirement for marketing authorization in the European Union for its generic version of Firazyr (icatibant injection), which is approved for acute attacks in adults with hereditary angioedema (HAE). This is anticipated to increase the demand for generic injectables in the upcoming future. Hence, the abovementioned factors are likely to increase market growth in the upcoming future.
However, the complex development process of specialty generics is likely to hinder the market growth.
Note: Market size and forecast figures in this report are generated using Mordor Intelligence’s proprietary estimation framework, updated with the latest available data and insights as of 2026.
Global Specialty Injectable Generics Market Trends and Insights
Oncology is Expected to Hold a Significant Market Share Over the Forecast Period
The factors proliferating the growth of the oncology segment are the growing burden of cancer worldwide, the increasing need for effective therapeutic drugs to treat cancer as well as increasing focus of pharmaceutical companies on developing effective drugs.
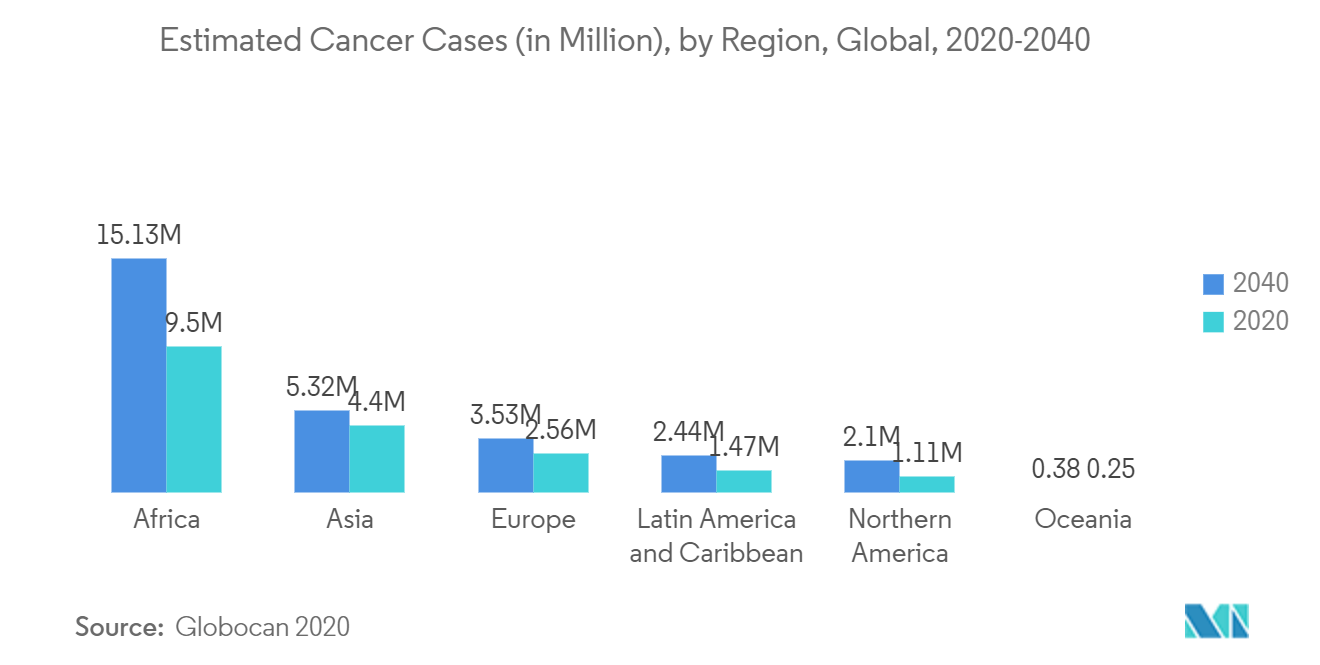
As per the GLOBOCAN 2020, in 2020, there were 19.3 million estimated new cancer cases worldwide, and the number is estimated to reach 30.2 million by the year 2040. Thus, the anticipated increase in the burden of cancer is a major factor contributing to the rising demand for generic drugs, thereby boosting the market growth. Also, as per th article titled, 'Generic Anticancer Drugs of the Jan Aushadhi Scheme in India and Their Branded Counterparts: The First Cost Comparison Study,' published in November 2021 replacing generic anticancer drugs can result in substantial cost savings and benefit the patient requiring curative chemotherapy for breast cancer. Thus, there is a high demand for generic anticancer drugs and will continue to remain high in the coming period as well.
Product launches are another factor in the growth of the market. For instance, in August 2020, Xiromed LLC launched Irinotecan Injection USP, 20mg/mL is a generic equivalent to Camptosar and is available in a 2mL and 5mL single-dose vial. Camptosar is a medication used to treat colon cancer and small cell lung cancer.
Thus, the aforementioned factors are likely to drive the growth of the segment during the forecast period.
North America is Expected to Dominate the Market Over the Forecast Period
The North American specialty injectable generics market is expected to grow over the forecast period owing to the high burden of chronic diseases in the country coupled with the rising geriatric population and new product launches by the key market players in the country. For instance, as per the National Center for Chronic Disease Prevention(CDC) and Health Promotion (January 2021), 6 in 10 adults in the United States have a chronic disease, and 4 in 10 adults have two or more chronic diseases, and these conditions are posing around USD 3.8 trillion of healthcare costs on the country's healthcare system every year and as generic drugs are a lot cheaper than other prescribed drugs. Hence, the healthcare expenditure can be significantly reduced by the wide adoption of generic drugs in the country, and that is expected to have a significant impact on the growth of the studied market.
According to the research published in August 2020 by the Pharmaceuticals Export Promotion Council of India titled "Mexico Pharma Market & Regulatory Report," stated that as one of the largest consumers of generic medicines in the world, Mexico maintains a significant presence of generic drug manufacturers, including Israel-based Teva, United States-based Mylan, Ireland-based Perrigo and Genomma Lab, a domestic company. In upcoming years, the growing consumer demand for more affordable medicines will contribute to the country's increasing rates of specialty injectable generics consumption.
Product launches are another factor in the growth of the market. For instance, in January 2021, Sandoz, a global leader in generic and biosimilar medicines, launched a generic Icatibant injection pre-filled syringe to treat acute attacks of rare disease hereditary angioedema (HAE) in adults 18 years and older in the United States.
Hence, the abovementioned factors are likely to increase market growth in the coming future.
Competitive Landscape
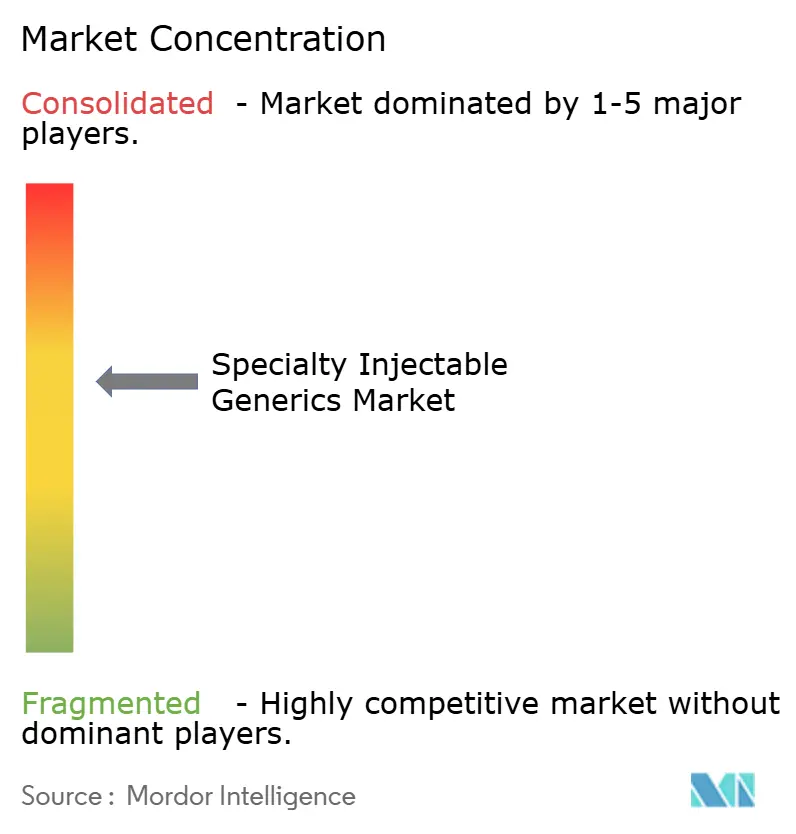
Most of the players are based in developing counties due to more technological advancements. But due to the ease of connectivity in modern times, these players have also penetrated developing countries and are trying to establish a market in these countries as well. The market is partially fragmented and consists of several major players. Some of the companies which are currently dominating the market are Pfizer Inc., Fresenius Kabi, Teva Pharmaceuticals, Hikma Pharmaceuticals PLC, and Novartis AG, among others.
Specialty Injectable Generics Industry Leaders
-
Fresenius Kabi
-
Novartis AG
-
Pfizer Inc
-
Teva Pharmaceuticals
-
Hikma Pharmaceuticals PLC
- *Disclaimer: Major Players sorted in no particular order
Market Opportunities and Future Outlook
Supply reliability and traceability are opening space for manufacturers that can keep producing compliant sterile injectable volumes at scale. In the United States, FDA actions to strengthen domestic drug manufacturing, including the PreCheck Pilot Program (with selected participants including Amneal, Eli Lilly, Regeneron, Cellares, Fujifilm Biotechnologies, and Kriya), point to earlier regulator engagement during facility design and build-out, which is relevant to sterile injectable capacity and complex generics execution.
Shortage dynamics and supply-chain concentration continue to raise the value of resilient sourcing and redundant manufacturing for essential sterile injectables (including oncology and anti-infectives). At the same time, enforcement of DSCSA interoperability in 2025 lifts the operational bar for end-to-end electronic traceability, supporting opportunities for players that can integrate serialization, work through hospital and wholesaler channels, and document upstream API and key starting material sources. Policy discussions in the United States on incentives tied to manufacturing quality and price stability for essential generics also reinforce a move toward quality-led, sustainable participation, rather than competing only on lowest price in highly competitive injectable categories.
Recent Industry Developments
- April 2026: Novartis finalized plans for its seventh new US facility, an API manufacturing site in Morrisville, North Carolina, under its broader USD 23 billion US manufacturing and R&D expansion program. The added domestic API footprint supports end-to-end supply strategies and raises competitive standards for localized sourcing in injectable and other specialty medicine supply chains.
- July 2025: Pfizer highlighted manufacturing resiliency priorities across its sterile injectables and hospital-focused supply network, emphasizing measures aimed at improving continuity of supply. The renewed focus on resilient sterile manufacturing underscores ongoing investment and operational tightening in areas that are directly affected by shortages and stringent quality requirements.
- December 2024: Fresenius Kabi launched Epinephrine Injection, USP in the United States, expanding its US pharmaceutical portfolio in an emergency medicine staple product. Broader availability of a generic epinephrine presentation supports competitive supply for high-usage hospital products and aligns with customer demand for more dependable access to essential injectables.
Research Methodology Framework and Report Scope
Market Definition and Coverage
This market covers the sales value of specialty injectable generic medicines administered through injections or infusions, used in complex or high-acuity therapy areas across major healthcare settings. We track this at the manufacturer selling price level and normalize to USD for cross-market comparison.
Scope exclusions: We exclude branded originator injectables, non-injectable generics, and hospital service revenues that sit outside the drug product value.
Segmentation Overview
- By Type
- Drugs
- Biologics
- By Application
- Oncology
- Cardiovascular
- Infectious Diseases
- Central Nervous Systems
- Autoimmune Disorders
- Others
- Geography
- North America
- United States
- Canada
- Mexico
- Europe
- Germany
- United Kingdom
- France
- Italy
- Spain
- Rest of Europe
- Asia-Pacific
- China
- Japan
- India
- Australia
- South Korea
- Rest of Asia-Pacific
- Middle-East and Africa
- GCC
- South Africa
- Rest of Middle East & Africa
- South America
- Brazil
- Argentina
- Rest of South America
- North America
Data Sources, Market Sizing, and Validation
Desk Research
Desk work starts by defining the therapy areas and how injectable medicines are used in those settings, then mapping where generic entry is likely and where it is blocked by patents, biologic complexity, or regulatory constraints. For approvals and regulatory context, we use public sources such as FDA drug databases and approval pathways, the FDA Orange Book where relevant, EMA public assessment reports, and WHO and OECD health statistics to capture demand-side signals like treatment volumes and healthcare spend.
To keep the supply view grounded, we also review company annual reports and filings, investor presentations, and reputable press for launches, shortages, and manufacturing changes, since these can shift both volumes and pricing quickly in injectables. Patent databases are used to validate loss-of-exclusivity timing and to avoid overcounting molecules that are still protected. For cross-checks on trade exposure and regional availability, we use import-export statistics and shipment-level trade datasets selectively, where movements of injectable product are a meaningful indicator. The source list above is illustrative only, and additional public sources were also reviewed for data collection, validation, and clarification.
Primary Interviews and Surveys
Primary work is used to stress test where desk sources cannot show the true operating details, especially generic uptake speed after launch, channel mix across hospitals and specialty clinics, and real-world pricing steps after tenders or shortages. We interview manufacturers, contract manufacturers, distributors, group purchasing stakeholders, hospital pharmacists, and therapy-area clinicians across the major regions so the assumptions can be adjusted to match how products are actually used and procured.
Distribution of primary research fieldwork respondents
| Company type | Respondent position | Region |
|---|---|---|
| Top tier: 29% | CXOs: 14% | APAC: 53% |
| Mid tier: 55% | Functional/Unit leaders: 28% | EMEA: 29% |
| Smaller Players: 16% | Managers: 58% | Americas: 18% |
Market-Sizing & Forecasting
Sizing is built using a top-down approach where treated patient pools and procedure volumes are reconstructed by key therapy areas, then filtered through injectable utilization rates and generic penetration to arrive at an addressable value by region. After forming the demand pool, we apply price ladders that reflect how injectable contracting typically works, including post-launch price steps and mix shifts across vial, prefilled, and other common formats.
To keep the model realistic, we corroborate results with selective bottom-up approximations, such as rolling up a sampled set of molecule-level volumes, checking supplier capacity signals, and using channel checks on average selling prices in hospital-heavy categories. Inputs that matter most include patent expiry and launch timing, tender intensity in public systems, shortage frequency and duration, oncology and autoimmune treatment volumes, and the split between small-molecule injectables and complex biologics where substitution rules differ.
Forecasts are produced using scenario analysis, since pricing and availability can change quickly with a new generic entrant or a plant disruption. In each scenario, uptake curves and price erosion assumptions are set from expert feedback and then stress tested against historical analogs in comparable injectable categories. Where bottom-up visibility is thin for specific molecules or countries, gaps are handled by applying region-specific penetration and pricing bands anchored to observed procurement patterns, then reviewed again in interviews.
Data Validation & Update Cycle
Validation is done by triangulating the final totals against independent signals, such as therapy-level demand growth, regulatory approval cadence for injectable generics, and visible supply events like recalls and shortage notices. Outliers are flagged when regional growth does not align with known tender resets, loss-of-exclusivity timing, or changes in biologic substitution policies, and then the assumptions are revisited.
Before sign-off, the model is reviewed in steps. We start with internal analyst checks on units, conversion rates, and pricing logic, followed by a second review focused on regional consistency and segment add-ups. The report is refreshed annually, and interim updates are triggered when material events occur, such as a major launch wave, a persistent shortage cycle, or a policy change that shifts generic uptake. Right before delivery, we run a final pass to ensure the newest public updates and the latest interview learnings are reflected.
Mordor Intelligence's Specialty Injectable Generics Market Estimate Compared With Other Published Estimates
Different published market sizes can vary even when they use similar wording, because boundaries around what counts as specialty, which injectables are included, and how pricing is treated across hospital tenders are not always consistent. Timing can also drive differences, since a single launch, shortage, or recall can shift a given year's value in a visible way.
By tracking molecule-level loss-of-exclusivity timing, tender-driven price steps, and shortage-led volume swings, Mordor Intelligence keeps the specialty injectable generics total tied to a repeatable demand pool rather than broad injectable spending totals. The biggest gaps usually come from whether complex biologics are treated as full substitutes, whether hospital service revenue is blended into the drug value, and whether aggressive penetration is applied immediately after approval instead of using a staged uptake curve.
Benchmark comparison
| Source | Market Size | Gaps in Research Methodology |
|---|---|---|
| Mordor Intelligence | USD 4.75 B (2026) | |
| Trade Journal A | USD 4.88 B (2025) | Uses a different base year and appears to blend a broader specialty injectable basket, where some non-generic specialty injectables and adjacent delivery formats can be mixed into the total. |
| Industry Publisher B | USD 21.25 B (2031) | Reported as a long-range endpoint value with limited visibility on uptake and price erosion steps, which can overstate near-term value when penetration is assumed to rise smoothly across regions. |
The spread in the table is mainly explained by year alignment and what gets counted inside the specialty injectable label, particularly around complex products and pricing behavior in hospital procurement. When the same demand pool, uptake curve, and price-step logic are applied consistently by region, the resulting market size is easier to reconcile and to reuse for planning across launch timing and supply scenarios.
Key Questions Answered in the Report
What is the current Global Specialty Injectable Generics Market size?
The Global Specialty Injectable Generics Market is projected to register a CAGR of 10.04% during the forecast period (2026-2031)
Who are the key players in Global Specialty Injectable Generics Market?
Fresenius Kabi, Novartis AG, Pfizer Inc, Teva Pharmaceuticals and Hikma Pharmaceuticals PLC are the major companies operating in the Global Specialty Injectable Generics Market.
Which is the fastest growing region in Global Specialty Injectable Generics Market?
Asia-Pacific is estimated to grow at the highest CAGR over the forecast period (2026-2031).
Which region has the biggest share in Global Specialty Injectable Generics Market?
In 2025, the North America accounts for the largest market share in Global Specialty Injectable Generics Market.
What years does this Global Specialty Injectable Generics Market cover?
The report covers the Global Specialty Injectable Generics Market historical market size for years: 2019, 2020, 2021, 2022, 2023 and 2024. The report also forecasts the Global Specialty Injectable Generics Market size for years: 2026, 2027, 2028, 2029, 2030 and 2031.