
Specialty Gas Market Size and Share
Market Overview
| Study Period | 2020 - 2031 |
|---|---|
| Market Size (2026) | USD 15.65 Million |
| Market Size (2031) | USD 19.91 Million |
| Growth Rate (2026 - 2031) | 4.92 % |
| Fastest Growing Market | Asia Pacific |
| Largest Market | Asia Pacific |
| Market Concentration | High |
Major Players *Disclaimer: Major Players sorted in no particular order Image © Mordor Intelligence. Reuse requires attribution under CC BY 4.0. | |
Specialty Gas Market Analysis by Mordor Intelligence
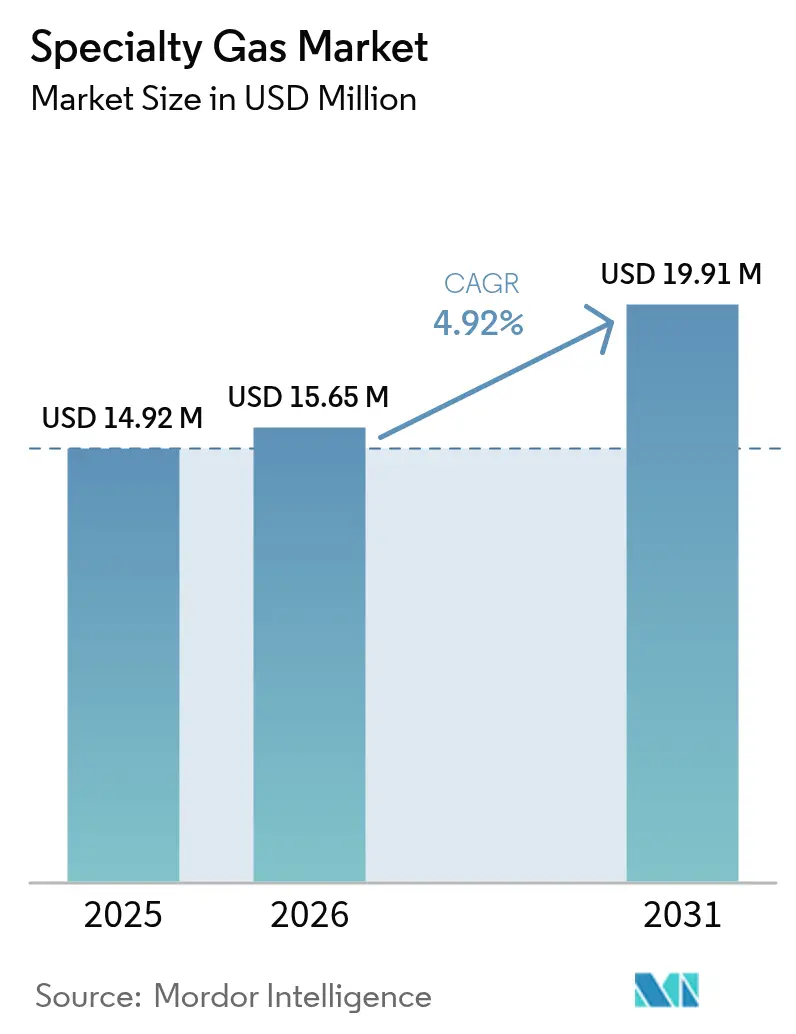
The Specialty Gas Market size in 2026 is estimated at USD 15.65 million, growing from 2025 value of USD 14.92 million with 2031 projections showing USD 19.91 million, growing at 4.92% CAGR over 2026-2031. Demand acceleration stems from soaring semiconductor fabrication, fast-growing medical-grade usage, and a surge of green hydrogen pilots that depend on calibration mixtures. Semiconductor process nodes below 5 nm require ultra-high-purity gas grades, prompting sustained investment in purification technology and on-site supply systems. Parallel momentum comes from petrochemical and solar power projects that adopt specialty gases for process optimization and emissions control. Environmental mandates are tightening production standards, yet producers are countering with low-carbon formulations and high-efficiency separation units, ensuring steady output while curbing greenhouse gases. Competitive dynamics remain moderately concentrated as global majors expand capacity, acquire regional distributors, and introduce digitally enabled traceability services to secure long-term contracts with chipmakers, refiners, and hospitals.
Key Report Takeaways
- By type, high-purity gases led with 37.79% revenue share in 2025; electronic and process gases are projected to expand at a 5.48% CAGR through 2031.
- By end-user industry, the electronics & semiconductor segment commanded 35.88% of the specialty gas market share in 2025, while healthcare is set to grow at a 6.22% CAGR to 2031.
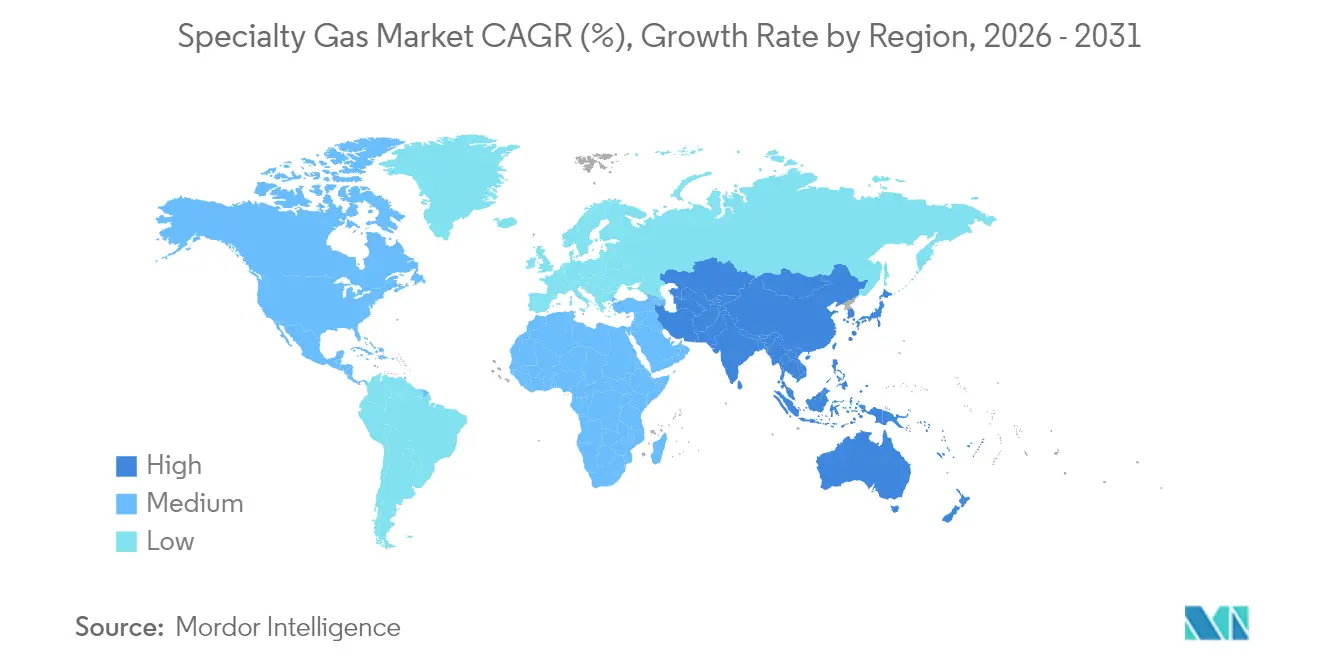
- By geography, Asia-Pacific captured 47.85% of the specialty gas market size in 2025 and is forecast to post the fastest regional CAGR of 6.55% between 2026-2031.
Note: Market size and forecast figures in this report are generated using Mordor Intelligence’s proprietary estimation framework, updated with the latest available data and insights as of 2026.
Market Trends and Insights
Drivers Impact Analysis of Specialty Gas Market*
| Driver | (~) % Impact on CAGR Forecast | Geographic Relevance | Impact Timeline |
|---|---|---|---|
| Semiconductor-grade Wafer Fabrication Boom Creating Demand for Specialty Gas | +1.20% | Asia-Pacific, North America | Medium term (2-4 years) |
| Increasing Utilization for Specialty Gased from Petrochemcial Industry | +0.80% | Middle East, Asia-Pacific, North America | Medium term (2-4 years) |
| Rapid Expansion of Green Hydrogen Pilots Requiring Calibration Gases | +0.70% | Europe, North America | Long term (≥ 4 years) |
| Increasing Demand from the Healthcare Sector | +1.10% | Global, led by North America and Europe | Medium term (2-4 years) |
| Increasing Usage in the Solar Power Sector for Energy Absorption and Operational Efficiency | +0.90% | Asia-Pacific, North America, Europe | Medium term (2-4 years) |
| Source: Mordor Intelligence | |||
Semiconductor-grade wafer fabrication boom creating demand for specialty gas
Unprecedented chip-fabrication investment is elevating consumption of ultra-high-purity nitrogen, argon, and fluorinated compounds. Plants now specify 6 N purity (99.9999%) for chemical vapor deposition, etching, and ion implantation, as shown by Linde’s SPECTRA plants that supply Samsung’s Pyeongtaek campus. The U.S. CHIPS and Science Act has catalyzed USD 450 billion in private spending across 90 projects, expected to triple national wafer output by 2032[1]Semiconductor Industry Association, “2024 State of the U.S. Semiconductor Industry,” semiconductors.org . Asia-Pacific fabs in Taiwan, South Korea, and mainland China are also scaling, fueling long-term contracts with global gas suppliers. These dynamics underpin a robust pipeline of purification skids, micro-bulk tanks, and electronic-grade fill plants. The specialty gas market therefore benefits from predictable volume off-take and premium pricing tied to purity guarantees.
Increasing utilization for specialty gases from petrochemical industry
Hydrogen, carbon monoxide, and bespoke hydrocarbon blends remain critical for hydrotreating, cracking, and catalyst regeneration within petrochemical complexes. Operators in the Middle East and Texas Gulf Coast are connecting to Air Products’ hydrogen pipelines that exceed 1,600 km in length. Real-time gas analytics enhance product yields while reducing flaring, driving procurement of calibration mixes and high-purity oxygen for oxidative processes. Refineries shifting toward low-sulfur fuels intensify consumption further. As a result, the specialty gas market sees stable base-load volumes and rising demand for turnkey supply schemes that bundle gas, equipment, and process control software.
Rapid expansion of green hydrogen pilots requiring calibration gases
Europe’s decarbonization roadmap doubles electrolyzer capacity to 10 GW by 2030, mandating rigorous quality checks for hydrogen purity and oxygen removal. Germany, the Netherlands, and Denmark are rolling out 1,800 km of hydrogen pipelines by 2028, each compressor station needing certified H₂, O₂, and N₂ standards. Australia’s Port Kembla project illustrates the trend with Asia-Pacific’s first heavy-transport hydrogen refueling hub, supplied by Coregas mixes. These pilots propel orders for specialty gas cylinders, mass-flow controllers, and portable analyzers, supporting the specialty gas market’s long-term CAGR.
Increasing demand from the healthcare sector
Hospitals and biotechnology labs rely on medical-grade oxygen, nitrogen, and carbon dioxide for respiratory care, cryopreservation, and drug formulation. The U.S. Defense Health Program allocates USD 40.27 billion in FY 2025 for healthcare services and modernization, encouraging upgrades to on-site gas plants and distribution networks[2]U.S. Department of Defense, “Defense Health Program Fiscal Year 2025 Budget,” comptroller.defense.gov . New therapeutic modalities—including cell and gene therapy—require stringent atmospheric controls, raising consumption of inert gases. Growth in elective surgeries post-pandemic is another booster, ensuring that healthcare remains the fastest-advancing end-use segment within the specialty gas market.
Restraints Impact Analysis of Specialty Gas Market*
| Restraint | (~) % Impact on CAGR Forecast | Geographic Relevance | Impact Timeline |
|---|---|---|---|
| Stringent Environmental Regulations and Restrictions on Specialty Gas Production and Quality Control | -0.90% | Europe, North America | Medium term (2-4 years) |
| Supply Chain Concerns Impacting Utilization in Certain Geographies | -0.70% | Asia-Pacific, Europe | Short term (≤ 2 years) |
| High Production and Purification Cost for Certain Gases | -0.60% | Global | Medium term (2-4 years) |
| Source: Mordor Intelligence | |||
Stringent environmental regulations and restrictions on specialty gas production and quality control
The AIM Act compels an 85% phase-down of HFC consumption by 2036, prompting reformulation of specialty refrigerant blends and investment in abatement systems[3]Environmental Protection Agency, “Fiscal Year 2025 Congressional Justification,” epa.gov . Methane emitters in the U.S. oil and gas sector face a Waste Emissions Charge of USD 900 per ton in 2024, rising to USD 1,500 by 2026[4]Federal Register, “Waste Emissions Charge for Petroleum and Natural Gas Systems,” federalregister.gov . European plants operate under the Industrial Emissions Directive and carbon pricing, which elevate compliance costs. Although these rules drive innovation in low-GWP gases, they can slow capacity additions and tighten short-term supply, putting minor downward pressure on the specialty gas market’s growth rate.
Supply chain vulnerabilities impacting utilization in certain geographies
Extreme concentration of electronic-grade gas production in East Asia exposes fabs elsewhere to shipping delays, geopolitical risks, and container shortages. The Asia Pacific Electronic Specialty Gas Conference stressed that Southeast Asian clusters must strengthen redundancy in filtration media and specialty cylinder supply. US importers continue to diversify suppliers to comply with any future trade restrictions, while European buyers pursue stockpile strategies. Until new regional distillation columns come online, intermittent shortages of neon, xenon, and helium may hamper downstream production and temper the specialty gas market’s growth.
*Our forecasts treat driver/restraint impacts as directional, not additive. The impact forecasts reflect baseline growth, mix effects, and variable interactions.
Specialty Gas Market Segment Analysis
By Type:
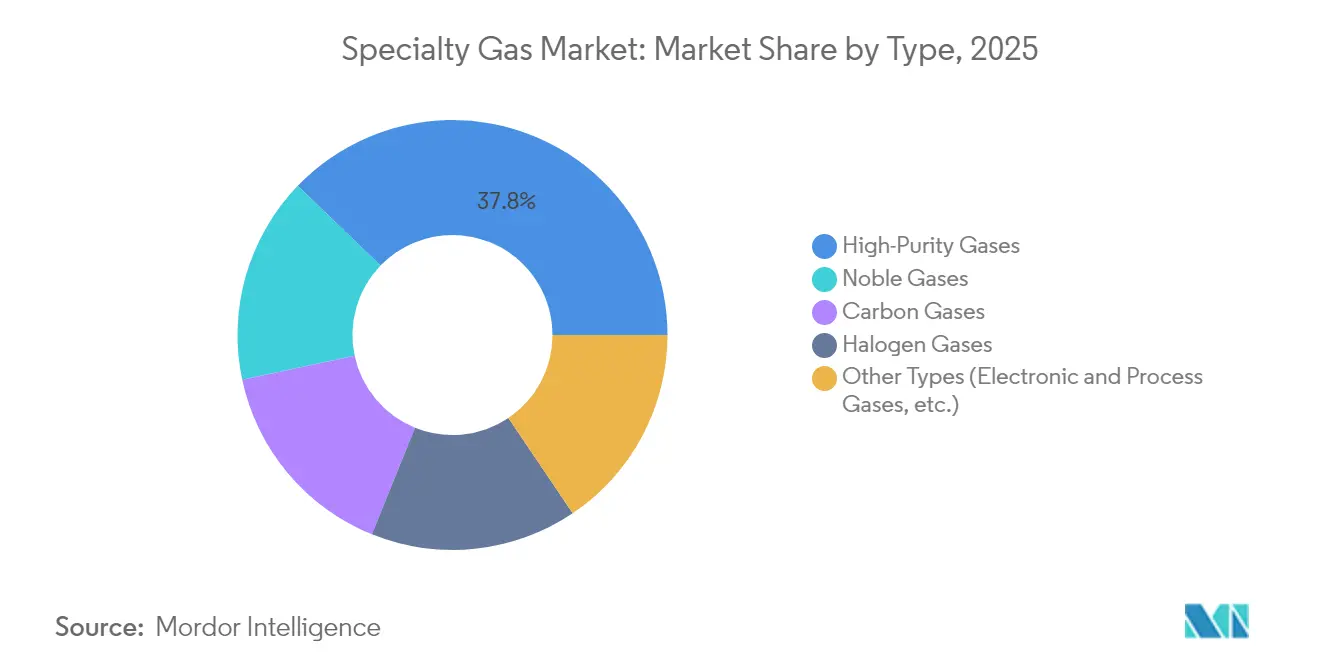
High-purity gases underpin semiconductor performanceHigh-purity gases accounted for a 37.79% revenue share in 2025 as fabs tightened impurity specifications to parts-per-trillion levels. UBE’s 30% capacity increase for high-purity nitric acid at its Ube facility underlines sustained semiconductor demand. Noble gases face sporadic supply disruptions following geopolitical tensions and maintenance outages at liquefaction plants, but targeted investments in recovery and liquefier upgrades are stabilizing availability. Electronic and process gases make up the fastest-growing sub-segment at 5.48% CAGR, benefiting from advanced etch chemistries needed in 3-D NAND and gate-all-around transistors.
Ultra-high-purity (UHP) hydrogen and fluorinated compounds support aggressively scaled EUV lithography lines that cannot tolerate metallic or moisture contamination beyond single-digit ppt thresholds. Meanwhile, demand for carbon-based specialty gases—including high-purity carbon monoxide for OLED precursor synthesis—remains strong across fine-chemical and display manufacturing. These diverse use cases reinforce the specialty gas market’s resilience to short-cycle swings in any one sector.


By End-User Industry:
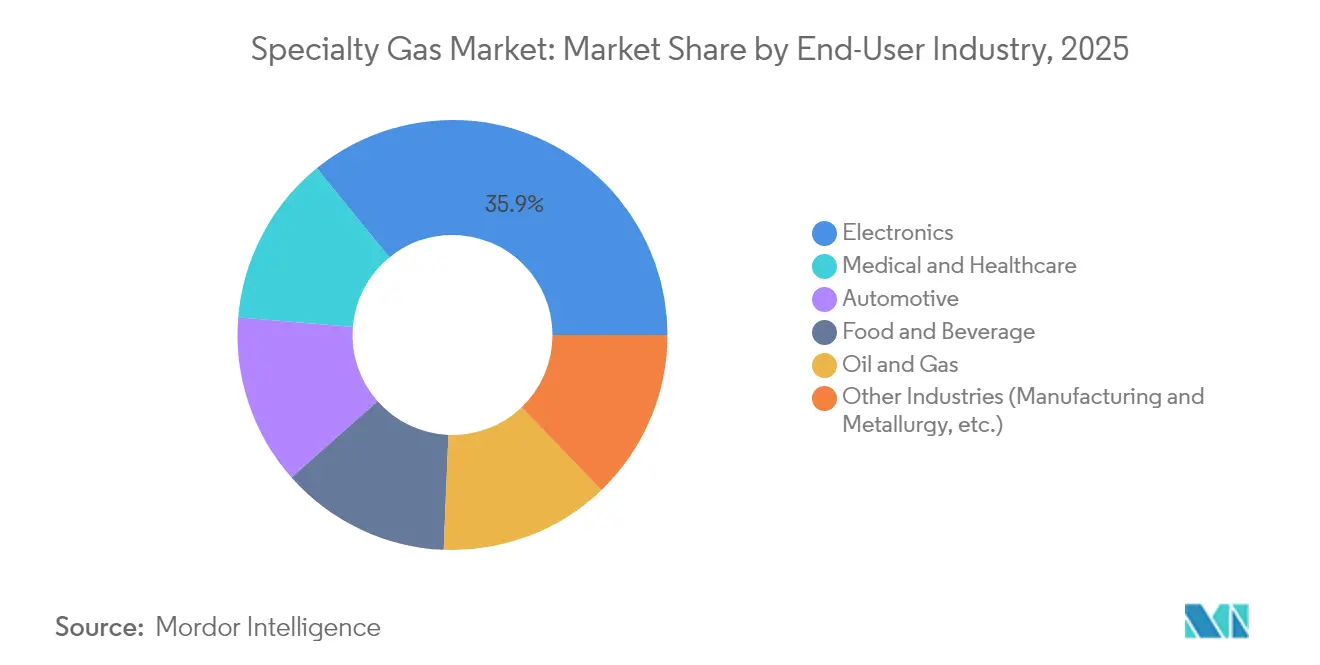
Electronics sector secures structural leadThe electronics & semiconductor domain captured 35.88% of 2025 revenue, driven by wafer-fab expansions in Asia and reshorings in the United States. The specialty gas market share for this segment is projected to hold steady while volumes grow, with penetration deepening as pattern densities shrink. Healthcare applications, advancing at a 6.22% CAGR, increasingly rely on nitrous oxide substitutes, hyperbaric oxygen protocols, and cylinder-less manifold systems for ICUs. Hospitals in Europe and North America are adopting track-and-trace smart valves that enhance patient safety and automate replenishment cycles.
Automotive electrification adds another layer of demand as battery cell plants order high-purity argon and nitrogen for dry-room environments, while EV test labs purchase calibration mixes for emission-free range verification. Petrochemical and oil & gas operators utilize laser-grade CO₂ and helium for leak-detection, contributing a stable base. Collectively, these industries ensure that the specialty gas market enjoys a diversified revenue portfolio insulated from isolated sector downturns.
Geography Analysis
APAC Specialty Gas Market
Asia-Pacific generated 47.85% of global revenue in 2025 and is on course to grow at a 6.55% CAGR through 2031. Mainland China continues to commission memory and logic megafabs that consume bulk nitrogen and electronic-grade fluorinated gases. South Korea’s Pyeongtaek and Xi’an lines bolster demand for UHP argon. Taiwan’s cluster remains a heavy purchaser of neon sourced from diversified purification hubs to mitigate Ukrainian supply risk. Japanese OEMs invest in long-term helium contracts to shield domestic chip tool production, sustaining imports despite global shortages. ASEAN nations, led by Malaysia and Vietnam, have attracted advanced-packaging plants that require large volumes of forming-gas mixtures, drawing regional distributors closer to end-users. These combined investments secure Asia-Pacific’s long-running leadership in the specialty gas market.
North America Specialty Gas Market
North America benefits from USD 450 billion in private semiconductor investment sparked by the CHIPS Act, expanding wafer output and stimulating sales of precursor gases, high-purity ammonia, and chamber-clean blends. Shale gas production is set to hit 105 Bcf/d in 2025, improving feedstock economics for nitrogen and hydrogen. The region is also witnessing brisk installation of green-hydrogen electrolyzers and CO₂ capture units, each reliant on calibration standards that spur specialty gas procurement. Rising hospital refurbishment, coupled with the Defense Health Program budget, accelerates medical-grade demand. Consequently, the specialty gas market in the United States and Canada is on a firm, multi-year upswing.
Europe Specialty Gas Market
Europe shows more measured growth due to stringent industrial-emission directives, yet its strong green-hydrogen ambitions and advanced research laboratories ensure steady consumption. Germany’s plan to double electrolyzer capacity underpins demand for H₂, O₂, and CO calibration gases, while France’s role as Europe’s largest LNG importer drives marine-fuel transition gases and bunker-grade nitrogen. Scandinavian fabs focusing on silicon carbide and gallium nitride devices order high-purity silane and dichlorosilane, expanding the specialty gas market’s niche segments. Eastern European pharmaceutical clusters add another layer of volume, purchasing sterile-grade CO₂ for lyophilization lines.
South America and MEA Specialty Gas Market
South America’s specialty gas market is smaller but rising, with Brazilian petrochemical complexes using hydrogen and nitrogen for polymer grade output, and Argentine refineries investing in sulfur-recovery upgrades that require specialty blends. In the Middle East & Africa, mega-refining and gas-to-chemicals projects in Saudi Arabia drive ordering of bulk hydrogen and SO₂ for trace-element removal, while South Africa’s healthcare sector expands bulk oxygen networks across provincial hospitals. These initiatives collectively widen the specialty gas market’s global footprint.

Regulatory Landscape
Specialty gases operate under overlapping environmental, safety, and transport regimes that shape product portfolios and cost-to-serve. In the European Union, Regulation (EU) 2024/573 (effective March 11, 2024) tightens requirements for fluorinated gases through quotas and phase-down targets, reinforcing demand for compliant low-GWP blends and stronger documentation controls across the F-gas supply chain. In the United States, the EPA finalized NESHAP for Chemical Manufacturing Area Sources (CMAS) on March 28, 2026, raising the bar for hazardous air pollutant and VOC controls at relevant chemical manufacturing operations, while the methane Waste Emissions Charge (USD 900/ton in 2024, rising to USD 1,500 by 2026) increases attention on monitoring and abatement practices around gas production and adjacent petrochemical systems.
International trade and cylinder logistics remain anchored to standards for calibration and packaging integrity, which is critical for electronics and medical-grade applications. ISO 6143:2025 (June 2025) standardizes methods for determining composition in calibration gas mixtures, supporting traceability and auditability requirements for end users such as semiconductor fabs and analytical labs. Packaging and transport compliance also evolves through cylinder standards such as ISO 9809-4:2026 (published February 2026) for refillable seamless stainless steel gas cylinders, alongside guidance from industry bodies including the Compressed Gas Association (CGA) and the European Industrial Gases Association (EIGA).
Value Chain Analysis
The specialty gas value chain starts upstream with feedstocks and primary production, including air separation (nitrogen, oxygen, argon), noble gas recovery and purification (neon, krypton, xenon, helium), and chemical synthesis for halogenated and carbon-based gases. Midstream operations focus on purification to ultra-high-purity grades, blending into certified mixtures (notably calibration gases), and specialty packaging in cylinders, micro-bulk, and bulk liquid formats. Standards-setting and safety guidance from CGA, EIGA, and AIGA help ensure consistent specifications and handling practices, which is especially relevant where customers require documented impurity limits and stable lot-to-lot composition.
Downstream delivery relies on pipelines (where available), bulk liquid tankers, and cylinder distribution networks serving electronics and semiconductor fabs, healthcare sites, petrochemical complexes, and laboratories. Logistics and cold-chain integrity are key value drivers because purity can be affected by handling, contamination, or packaging discipline, which raises reliance on certified cylinders, valves, and traceable filling processes. Equipment and infrastructure suppliers such as Chart Industries support this chain with cryogenic storage and transport hardware, while integrated suppliers often use build-own-operate and on-site models for large end users to reduce transport risk, improve uptime, and meet stringent purity and safety requirements.
Competitive Landscape
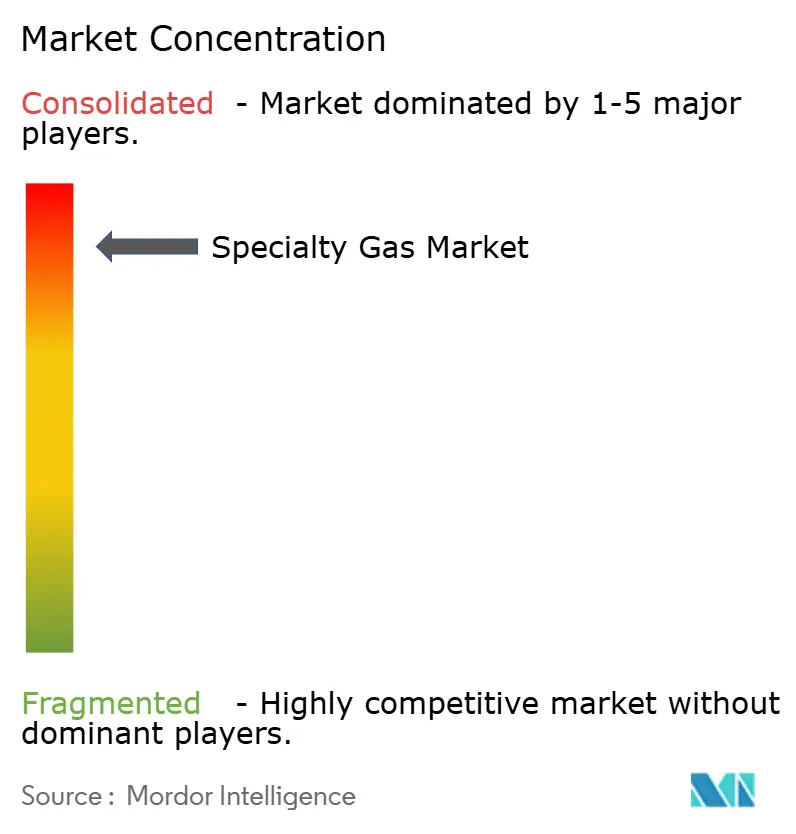
Global majors command a majority share, resulting in highly consolidated concentration. Air Liquide achieved 2024 sales exceeding EUR 27 billion and improved its operating margin despite inflationary energy costs. Its investment pipeline now allocates 40% to energy-transition projects, such as low-carbon hydrogen and CCS, while maintaining aggressive spend on electronics gases for Asia-Pacific fabs. Linde secured 53 new small on-site agreements in 2023 worth USD 270 million, serving midsize manufacturers that prefer captive supply over bulk trucking. It is evaluating a partnership with Merck to integrate specialty gases with advanced semiconductor chemicals, indicating a potential vertically integrated offering.
Air Products continues to expand its global hydrogen backbone, adding looping segments in Texas and building new separation units in Jubail, Saudi Arabia. It is also supplying over 20 electrolyzer projects, bundling calibration-gas contracts that lock in downstream specialty gas revenue. Chart Industries posted USD 4.16 billion in 2024 sales, leveraging cryogenic expertise to fabricate hydrogen and CO₂ liquefaction modules. Nippon Sanso Holdings deploys modular specialty-gas plants near Japanese and Southeast Asian customers to ensure local security of supply.
Strategic moves feature capacity debottlenecking in helium recovery, adoption of IoT cylinder-tracking, and mergers that widen end-market access. For example, April 2025 saw Linde commit to larger nitrogen and argon supply lines for Samsung’s Pyeongtaek facility, reinforcing its electronics franchise. February 2025 discussions between Merck and Linde hint at co-developing high-k precursor gases. Overall, competition centers on technology leadership, renewable-energy alignment, and supply-chain reliability, all serving to differentiate offerings in the specialty gas market.
Specialty Gas Industry Leaders
Air Liquide
Air Products and Chemicals Inc.
Linde plc
Messer SE & Co. KGaA
TAIYO NIPPON SANSO CORPORATION
- *Disclaimer: Major Players sorted in no particular order
Specialty Gas Market Companies Covered in this Report
- Air Liquide
- Air Products and Chemicals Inc.
- Coregas
- ILMO Products Company
- Linde plc
- Matheson Tri-Gas Inc.
- Matheson Tri‑Gas, Inc.
- Messer SE & Co. KGaA
- Mitsui Chemicals Inc.
- Norco Inc.
- Resonac Holdings Corporation
- SK Materials Co. Ltd.
- TAIYO NIPPON SANSO CORPORATION
- Yingde Gases Group
- Yueyang Kaimeite Electronic Specialty Rare Gases CO., Ltd

Market Opportunities and Future Outlook
A clear whitespace exists in localizing and building redundancy for electronic-grade and rare-gas supply near major semiconductor corridors, driven by customer requirements for assured purity, continuity of supply, and shorter logistics chains. 2026 announcements highlight this direction: Air Products was selected by Samsung Electronics to build, own, and operate production facilities and a bulk specialty gas supply system for a new advanced fab in Pyeongtaek, and Air Liquide announced a EUR 200 million investment (April 2026) to build and operate two industrial gas production units in Hiroshima, Japan, for semiconductor manufacturing. These moves create demand for purification skids, on-site storage, and digitally enabled cylinder tracking and quality documentation that reduce contamination risk and support tighter process controls.
A second opportunity cluster connects calibration and certified mixtures to energy-transition and process-control needs, where measurement-grade consistency matters alongside volume. The report context on electrolyzer scaling and hydrogen pipeline buildout increases the number of commissioning and monitoring points where certified H2, O2, and N2 standards are required, including compressor stations and ongoing measurement activities. At the same time, tightening environmental controls in the United States and Europe increase the value of integrated offerings that bundle specialty gases with analytics, traceability, and compliance-ready documentation, supporting procurement decisions in petrochemical, healthcare, and other high-precision manufacturing end users.
Recent Industry Developments in Specialty Gas Market
- July 2026: Air Liquide announced an investment of over USD 170 million to build, own, and operate two gas production plants in Indiana to supply ultra-pure gases to SK hynix for its US semiconductor facility, with commissioning slated for the end of 2028. The build-own-operate structure improves long-term off-take visibility and deepens the supplier role within customers' fab ramp plans.
- April 2026: Air Liquide announced a EUR 200 million investment to build and operate two industrial gas production units in Hiroshima, Japan, to supply ultra-pure nitrogen, oxygen, and argon for semiconductor manufacturing, with operations targeted by the end of 2028. The project underscores accelerating localization of ultra-high-purity supply around advanced electronics clusters and increases competitive pressure on regional purification and capacity.
- April 2025: Linde announced plans to expand its supply of specialty gases to Samsung's advanced semiconductor manufacturing facility in Pyeongtaek, South Korea. The expansion supports higher-volume, higher-purity demand tied to advanced process nodes and reinforces long-term contracting patterns between global gas majors and leading chipmakers.


Specialty Gas Market Report Scope and Research Methodology
Market Definition and Coverage
This market covers specialty gases sold for high-purity or tightly specified composition needs, including pure gases and blended mixtures, used in controlled industrial, lab, and medical processes where consistency and traceability matter.
Scope exclusions: Excludes bulk commodity industrial gases sold mainly as undifferentiated volume supply, unless they are supplied and priced as specialty-grade products.
Segments Covered in This Report
- By Type
- High-Purity Gases
- Noble Gases
- Carbon Gases
- Halogen Gases
- Other Types (Electronic and Process Gases, etc.)
- By End-User Industry
- Electronics
- Medical and Healthcare
- Automotive
- Food and Beverage
- Oil and Gas
- Other Industries (Manufacturing and Metallurgy, etc.)
- By Geography
- Asia-Pacific
- China
- Japan
- India
- South Korea
- Rest of Asia-Pacific
- North America
- United States
- Canada
- Mexico
- Europe
- Germany
- United Kingdom
- France
- Italy
- Rest of Europe
- South America
- Brazil
- Argentina
- Rest of South America
- Middle East and Africa
- Saudi Arabia
- South Africa
- Rest of Middle East Africa
- Asia-Pacific
Data Sources, Market Sizing, and Validation
Desk Research
Desk research was used to set the base structure of the market model and to keep assumptions tied to visible industry signals. We referenced public sources such as U.S. International Trade Commission trade statistics, UN Comtrade import and export series, U.S. Geological Survey data where relevant for noble gases, and energy and industrial datasets from agencies such as the U.S. Energy Information Administration. Safety and specification context was cross-checked using standards bodies and public guidance, including documents from OSHA and the Compressed Gas Association.
Alongside these, we reviewed company annual reports, investor presentations, and reputable press coverage to understand capacity moves, distribution patterns, and end-use demand direction. Patent databases were used selectively to sanity-check where new gas mixtures and process gases are seeing more innovation activity. We also used a paid subscription for company financials and intelligence, mainly to validate revenue exposure and segment commentary where public disclosures were limited. These desk sources are illustrative and not exhaustive, and many other public references were used to collect, validate, and clarify information during the study.
Primary Interviews and Surveys
Primary work was used to pressure-test demand drivers and pricing logic for specialty-grade gases across electronics, healthcare, food and beverage, automotive, and oil and gas. We spoke with gas suppliers, distributors, and large end users across APAC, EMEA, and the Americas, so country differences in purity requirements and supply constraints could be reflected in the demand pool. Where desk signals and interview inputs diverged, follow-ups were used to narrow the final assumption ranges.
Distribution of primary research fieldwork respondents
| Company type | Respondent position | Region |
|---|---|---|
| Top tier: 25% | CXOs: 13% | APAC: 37% |
| Mid tier: 61% | Functional/Unit leaders: 40% | EMEA: 36% |
| Smaller Players: 14% | Managers: 47% | Americas: 27% |
Market-Sizing & Forecasting
Sizing started with a top-down build where industrial output and trade-linked consumption signals were reconstructed into a demand pool for specialty-grade gases, and then filtered to where high-purity or certified mixtures are typically required. To keep this practical, we used market fingerprints such as electronics and semiconductor production direction, lab testing activity and installed instrument base growth, healthcare and medical gas usage trends in controlled settings, and indicator movements in high-spec manufacturing that uses calibration and carrier gases.
Those totals were then corroborated using selective bottom-up approximations, such as sampled supplier and distributor revenue splits, cylinder and packaged-gas volume logic, and interview-backed average selling price bands by grade and use case. When we observed mismatches, we adjusted the model inputs rather than forcing alignment. Where bottom-up visibility was incomplete, gaps were handled with conservative penetration assumptions that were checked through channel conversations rather than relying on a full supplier roll-up.
For forecasting, scenario analysis was used so the model could reflect different adoption speeds in electronics and healthcare, along with more stable baseline demand from established industrial users. Assumptions on price progression were kept explicit, including purity-driven premiums, mix shift toward blended gases, and regional currency conversion timing, and these were reviewed against what respondents considered realistic for the next few years.
Data Validation & Update Cycle
Outputs were validated through triangulation across independent signals, where our totals were checked against trade flows, production proxies, and known capacity or distribution constraints, then reviewed at the segment and regional levels. Variance checks were applied to identify outliers, such as sudden jumps in implied pricing or demand that did not match end-use indicators, and those items were sent back for analyst review and follow-up calls where needed.
Before sign-off, a second analyst reviews the assumptions, the math flow, and whether the final numbers remain consistent with the defined market coverage. Reports are refreshed annually, and interim updates are triggered when material events occur, such as plant expansions, regulatory shifts affecting gas handling, or sharp changes in key end-use demand. Right before delivery, we do a final pass so the published view reflects the latest available information.
Mordor Intelligence's Specialty Gas Market Estimate Compared With Other Published Estimates
Published market sizes for specialty gases often do not match because each study draws the line differently on what counts as specialty-grade, how mixtures are treated, and which end uses are emphasized in the starting demand pool. Differences also come from price assumptions, currency timing, and whether the current year is anchored on observed indicators or on an extrapolated trend.
Bulk commodity industrial gases sold mainly as large-volume supply sit outside Mordor Intelligence's scope for this market, which can pull the reported value below estimates that bundle bulk and specialty categories together. The spread is also driven by how fast price premiums are assumed to rise for ultra-high purity grades, whether semiconductor-linked demand is modeled from realistic production indicators, and how frequently assumptions are refreshed when end-market conditions shift.
Benchmark comparison
| Source | Market Size | Gaps in Research Methodology |
|---|---|---|
| Mordor Intelligence | USD 15.65 M (2026) | |
| Global Consultancy A | USD 14.96 B (2025) | Often presents a broader definition that can mix packaged specialty gases with wider industrial gas revenues, and it typically anchors sizing on a different base year with a higher growth curve for electronics-driven demand. |
| Industry Publisher B | USD 13.50 B (2024) | Uses an earlier reference year and applies an aggressive CAGR over a long horizon, and the scope description suggests wider inclusion across applications that may not consistently require specialty-grade purity or certified mixtures. |
The table shows that scope and year anchoring explain most of the difference, and then growth and pricing assumptions widen the gap over time. By keeping inclusions tied to specialty-grade requirements and by checking totals against observable end-use signals, we can produce a market size that is easier to trace and repeat when the model is updated.


Key Questions Answered in the Report
What is the current size of the specialty gas market, and how fast is it growing?
The specialty gas market is valued at USD 15.65 billion in 2026 and is projected to reach USD 19.91 billion by 2031, growing at a 4.92% CAGR.
Which segment holds the largest specialty gas market share?
High-purity gases dominate with a 37.79% share in 2025 due to stringent semiconductor purity needs.
Why is Asia-Pacific the leading regional market for specialty gases?
Asia-Pacific hosts the bulk of global semiconductor fabrication and solar panel production, giving it 47.85% revenue share in 2025 and the fastest 6.55% regional CAGR through 2031.
How do environmental regulations influence specialty gas demand?
Rules such as the AIM Act’s HFC phase-down and methane emission fees push producers toward low-GWP formulations and control technologies, raising compliance costs but driving innovation in greener gases.
Which industries are driving future demand for specialty gases?
Semiconductors, healthcare, green hydrogen, petrochemicals, and solar power are the main engines, each requiring precise gas blends and high-purity grades for advanced processes.
Who are the leading players in the specialty gas market?
Air Liquide, Linde plc, Air Products and Chemicals Inc., Messer SE & Co. KGaA, and TAIYO NIPPON SANSO CORPORATION are the principal players.
Page last updated on:


 Your data is secure and never sold or shared.


