
Special Mission Aircraft Market Size and Share
Market Overview
| Study Period | 2019 - 2031 |
|---|---|
| Market Size (2026) | USD 19.95 Billion |
| Market Size (2031) | USD 27.31 Billion |
| Growth Rate (2026 - 2031) | 6.48 % |
| Fastest Growing Market | Asia Pacific |
| Largest Market | North America |
| Market Concentration | Medium |
Major Players *Disclaimer: Major Players sorted in no particular order Image © Mordor Intelligence. Reuse requires attribution under CC BY 4.0. | |
Special Mission Aircraft Market Analysis by Mordor Intelligence
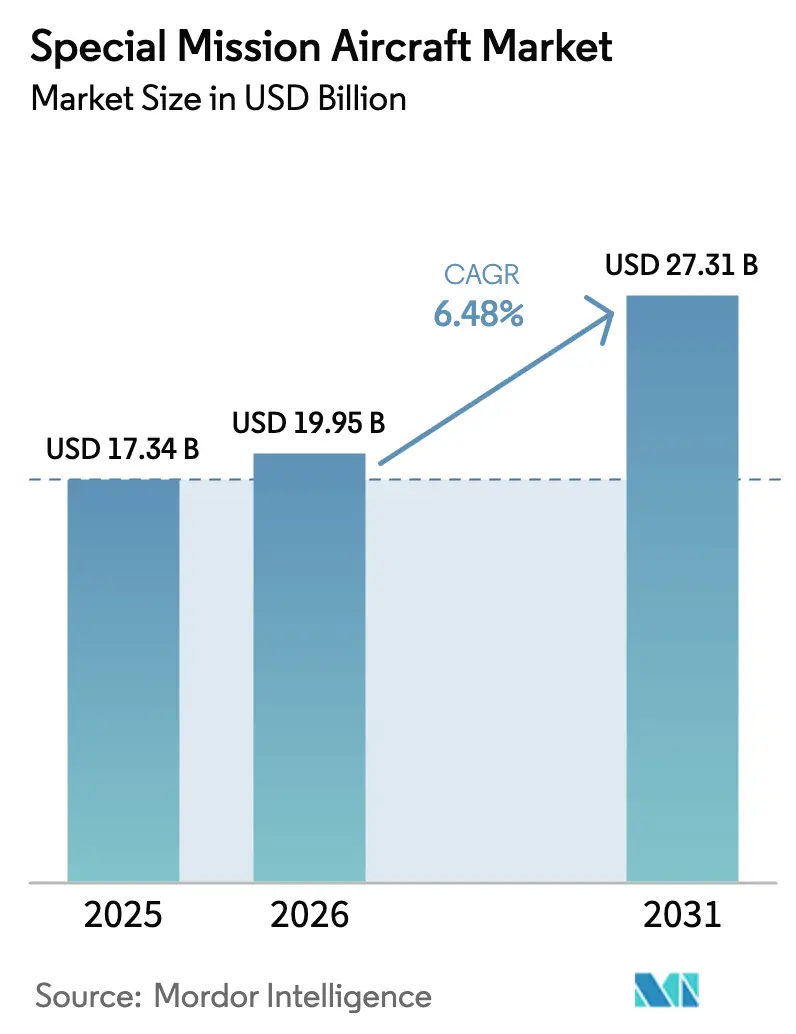
The special mission aircraft market size is expected to grow from USD 18.66 billion in 2025 to USD 19.95 billion in 2026 and is forecasted to reach USD 27.31 billion by 2031 at a 6.48% CAGR over 2026-2031. Sustained budget expansion for multi-domain ISR capabilities, accelerated replacement of aging fleets, and rapid adoption of HALE and MALE UAVs underpin this trajectory. The US defense spending on airborne ISR and EW programs climbed 7.2% year over year in FY2025, while modular mission suites that rely on open architectures have compressed integration timelines by half, enabling faster fielding of new sensors. Business jet conversions, coupled with leasing options that cap acquisition risk, lower the entry barrier for emerging operators and civil agencies. Global UAV procurements continue to diversify end-user demand, providing persistent coverage at an operating cost roughly one-third that of comparable manned platforms.
Key Report Takeaways
- By platform, fixed-wing aircraft led with 39.67% revenue share in 2025; unmanned aerial vehicles (UAVs) are projected to expand at a 12.21% CAGR to 2031.
- By application, intelligence, surveillance, and reconnaissance (ISR) held 55.42% of the 2025 value; electronic warfare (EW) and signals intelligence (SIGINT) are forecasted to grow at an 8.89% CAGR through 2031.
- By end user, defense and homeland security accounted for 52.21% of 2025 spending; the commercial and civil segment is expected to advance at a 7.75% CAGR to 2031.
- By geography, North America accounted for 41.56% of the 2025 revenue; the Asia-Pacific region is expected to post the fastest regional CAGR of 8.51% over the forecast period.
Note: Market size and forecast figures in this report are generated using Mordor Intelligence’s proprietary estimation framework, updated with the latest available data and insights as of January 2026.
Market Trends and Insights
Drivers Impact Analysis of Special Mission Aircraft Market*
| Driver | (~) % Impact on CAGR Forecast | Geographic Relevance | Impact Timeline |
|---|---|---|---|
| Escalating multi-domain ISR budgets | +1.8% | North America, Europe, Asia-Pacific | Medium term (2-4 years) |
| Fleet-replacement cycle for legacy P-3/C-130 and CN-235 families | +1.5% | North America, Europe, Japan, Australia | Long term (≥ 4 years) |
| Accelerated uptake of HALE/MALE UAVs for cost-effective missions | +1.2% | Early adoption in North America, Asia-Pacific | Short term (≤ 2 years) |
| AI-ready modular mission suites slashing integration lead-times | +0.9% | North America, Europe, spillover to Middle East and Asia-Pacific | Medium term (2-4 years) |
| Expansion of business jet conversions lowering total cost of ownership | +0.7% | Middle East, Asia-Pacific, smaller European nations | Medium term (2-4 years) |
| Turnkey leasing by specialist lessors enabling small nation entry | +0.5% | Africa, South America, Southeast Asia, Eastern Europe | Long term (≥ 4 years) |
| Source: Mordor Intelligence | |||
Escalating Multi-Domain ISR Budgets Drive Spend
Defense ministries across the NATO and Indo-Pacific regions increased ISR allocations in 2025, reflecting the imperative for real-time cross-domain awareness in the Special Mission Aircraft Market. The US earmarked USD 13.9 billion for airborne ISR and EW programs in fiscal 2025, a clear signal of sustained funding momentum. Japan, the UK, and Australia mirrored this trend with budget approvals for P-1, P-8A, E-7 Wedgetail, and MQ-4C Triton fleets. These appropriations drive steady orders for new airframes and mid-life avionics retrofits. Open-system architectures make it easier to layer AI engines that fuse multi-spectral data, raising the value proposition of every delivered platform. As budgets lock in multi-year procurement lines, suppliers secure forward revenue and scale production lines to meet widened demand horizons.
Fleet Replacement Cycle Accelerates Platform Modernization
Cold War-era patrol and transport airframes entered retirement in 2024-2025, forcing operators to select lower-maintenance successors. The final P-3C Orion squadron was decommissioned by the US Navy in December 2024, marking the complete transition to the P-8A Poseidon, a jet variant with a 30% greater mission radius. Spain and Canada initiated competitions or awards to replace CN-235 and CP-140 fleets, prioritizing modular mission bays and open-architecture avionics. Operators now demand compliance with VICTORY standards and high-bandwidth data buses to avoid future obsolescence. Replacement projects ripple through supply chains, uplifting sensor, data-link, and training providers. The resulting procurement wave underpins a predictable backlog that supports the special mission aircraft market through the next decade.
Accelerated Uptake of HALE/MALE UAVs Transforms Economics
Persistent surveillance at lower hourly cost positions HALE and MALE UAVs as prime alternatives to crewed aircraft. General Atomics delivered 24 MQ-9B SeaGuardian systems in 2025, each capable of more than 30-hour sorties and certified for operations in unsegregated airspace. Northrop Grumman extended the RQ-4 Global Hawk service life to 2035 with a fresh sensor upgrade award in March 2025.[1] Budget-constrained governments can now double daily coverage at one-third the cost of a crewed operation, shifting acquisition priorities toward ground control stations and satellite links. As attrition risk in contested zones increases, unmanned systems are absorbing missions that once required multi-crew patrols. This modality reshapes training pipelines, sustainment models, and command-and-control (C2) doctrine, reinforcing the growth outlook for the special mission aircraft market.
AI-Ready Modular Mission Suites Slashing Integration Lead Times
Open-architecture mission suites embedded with AI processors reduced integration schedules from two years to under 12 months. L3Harris implemented its SkyVision AI package on a Bombardier Global 6500 in 2025, achieving operational readiness in 11 months, half the legacy benchmark.[2] Israel Aerospace Industries and Rafael incorporated change-detection algorithms within new ISR pods, enabling onboard anomaly recognition and reducing bandwidth loads. Faster cycles would allow operators to field new sensor combinations without requiring prolonged depot visits. Standardized interfaces compliant with STANAG 4586 foster an ecosystem where sensor providers compete on capability, not connector pin-outs. This modularity enhances residual value, enticing lessors to expand fleets dedicated to special missions and broadening finance options across emerging markets.
Restraints Impact Analysis of Special Mission Aircraft Market*
| Restraint | (~) % Impact on CAGR Forecast | Geographic Relevance | Impact Timeline |
|---|---|---|---|
| Procurement deferrals amid fiscal tightening | -1.1% | Western Europe, North America, debt-constrained emerging markets | Short term (≤ 2 years) |
| High-end A2/AD bubbles reducing manned-platform survivability | -0.8% | Asia-Pacific (South China Sea, Taiwan Strait), Eastern Europe | Medium term (2-4 years) |
| LEO-satellite constellations substituting some airborne tasks | -0.4% | Global; early impact in maritime and border surveillance | Medium term (2-4 years) |
| ITAR/dual-use export controls on advanced sensor payloads | -0.6% | Global; exports from North America to non-allied nations | Long term (≥ 4 years) |
| Source: Mordor Intelligence | |||
High-End A2/AD Systems Shift Platform Preferences
Integrated air-defense systems equipped with long-range surface-to-air missiles shrink safe operating envelopes for crewed ISR aircraft. RAND modeling indicates that attrition risks exceed 15% for manned platforms that venture within 300 nautical miles of contested coastlines in a high-intensity scenario. NATO standoff tactics now emphasize RC-135 and E-7 Wedgetail flights beyond enemy missile arcs, delegating near-shore persistence to MQ-4C Triton UAVs. The broader adoption of crewless assets mitigates pilot survivability concerns, yet introduces new requirements for satellite bandwidth and cyber-secure command links. For the special mission aircraft market, the shift tempers demand for heavy crewed variants while stimulating orders for electronic-warfare escorts and low-observable sensor pods that can operate outside denial zones.
ITAR and Dual-Use Export Controls on Advanced Sensor Payloads
In the Special Mission Aircraft Market,Stringent export-control regimes continue to slow deliveries of high-end sensors to customers lacking deep defense partnerships with the United States or the European Union. License denials for synthetic-aperture radar packages during 2024-2025 forced several Middle Eastern buyers to accept downgraded payloads, which increased program timelines and costs. EU dual-use rules that took effect in January 2025 added extensive end-use documentation to electro-optical systems containing automated target-tracking algorithms. Israel Aerospace Industries reported USD 120 million in deferred revenue tied to export approvals for radar pods in 2024, underscoring cash-flow sensitivity to regulatory pacing. As a result, emerging economies invest in indigenous sensor development, fragmenting the global supplier base and tempering export-driven growth for Western primes.
*Our forecasts treat driver/restraint impacts as directional, not additive. The impact forecasts reflect baseline growth, mix effects, and variable interactions.
Special Mission Aircraft Market Segment Analysis
By Platform:
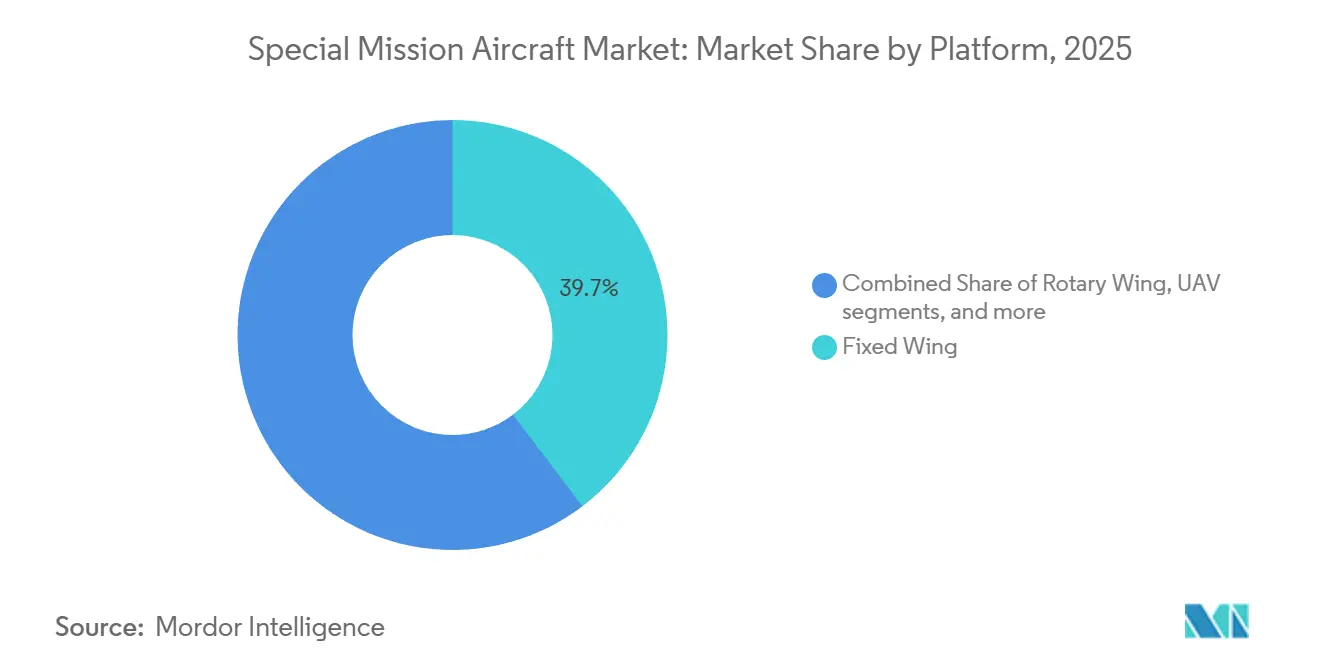
UAV Surge Reshapes Fleet MixUnmanned aerial vehicles (UAVs), the fastest-growing platform group, are forecasted to register a 12.21% CAGR to 2031, reflecting expanding roles in persistent maritime and border surveillance. Fixed-wing aircraft retained the largest share in 2025 at 39.67%, anchored by the P-8A Poseidon and C-295 Persuader fleets, which deliver multi-mission versatility and extended logistical pedigrees.[3] The special mission aircraft market share for fixed-wing platforms highlights entrenched fleet preferences among maritime nations. Still, the growing appeal of UAV cost advantages is shifting procurement roadmaps in favor of remotely piloted options.
The special mission aircraft market size captured by UAVs is expected to expand as regulatory bodies approve unsegregated airspace operations, as evidenced by the Civil Aviation Authority certificate issued to the MQ-9B in 2024. Rotary-wing assets sustain niche relevance in search-and-rescue and shipboard roles, while hybrid and optionally piloted concepts gain exploratory funding from border agencies. Business-jet conversions such as the G550 CAEW deliver rapid capability without new-type certification burdens, appealing to countries with small fleets and limited training pipelines. Suppliers that offer modular cabins and open avionics stand to capture upgrade cycles as threat environments evolve.

By Application:
Electronic Warfare Gains PaceISR constituted 55.42% of 2025 revenue, remaining the backbone of fleet tasking, as maritime, border, and counter-terror missions require persistent sensor coverage. The special mission aircraft market size attached to ISR will remain high, as naval and coast guard commanders rely on wide-area radar, electro-optical turrets, and automatic identification systems to monitor exclusive economic zones.
EW and SIGINT roles, set to compound at an annual rate of 8.89%, reflect rising spectrum congestion and the adversary's deployment of frequency-agile radars. The EC-37B Compass Call program embodies this shift, integrating cognitive jamming algorithms that autonomously tailor waveforms in real time.[4] ASW remains steady, buoyed by advances in sonobuoys that enable single-aircraft prosecutorial loops. Airborne early warning (AEW) assets are gaining traction as NATO and Asia-Pacific operators seek command and control (C2) resilience. Emergency services demand grows within civil agencies as wildfires, hurricanes, and floods drive the adoption of multi-sensor turboprops that switch missions through palletized consoles.
By End User:
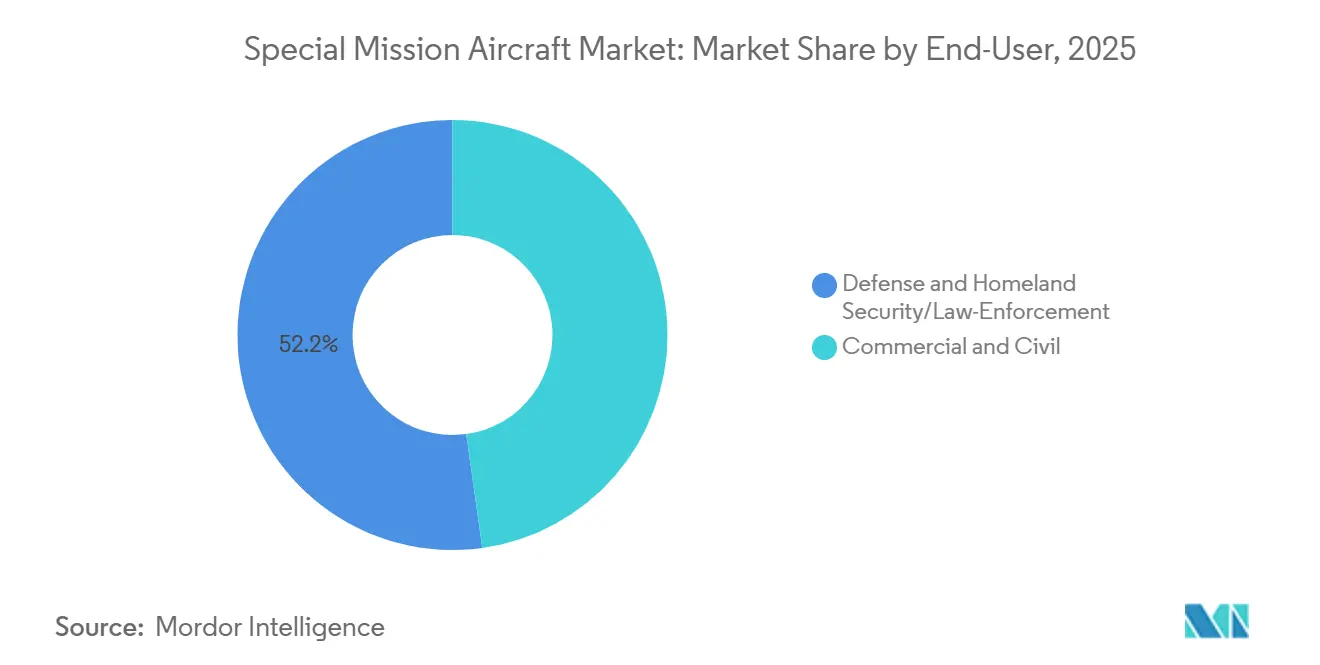
Commercial Participation ExpandsDefense and homeland security customers accounted for 52.21% of the 2025 value, reflecting consistent funding for sovereignty protection and alliance commitments. The special mission aircraft market size remains defense-led. Yet, compound expansion favors commercial and civil agencies as they pursue cost-effective aerial data collection for environmental stewardship and critical-infrastructure oversight.
The commercial and civil segment is expected to grow at 7.75% through 2031, driven by contracts such as wildfire monitoring in California and Norway’s coastal traffic surveillance service, which was awarded in 2025. As regulatory frameworks mature for beyond-visual-line-of-sight (BVLOS) flights, energy, insurance, and disaster-response organizations are increasingly procuring turnkey UAV services rather than owning and operating their own fleets. Integrators that package aircraft, ground stations, and data analytics under a service contract will unlock new addressable revenue and reduce sensitivity to cyclic defense budgets.
Geography Analysis
North America Special Mission Aircraft Market
North America retained leadership with 41.56% of 2025 revenue, supported by the US and Canadian procurement lines that bundle platform acquisition with substantial domestic industrial offsets. The region benefits from a deep vendor ecosystem, secure financing, and dedicated military research funding. Fleet modernization of the P-8A Poseidon, E-7 Wedgetail, and RC-135 variants dominates demand, while Customs and Border Protection's UAV operations illustrate expanding homeland security roles. The special mission aircraft market share in North America highlights the region's established industrial base and rapid fielding cycles.
APAC and Europe Special Mission Aircraft Market
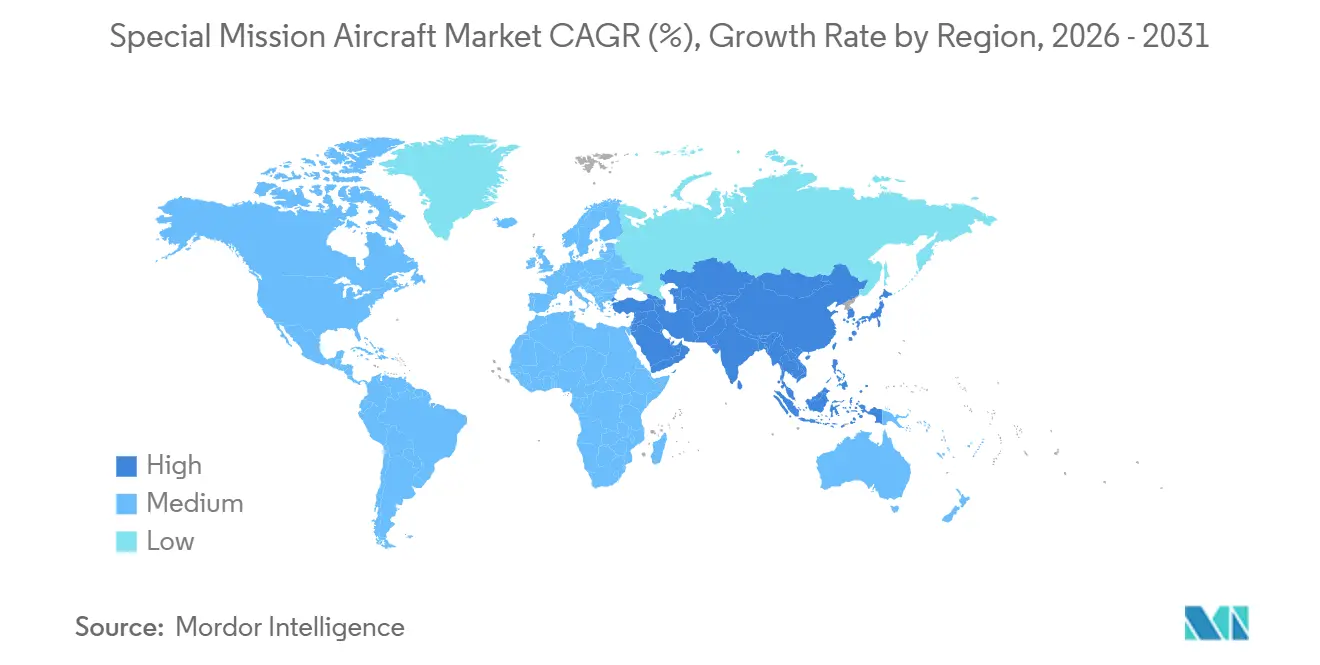
Asia-Pacific delivers the most dynamic growth outlook, projected at an 8.51% CAGR. Drivers include India's additional P-8I orders, South Korea's expansion of the P-8A, and Australia's combined MQ-4C Triton and P-8A force structure. Japan continues to enhance its indigenous P-1 fleet, integrating upgraded sonar processing and electronic support suites. Rising maritime disputes across the Indo-Pacific catalyze new ISR requirements among Southeast Asian nations, spurring both manned and unmanned acquisitions. European demand advances at a steadier clip, buoyed by collaborative NATO programs such as the E-7 Wedgetail and P-8A Poseidon buys by the United Kingdom, Germany, and Norway. Modernization of France's Atlantique 2 and Italy's ATR 72MP fleets sustains revenue from sensor and mission-system upgrades. Central and Eastern European states focus on airborne signals-intelligence packages integrated onto turboprop transports, striking a balance between cost and rapid fieldability.
MEA and South America Special Mission Aircraft Market
The Middle East and Africa channel selective capital into high-end platforms, typified by the United Arab Emirates' GlobalEye fleet, which fuses AEW&C, maritime surveillance, and ground-moving-target indication in a single airframe. Saudi Arabia expanded its CN-235 maritime-patrol inventory, optimizing littoral domain awareness and anti-smuggling efforts. South America remains modest in scale, but Brazil's C-390 Millennium search-and-rescue deliveries inject regional production and support into Embraer's supply chain, illustrating the rising prominence of domestic platforms.
Regulatory Landscape
Certification and continued airworthiness requirements shape special-mission conversions because most programs rely on modified commercial airframes and mission equipment outside standard configurations. In the United States, the FAA is progressing modernization initiatives affecting special-purpose certification pathways, including the special airworthiness certification framework and the MOSAIC rule package for light-sport certification, with remaining MOSAIC amendments taking effect in July 2026. At the aircraft level, the FAA continues to issue special conditions for specific type designs, including March 2026 special conditions applied to Gulfstream’s Model G300 related to an oxygen distribution system, which highlights the program-by-program compliance work common in business-jet-based special mission platforms.
In Europe, EASA actions tighten and clarify baseline compliance for aircraft already in production or service through Part-26 implementation guidance published in April 2026, and EASA Decision 2026/005/R updates acceptable means of compliance linked to aircraft import and airworthiness review processes. For defense-operated fleets, national procurement frameworks also influence platform choices and upgrade pacing. US DoD FY 2026 budget materials outline substantial aviation procurement and RDT&E funding across aircraft categories that include platforms often adapted or paired with special-mission systems, such as E-7A and C-130J, reinforcing the link between defense budget authority and special-mission aircraft acquisition and modification cycles.
Value Chain Analysis
The value chain begins with base-airframe OEMs (fixed-wing, rotary, and UAV), then moves to mission-system houses supplying sensors (radar, EO/IR, SIGINT/EW), communications and data links, onboard processing, and operator consoles. Integration and modification centers carry out structural changes, wiring, antenna and fairing installation, power and cooling upgrades, and software integration aligned with open-architecture interfaces. This conversion-led model is increasingly visible in business-jet-based programs, including the U.S. Army HADES effort that received its first Bombardier Global 6500 aircraft in November 2024, and France’s SIGINT pathway that advanced with the Falcon 8X-based Archange aircraft completing a first flight in July 2025.
Downstream, the chain includes test and evaluation, certification and airworthiness release processes, training systems, spares provisioning, and long-term MRO for both the base airframe and the mission suite. Prime contractors and subsystem integrators coordinate complex multi-party teams, such as Northrop Grumman’s role as mission systems integrator selected in December 2024 for the U.S. Navy’s E-130J TACAMO recapitalization, and Sierra Nevada’s SAOC effort that moved into flight activity in 2025. Sustainment and upgrade loops are a material value pool, since software-defined EW and ISR capabilities and sensor refreshes drive recurring integration work across the fleet life.
Competitive Landscape
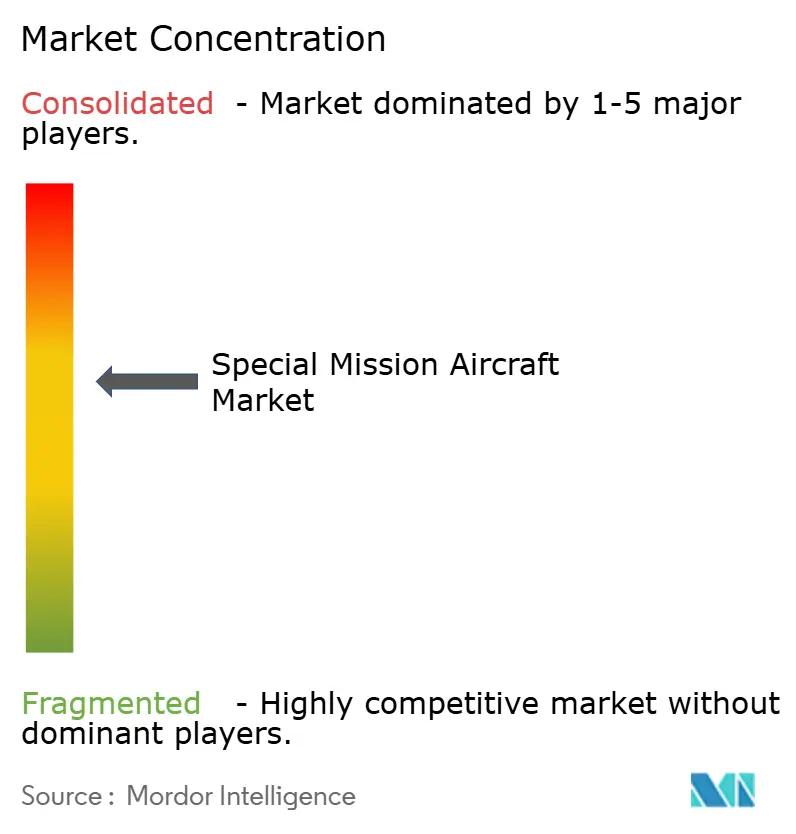
The special mission aircraft market shows moderate concentration. RTX Corporation, The Boeing Company, and Lockheed Martin Corporation maintain extensive portfolios encompassing maritime patrol, AEW, and C2. General Atomics dominates the HALE/MALE niche, leveraging rapid iterative development and its success in exporting these systems. RTX Corporation leveraged the merger of Collins Aerospace with Raytheon Intelligence & Space to create bundled radar, EW, and communication offerings that lower integration risk for buyers. The Boeing Company scaled P-8A production to meet overlapping orders from the United States, Australia, and Canada, benefiting from block-buy efficiencies and standard training pipelines. Lockheed Martin collaborated with Embraer on a maritime-surveillance variant of the C-390 Millennium, broadening access to South American and African markets.
Mission-system integrators, such as L3Harris Technologies, Inc. and Sierra Nevada Company, LLC, exploit the demand for rapid conversions of commercial airframes, often completing turnkey ISR solutions in under one year. Turkish Aerospace Industries and Korea Aerospace Industries position as disruptors, offering indigenous patrol and ISR platforms that bypass ITAR constraints. Leasing specialists expand their managed fleets, enabling government customers to deploy surveillance assets without capital expenditure or long depreciation cycles.
Technology differentiation focuses on cognitive electronic warfare algorithms, AI-enabled sensor fusion, and open standards that enable future upgrades without requiring airframe recertification. L3Harris Technologies, Inc., filed 14 patents on adaptive jamming between 2023 and 2025, illustrating the innovation race for frequency-agile countermeasures. Vendor roadmaps indicate an increase in onboard processing that filters data at the edge, thereby reducing bandwidth loads and enabling faster kill-chain decisions. Partnerships between primes and cloud analytics firms will likely shape the next frontier of value creation within the special mission aircraft market.
Special Mission Aircraft Industry Leaders
-
The Boeing Company
-
Lockheed Martin Corporation
-
Northrop Grumman Corporation
-
Bombardier Inc.
-
Dassault Aviation
- *Disclaimer: Major Players sorted in no particular order
Special Mission Aircraft Market Companies Covered in this Report
- RTX Corporation
- Israel Aerospace Industries Ltd.
- Elbit Systems Ltd.
- The Boeing Company
- Dassault Aviation
- Northrop Grumman Corporation
- Lockheed Martin Corporation
- Textron Aviation Inc.
- General Dynamics Corporation
- Airbus
- Bombardier Inc.
- Pilatus Aircraft Ltd
- Leonardo S.p.A.
- Saab AB
- Gulfstream Aerospace Corporation
- Embraer S.A.
- L3Harris Technologies, Inc.
- Sierra Nevada Company, LLC.
- Thales Group
- General Atomics Aeronautical Systems Inc.
- BAE Systems plc
Market Opportunities and Future Outlook
Near-term whitespace concentrates in programs that prioritize rapid fielding using commercial derivatives and open architectures, which increases demand for integrators able to package aircraft, mission kits, and sustainment on compressed schedules. The U.S. Army’s HADES approach, including Sierra Nevada Corporation purchasing a Bombardier Global 6500 in January 2026 as the first non-prototype aircraft, points to opportunities for conversion centers, mission-suite suppliers, and certification support services built around business-jet platforms. Large command-and-control and ISR recapitalizations also keep demand anchored for high-end integration, with the U.S. Navy’s TACAMO modernization (E-130J) entering an Integrated Test phase in FY 2026 and the SAOC (E-4B replacement) program continuing flight trials activity through 2026.
A separate opportunity pocket is expanding adoption of smaller, utility-class aircraft for special operations support and government missions where acquisition cost and runway flexibility matter. Belgium’s April 2026 selection of the Cessna SkyCourier for a five-aircraft order to support Special Operations Forces demonstrates active procurement in this lighter category, which opens runway for sensor OEMs, communications providers, and MRO partners to industrialize missionized configurations. Separately, export-control friction and documentation burdens on advanced payloads are pushing some operators to diversify sourcing and consider non-ITAR pathways, supporting demand for alternative sensor suppliers, locally hosted integration, and sovereign sustainment capabilities where feasible.
Recent Industry Developments in Special Mission Aircraft Market
- July 2026: Korean Air formalized the purchase of two additional Bombardier Global 6500 aircraft to be configured for the Republic of Korea Air Force electronic warfare program. The transaction reinforces the Global 6500 as a repeatable business-jet platform for high-end missionization, supporting a longer production and integration pipeline for EW-specific mission systems and modification work.
- September 2025: France’s DGA placed an order for five Falcon 2000 Albatros maritime surveillance aircraft under the AVSIMAR program, raising the planned fleet total to twelve. The follow-on order strengthens the conversion-driven maritime surveillance segment and adds multi-aircraft scale for mission-system installation, training, and long-term support.
- July 2024: Diamond Aircraft signed a contract to supply three DA62 MPP aerial surveillance aircraft to the Greek Ministry of Climate Crisis and Civil Protection for firefighting, search and rescue, and aerial surveillance roles. The award reflects continuing procurement of smaller, lower-cost special-mission platforms by civil agencies that need multi-sensor coverage without the operating footprint of larger military aircraft.
Special Mission Aircraft Market Report Scope and Research Methodology
Market Definition and Coverage
For this study, the market covers aircraft that are purpose-equipped or professionally converted to perform a defined special mission, and the value includes the mission systems integration needed to make that aircraft operational for the mission.
Scope exclusions: We exclude basic trainer aircraft, unmanned cargo drones, and routine aftermarket parts or repairs that do not change mission capability.
Segments Covered in This Report
- By Platform
- Fixed Wing
- Rotary Wing
- Unmanned Aerial Vehicle (UAV)
- Hybrid/Other Platforms
- By Application
- Intelligence, Surveillance and Reconnaissance (ISR)
- Maritime Patrol and Anti-Submarine Warfare (ASW)
- Electronic Warfare (EW) and Signals Intelligence (SIGINT)
- Airborne Early Warning & Control (AEW&C)
- Emergency Services (Medevac, Disaster Management, Search and Rescue, etc.)
- By End User
- Defense and Homeland Security/Law-Enforcement
- Commercial and Civil
- By Geography
- North America
- United States
- Canada
- Mexico
- Europe
- United Kingdom
- France
- Germany
- Russia
- Rest of Europe
- Asia-Pacific
- China
- India
- Japan
- Australia
- Rest of Asia-Pacific
- South America
- Brazil
- Rest of South America
- Middle East and Africa
- Middle East
- United Arab Emirates
- Turkey
- Rest of Middle East
- Africa
- South Africa
- Rest of Africa
- Middle East
- North America
Data Sources, Market Sizing, and Validation
Desk Research
Desk work starts with building a clean view of the active fleet, procurement intent, and mission demand signals that can be tracked consistently across countries. We used public sources such as U.S. DoD budget justification books, NATO and national defense ministry releases, UN Comtrade trade statistics for relevant aircraft and avionics categories, ICAO and FAA aircraft registry disclosures, and IATA and aerospace association briefings where they touch special mission operations.
Next, the inputs were cross-checked using company annual reports, investor presentations, contract award announcements, and reputable aviation press reporting that describes mission fits (for example, maritime patrol, ISR, AEW and emergency response). Where it supported validation, we referenced paid subscriptions for company financial intelligence, aviation and aircraft level databases, and defense contracts and tenders tracking, mainly to confirm platform counts, delivery timing, and program maturity. The sources listed here are illustrative, and we reviewed additional public documents for data collection, validation, and clarification.
Primary Interviews and Surveys
Primary work focused on interviews and short surveys with mission system integrators, operators, MRO and modification specialists, and procurement and program staff who track upgrade cadence and fleet readiness needs. Coverage was balanced across the main demand regions so that platform counts, upgrade timing, and typical integration value ranges could be validated. The respondent input was then used to fine-tune assumptions that were not fully visible in public sources.
Distribution of primary research fieldwork respondents
| Company type | Respondent position | Region |
|---|---|---|
| Top tier: 35% | CXOs: 15% | APAC: 45% |
| Mid tier: 47% | Functional/Unit leaders: 34% | EMEA: 30% |
| Smaller Players: 18% | Managers: 51% | Americas: 25% |
Market-Sizing & Forecasting
The sizing starts with a top-down approach where defense and government aviation spend, program level procurement plans, and fleet modernization cycles are reconstructed into an addressable demand pool for mission-capable aircraft and conversions. Only after the demand pool is built do we allocate value into the market using mission fit, platform availability, and typical integration intensity, so the model stays connected to what is actually being bought and fielded.
To keep the totals realistic, the outputs were corroborated with selective bottom-up approximations such as sampled platform delivery and conversion counts multiplied by representative integration values, along with channel checks on upgrade packages. Inputs used in the model include active fleet size and average age of surveillance and patrol platforms, expected deliveries and retirement schedules, defense procurement budget timing, upgrade and retrofit cadence, and mix shifts across fixed-wing, rotary-wing, and unmanned platforms. Forecasting was mainly done using scenario analysis, where base case demand and timing were stress-tested with program slippage and budget cycle sensitivity, and then aligned to expert consensus from interviews. Where bottom-up visibility was weak for smaller conversions, gaps were handled using conservative adoption rates tied to fleet size and known mission needs, and then reviewed again during validation.
Data Validation & Update Cycle
Model outputs were checked against independent signals such as announced procurement quantities, known fleet replacement needs, and conversion pipeline indicators, and then exceptions were reviewed before internal sign-off. When a large variance appeared, the related assumptions were reworked and targeted follow-up calls were triggered to confirm whether the gap came from scope, timing, or pricing.
Reports are refreshed annually, and interim updates are made when material events happen, such as major contract awards, program cancellations, or budget reallocations that can move near-term deliveries. Before delivery, an analyst runs a fresh pass on key inputs and assumptions so clients receive the latest updated view aligned to current public releases.
Mordor Intelligence's Special Mission Aircraft Market Size Versus Other Published Estimates
Published numbers for this market can vary widely because groups do not always count the same aircraft actions, and they also time the revenue differently between new platforms and conversion work. Differences in whether integration is included, how unmanned platforms are treated, and what year is used for currency conversion can also shift the final value.
By tracking platform deliveries, funded retrofit milestones, and mission-system integration value bands, Mordor Intelligence keeps the 2026 total tied to aircraft that are being fielded for a defined special mission, rather than counting broader aviation revenue that only touches the mission space.
Benchmark comparison
| Source | Market Size | Gaps in Research Methodology |
|---|---|---|
| Mordor Intelligence | USD 19.95 B (2026) | |
| Industry Research House A | USD 15.47 B (2024) | Uses a broader mission taxonomy but appears to anchor value around earlier-year revenue capture, and point-of-sale splits can shift conversions and integration into aftermarket buckets that are not aligned to a mission-capable aircraft count. |
| Market Publisher B | USD 20.06 B (2024) | Shows a faster growth curve and a wider end-user frame (including space and broad civil uses), which can expand the addressable pool beyond aircraft that are procured or converted specifically for operational special missions. |
The spread mainly comes from when revenues are recognized and how tightly the scope stays centered on mission-capable aircraft and their integration work. Using repeatable checks tied to fleet activity, funded programs, and realistic conversion cadence helps keep the estimate balanced and easier to trace back to observable demand drivers.
Key Questions Answered in the Report
How large is the special mission aircraft market in 2026?
The special mission aircraft market size reached USD 19.95 billion in 2026 and is projected to climb to USD 27.31 billion by 2031 at a 6.48% CAGR.
Which platform segment holds the largest revenue share?
Fixed-wing aircraft led with 39.67% of 2025 revenue, anchored by P-8A Poseidon and similar maritime-patrol variants.
Which platform segment is growing the fastest?
Unmanned aerial vehicles (UAVs) are forecasted to expand at a 12.21% CAGR through 2031 as operators seek persistent coverage at lower hourly cost.
Which region will see the highest growth?
Asia-Pacific is expected to register the fastest regional CAGR at 8.51%, driven by procurement in India, Japan, Australia, and South Korea.
What restrains near-term growth?
Budget deferrals in Europe and export-control limitations on advanced sensors delay some programs, trimming about 1.3 percentage points from near-term CAGR.
What is the biggest application area?
Intelligence, surveillance, and reconnaissance (ISR) remain dominant, accounting for 55.42% of 2025 market value and continuing to attract funding.