
Spandex Market Size and Share
Market Overview
| Study Period | 2020 - 2031 |
|---|---|
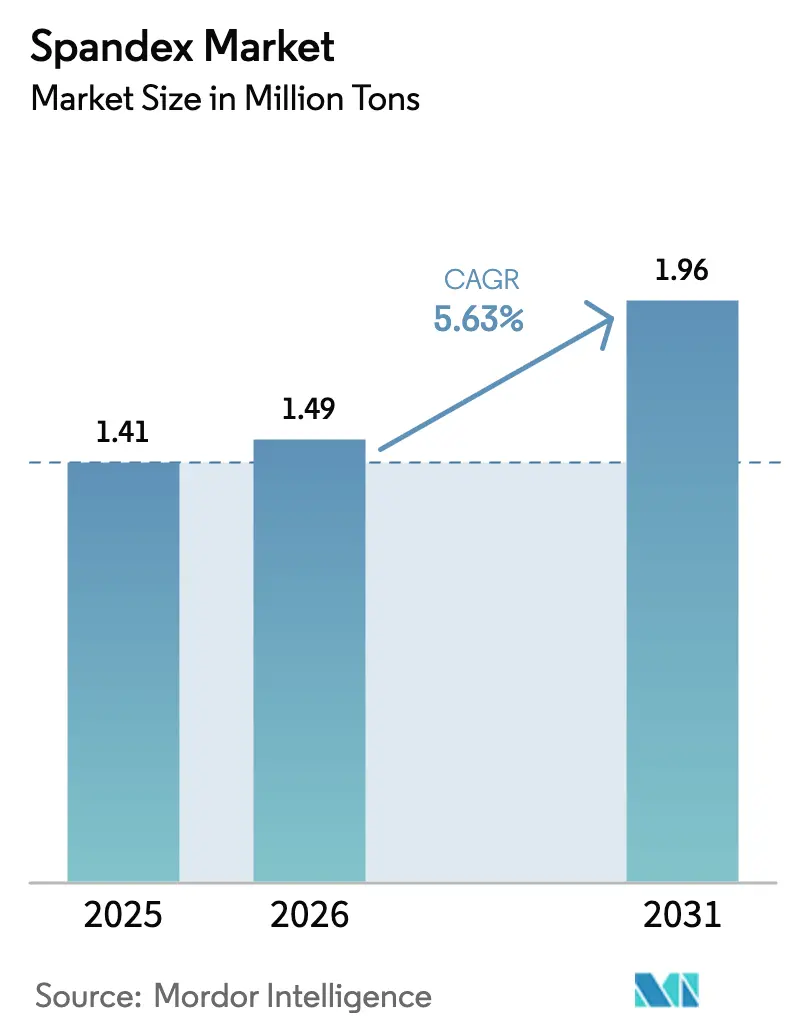
| Market Volume (2026) | 1.49 Million tons |
| Market Volume (2031) | 1.96 Million tons |
| Growth Rate (2026 - 2031) | 5.63 % |
| Fastest Growing Market | Middle East and Africa |
| Largest Market | Asia Pacific |
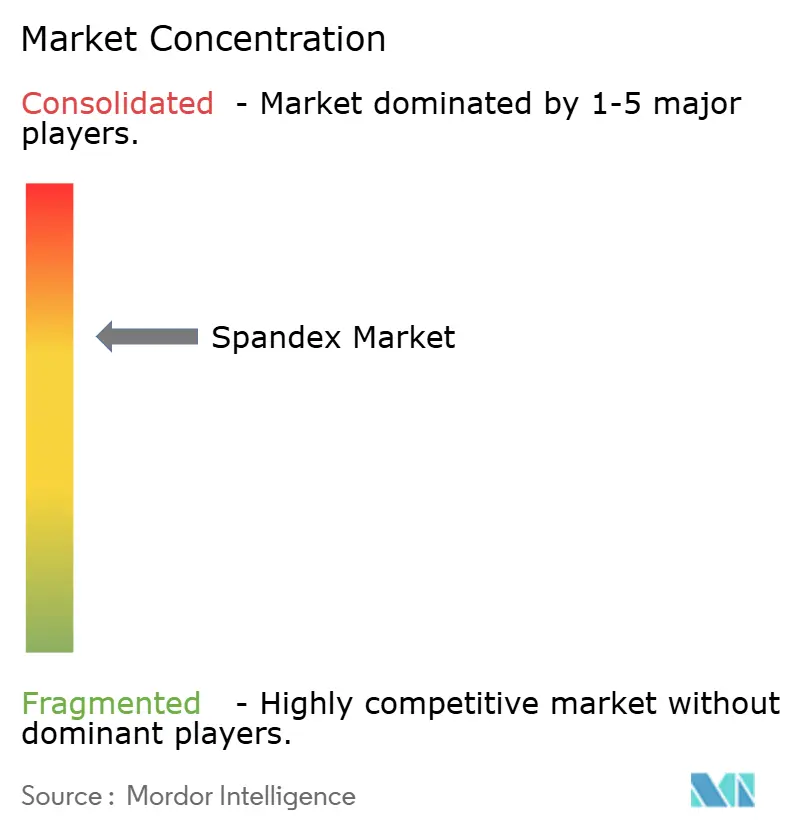
| Market Concentration | Medium |
Major Players *Disclaimer: Major Players sorted in no particular order Image © Mordor Intelligence. Reuse requires attribution under CC BY 4.0. | |
Spandex Market Analysis by Mordor Intelligence
The Spandex Market size was valued at 1.41 million tons in 2025 and estimated to grow from 1.49 million tons in 2026 to reach 1.96 million tons by 2031, at a CAGR of 5.63% during the forecast period (2026-2031). This sustained expansion rests on rising demand for stretch-enhanced fabrics across apparel, medical, and emerging technical textile uses, with athleisure, seamless knitting, and circular-economy mandates acting as the primary growth engines. Producers also leverage bio-based polyurethane chemistry to future-proof operations against tightening sustainability regulations, while raw-material price volatility keeps margins under pressure. Capacity additions in Asia-Pacific continue to influence global pricing, yet the Middle-East and Africa’s fast‐growing production base signals a gradual geographic rebalancing of the spandex market.
Key Report Takeaways
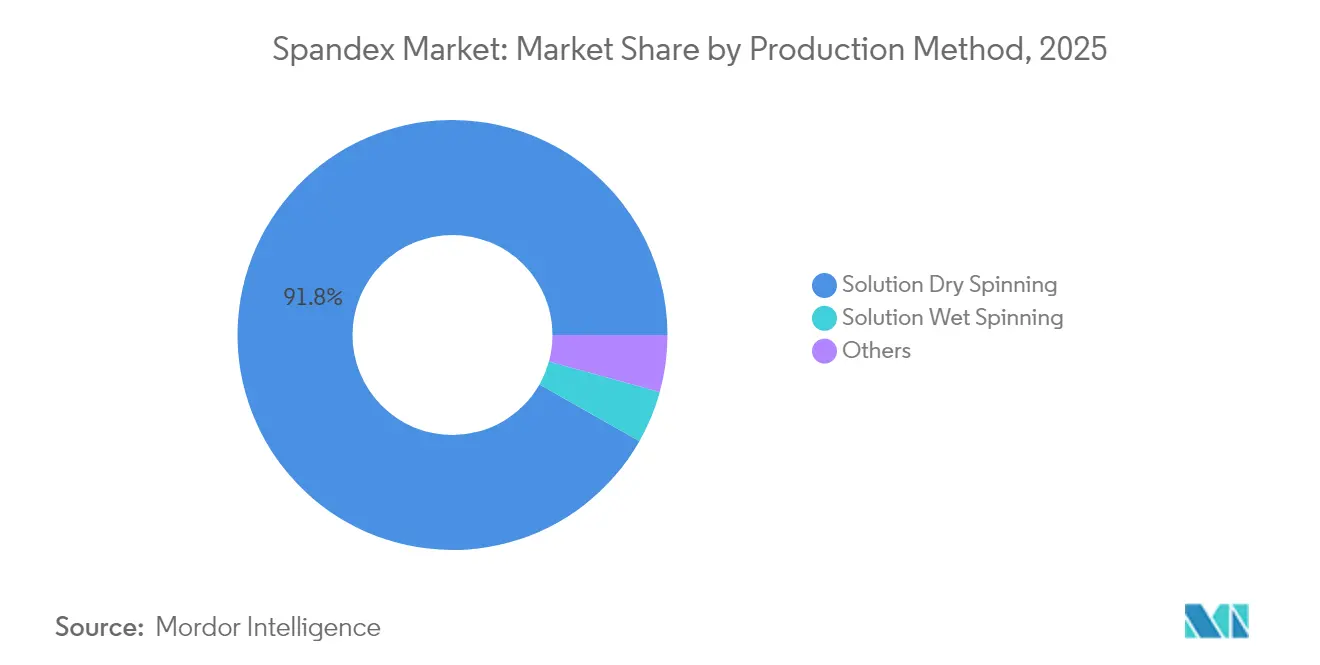
- By production method, solution dry spinning held 91.78% spandex market share in 2025; alternative methods under “Others” are forecast to grow at 6.08% CAGR through 2031.
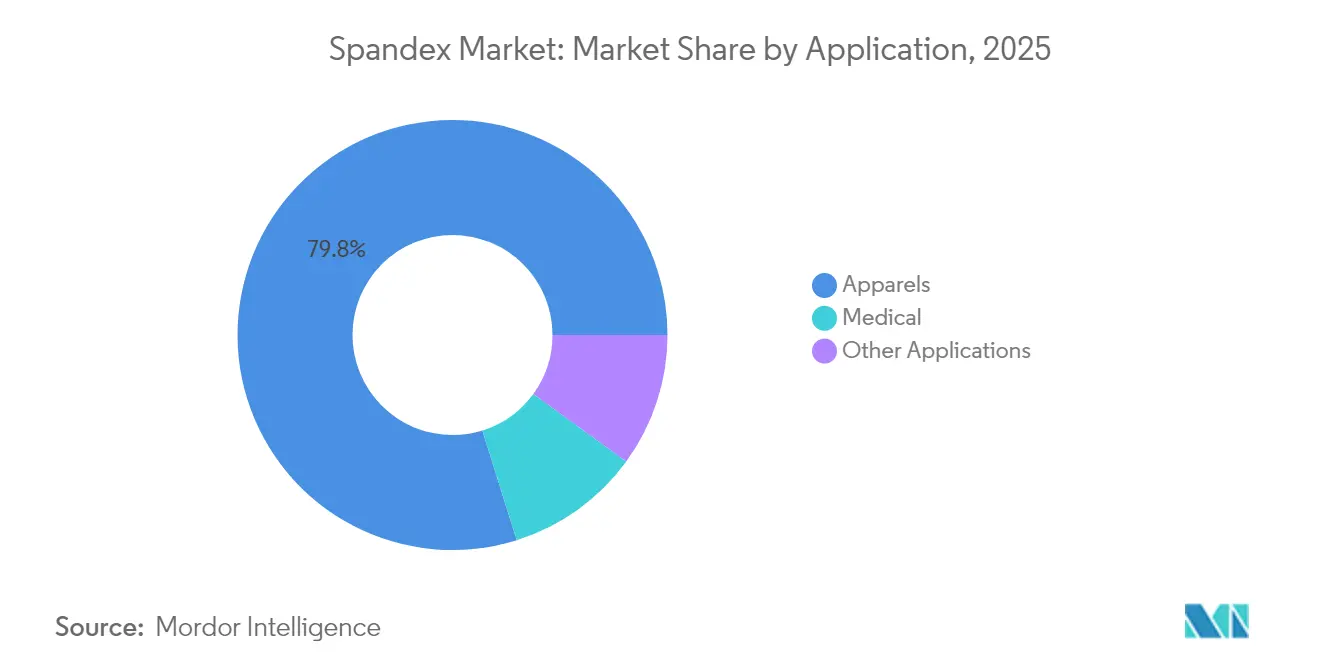
- By application, apparel controlled 79.83% of the spandex market size in 2025, while medical applications are projected to expand at a 6.22% CAGR to 2031.
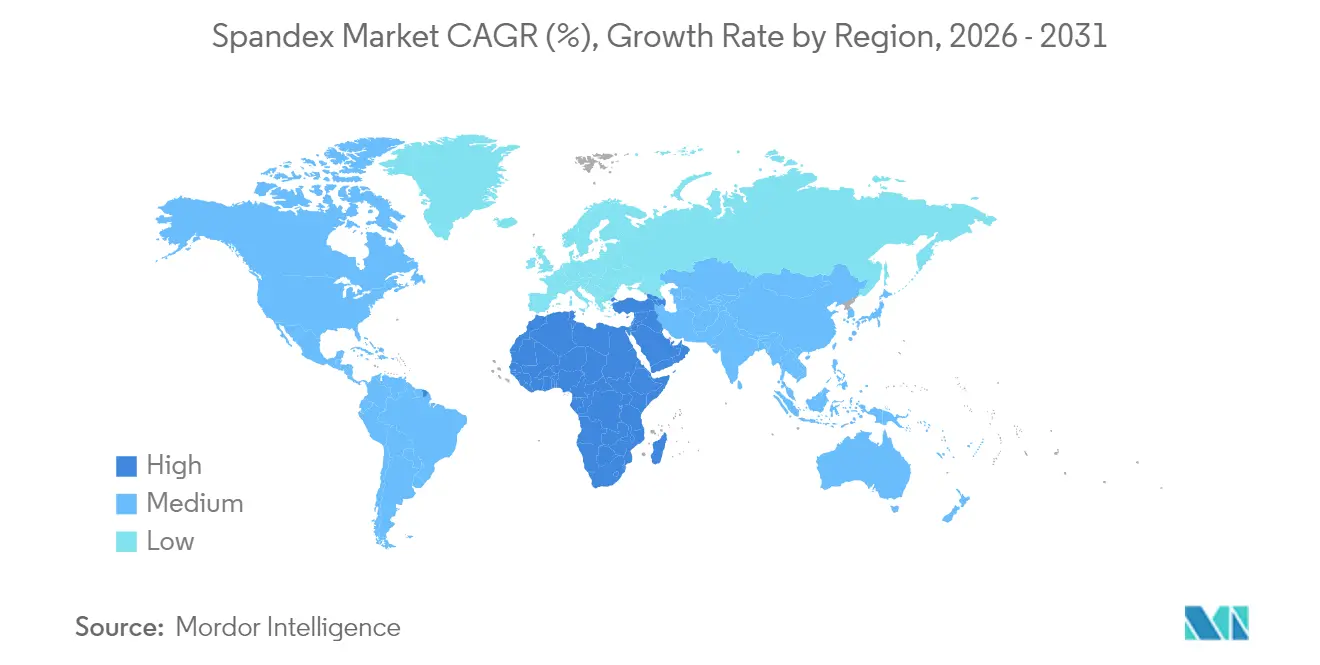
- By geography, Asia-Pacific led with 63.88% revenue share of the spandex market size in 2025; the Middle-East and Africa are expected to post the fastest growth at 6.11% CAGR between 2026-2031.
Note: Market size and forecast figures in this report are generated using Mordor Intelligence’s proprietary estimation framework, updated with the latest available data and insights as of 2026.
Market Trends and Insights
Drivers Impact Analysis of Spandex Market*
| Drivers | (~) % Impact on CAGR Forecast | Geographic Relevance | Impact Timeline |
|---|---|---|---|
| Rising penetration of athleisure and performance wear | +2.1% | Global; strongest in North America and Europe | Medium term (2-4 years) |
| Government-backed investments in textile clusters | +1.3% | Asia-Pacific core; spill-over to Middle-East and Africa | Long term (≥ 4 years) |
| Medical compression garments demand surge post-COVID | +1.0% | Global; concentrated in developed markets | Short term (≤ 2 years) |
| Rapid uptake of seamless knitting technology | +0.8% | Asia-Pacific manufacturing hubs; expanding globally | Medium term (2-4 years) |
| Bio-based diisocyanate breakthroughs | +0.6% | Europe and North America leading; Asia-Pacific following | Long term (≥ 4 years) |
| Source: Mordor Intelligence | |||
Rising Penetration of Athleisure and Performance Wear
Athleisure’s rise from niche to mainstream has pushed spandex demand far beyond traditional sportswear. Performance apparel growth is driven by consumers who expect office-to-gym versatility. Remote-work culture reinforced casual dress codes, while direct-to-consumer brands accelerated innovation loops that reward fiber suppliers able to deliver consistent stretch, recovery, and moisture-management performance. Luxury labels such as Lululemon logged 25% year-over-year increases in technical fabric launches, underscoring how premium positioning no longer excludes high-function textiles[1]American Chemical Society, “Spinning Artificial Spider Silk into Next-Generation Medical Materials,” sciencedaily.com .
Government-Backed Investments in Textile Clusters
National industrial policies in Egypt, Vietnam, and Bangladesh channel low-cost financing, tax holidays, and workforce training into integrated textile parks. These clusters shorten lead times and improve quality control by co-locating spinning, weaving, and finishing operations, thereby anchoring long-term demand for spandex suppliers that establish local feedstock and fiber facilities. Similar incentives in Turkey and India reinforce the structural role of textiles in employment generation, ensuring that spandex market demand remains resilient across economic cycles.
Medical Compression Garments Demand Surge Post-COVID
Expanded outpatient care and heightened awareness of circulatory disorders have lifted prescription volumes of graduated compression hosiery and sleeves. Aging populations in the United States, Germany, and Japan rely on long-term compression therapy, while insurance coverage has broadened patient access. New spandex grades enable precise pressure gradients without sacrificing comfort or breathability, aligning with medical-device standards and reinforcing the fiber’s repositioning from fashion accessory to essential healthcare component.
Rapid Uptake of Seamless Knitting Technology
Seamless knitting eliminates cut-and-sew waste, supporting material savings and superior fit. Machines demand uniform tension and heat stability, prompting spandex producers to fine-tune polymer architecture for consistent processing. Adoption accelerates under sustainability mandates and consumer comfort preferences, with major sportswear brands shifting entire product lines to seamless platforms. Fiber suppliers able to guarantee tight denier control and low-defect rates secure multi-year yarn supply contracts.
Restraints Impact Analysis of Spandex Market*
| Restraints | (~) % Impact on CAGR Forecast | Geographic Relevance | Impact Timeline |
|---|---|---|---|
| Intensifying NGO pressure over micro-plastic pollution | -1.2% | Europe and North America; spreading globally | Medium term (2-4 years) |
| Petrochemical feedstock price volatility | -0.9% | Global; highest in import-dependent regions | Short term (≤ 2 years) |
| Supply-demand imbalance from China capacity additions | -0.7% | Global; strongest in Asia-Pacific and export markets | Medium term (2-4 years) |
| Source: Mordor Intelligence | |||
Intensifying NGO Pressure Over Micro-Plastic Pollution
Environmental groups spotlight microfiber shedding—up to 700,000 particles per wash—driving European Union rules on filtration and labeling. Consumer sentiment shifts toward natural or recycled options, compelling brands to specify low-shedding or biodegradable spandex variants. Compliance costs rise as producers add coating steps or invest in intrinsic biodegradation technologies, potentially narrowing price competitiveness versus alternative fibers.
Petrochemical Feedstock Price Volatility
TDI and MDI costs swung 15-20% quarter-to-quarter in 2024, with January 2025 spot hikes of USD 200–300 per ton forcing fiber makers to renegotiate supply contracts or absorb margin pressure[2]ECHEMI, “Global MDI and TDI Price Increases: January 2025 Developments,” echemi.com . Geopolitical risk premiums in key feedstock regions further muddy cost forecasting, prompting companies to expand raw-material sourcing footprints and carry higher inventories to safeguard continuous operation.
*Our forecasts treat driver/restraint impacts as directional, not additive. The impact forecasts reflect baseline growth, mix effects, and variable interactions.
Spandex Market Segment Analysis
By Production Method:
Dry Spinning Maintains Technical EdgeSolution dry spinning commanded 91.78% spandex market share in 2025, reflecting its superior fiber uniformity, tensile strength, and dye uptake. The segment benefits from process control systems that minimize denier variability, a critical parameter for high-performance wearables. Aligning with sustainability targets, next-generation dry spinning lines reduce energy consumption by up to 20%, lowering specific carbon emissions. Alternative methods grouped under “Others” are projected to expand at a 6.08% CAGR through 2031 as solvent-free melt electrospinning and centrifugal techniques mature, albeit from a low base.
Emerging processes prioritize closed-loop solvent recovery and bio-based polymer integration, but scalability hurdles persist. Melt electrospinning’s promise of solvent elimination suits regulatory pressure on VOC emissions, yet faces fiber-uniformity challenges at industrial speeds. Centrifugal spinning delivers high throughput but falls short on fine-denier control required for premium intimates and medical devices. Accordingly, established dry-spinning producers invest in hybrid pilot lines while safeguarding their dominant positions through proprietary polyurethane formulations that embed specific elasticity-retention profiles.


By Application:
Medical Emerges as Growth EngineApparel remained the volume leader, accounting for 79.83% of the spandex market size in 2025. Nevertheless, medical uses are slated to clock a 6.22% CAGR, making healthcare the fastest-growing segment through 2031. Compression stockings, wound-dressing wraps, and orthopedic braces require tightly controlled modulus values, encouraging long-term supplier agreements and relatively stable pricing structures.
Beyond compression therapy, hospital supply chains increasingly specify antimicrobial spandex blends for postoperative garments, further expanding medical adoption. Other niche applications-industrial filters, automotive seat covers, and smart-textile substrates-provide additional demand optionality. Apparel growth in mature economies moderates as athleisure penetration approaches saturation, but performance differentiation through moisture management, UV resistance, and bio-derived content keeps the category integral to the long-run trajectory of the spandex market.
Geography Analysis
APAC Spandex Market
Asia-Pacific retained a 63.88% share of the spandex market size in 2025, underpinned by China’s integrated feedstock-to-fabric chain, South Korea’s advanced polymer research and development, and India’s expanding spinning capacity. Regional producers benefit from proximity to petrochemical clusters and dense export logistics networks. Yet Chinese overcapacity periodically depresses average selling prices, pushing mills to chase operational efficiency and product diversification. Environmental upgrades mandated by updated emission norms require capital expenditure that may accelerate regional consolidation.
MEA Spandex Market
The Middle-East and Africa are forecast to deliver the highest CAGR at 6.11% during 2026-2031. Egypt’s integrated textile park projects and Saudi Arabia’s Vision 2030 incentives attract overseas investors keen on duty-free access to European and U.S. markets. Competitive electricity tariffs and modern port infrastructure further elevate the region as an emerging spandex market production hub.
Europe and the Americas Spandex Market
The European Union’s Digital Product Passport and extended producer responsibility frameworks stimulate demand for low-impact elastomers and localized recycling loops. Nearshoring trends in Mexico and Central Europe offer quick-turn replenishment advantages that complement, rather than replace, Asia-centric bulk supply chains. South America, anchored by Brazil, shows moderate growth as domestic sportswear brands scale and public healthcare systems embrace compression therapies.

Value Chain Analysis
The spandex value chain starts with petrochemical inputs and increasingly bio-based inputs, with PTMEG and MDI as key feedstocks for polyurethane prepolymer synthesis and then fiber spinning, predominantly solution dry spinning (91.78% share in 2025). Producers differentiate through polymer formulation, solvent recovery, and consistent denier control. Vertical integration into BDO and PTMEG helps reduce exposure to upstream volatility, after TDI and MDI price swings in 2024-2025, and it also supports tighter cost and sustainability performance.
Downstream, spandex filament is processed into yarn and then enters textile mills for apparel (79.83% share in 2025), medical compression, and other technical uses, before reaching brand owners and converters, including hygiene product manufacturers. Capacity and consolidation dynamics in China influence the midstream ecosystem, and large-scale assets such as The LYCRA Company’s Yinchuan, Ningxia facility (opened November 2025, 30,000 tons initial capacity with plans to scale) reinforce supply concentration among leaders. Logistics and trade frictions affect delivered costs, with 2025 congestion reported at European ports including Hamburg, Antwerp, and Rotterdam, which raises the value of regionalized production footprints and multi-route distribution planning.
Competitive Landscape
The spandex market remains moderately consolidated. Scale economies in polyurethane synthesis and high-speed spinning lines protect incumbents from new entrants. Hyosung’s USD 1 billion investment in Vietnam to produce bio-based BDO exemplifies forward integration into greener feedstocks, reinforcing cost leadership while addressing customer sustainability scorecards. Regulatory compliance continues to act as both an entry barrier and a differentiator. Producers holding OEKO-TEX Standard 100 and ISO 14001 certifications gain preferred-supplier status among global brands. Patent filings on bio-derived diisocyanates and solvent-free spinning reached record highs in 2025, indicating that the innovation race is centered on lowering the environmental footprint while maintaining fiber performance.
Spandex Industry Leaders
HYOSUNG
Huafon Chemical Co., Ltd.
The LYCRA Company
Asahi Kasei Corporation
TAEKWANG INDUSTRIAL CO., LTD
- *Disclaimer: Major Players sorted in no particular order
Spandex Market Companies Covered in this Report
- Asahi Kasei Corporation
- Huafon Chemical Co., Ltd.
- HYOSUNG
- Indorama Corporation
- Jining Ruyi High-tech Fibre Co.,Ltd.
- Mitsui Chemicals, Inc.
- TAEKWANG INDUSTRIAL CO., LTD
- The LYCRA Company
- TK CHEMICAL CORPORATION
- TORAY INDUSTRIES, INC.
- Xiamen Lilong Spandex Co., Ltd.
- Yantai Tayho Advanced Materials Co., Ltd.

Market Opportunities and Future Outlook
Opportunities are centered on differentiated and low-carbon spandex that aligns with brand sustainability scorecards and growing product-traceability requirements, while continuing to meet performance needs for high-stretch apparel and medical compression. Hyosung’s shift toward bio-based feedstocks, including transitioning bio-based spandex feedstock from corn to sugarcane, supports procurement programs that require measurable carbon reductions and supply continuity at scale, with production at its Vietnam plant beginning in early 2026 (up to 50,000 tons cited in the report context).
On the supply side, the investment cycle is moving toward intelligent manufacturing and higher-performance grades rather than broad-based volume additions, which creates room for producers that can deliver consistent quality across a broad denier range with lower energy and solvent footprints. Huafeng Chemicals’ February 2026 announcement of a 3.6 billion yuan high-performance, low-carbon, digitalized spandex expansion in Ruian, and its June 2026 move to full production for its 250,000-ton differentiated spandex project, show how capacity is being targeted and what customers are being offered, including differentiation, efficiency, and carbon management. Regional localization also creates pathways for supplier partnerships with textile clusters in Asia-Pacific and in fast-growing Middle-East and Africa manufacturing bases, which can reduce lead times and help cushion disruptions tied to port congestion and trade actions affecting upstream intermediates.
Recent Industry Developments in Spandex Market
- June 2026: Huafon Chemical Co., Ltd. brought its 250,000-ton differentiated spandex project into full production, following trial production for the final phase in late 2025. The startup expands large-scale availability of higher-value grades and reinforces China’s role in setting global spandex pricing and availability across apparel and industrial uses.
- February 2026: Huafeng Chemicals announced a 3.6 billion yuan high-performance, low-carbon, digitalized spandex expansion in Ruian. The project is designed to strengthen differentiation and efficiency in the local supply chain, expanding capacity for high-end grades and supporting closer regional collaboration with fashion customers.
- May 2024: Hyosung TNC expanded CREORA spandex solutions for hygiene applications, highlighting performance attributes such as fit and leak protection for diaper and personal care products. This supported broader spandex adoption beyond apparel by aligning fiber development with converter productivity and comfort-driven product specifications.


Spandex Market Report Scope and Research Methodology
Market Definition and Coverage
For this study, the spandex market covers elastane fiber (a polyurethane-based fiber with at least 85% polyurethane) that is produced and sold for use in stretch fabrics across apparel, medical, and other end uses. We track this globally across major producing and consuming regions.
Scope exclusions: We exclude downstream fabric, garment, or finished-product revenues, only the spandex fiber market is counted.
Segments Covered in This Report
- By Production Method
- Solution Dry Spinning
- Solution Wet Spinning
- Others
- By Application
- Apparels
- Medical
- Other Applications
- By Geography
- Asia-Pacific
- China
- India
- Japan
- South Korea
- Rest of Asia-Pacific
- North America
- United States
- Canada
- Mexico
- Europe
- Germany
- United Kingdom
- France
- Italy
- Russia
- Rest of Europe
- South America
- Brazil
- Argentina
- Rest of South America
- Middle-East and Africa
- Saudi Arabia
- South Africa
- Rest of Middle-East and Africa
- Asia-Pacific
Data Sources, Market Sizing, and Validation
Desk Research
Desk research began by mapping how spandex fiber demand is created and measured, then listing the data series that can anchor the model year by year. We mainly used public sources such as UN Comtrade trade statistics, national customs and statistical offices, and industry and standards bodies such as ISO and ASTM to confirm definitions, typical units, and reporting conventions.
We also reviewed company annual reports, investor presentations, and plant expansion announcements to understand capacity additions, product mix, and regional supply shifts. For checks on technology direction and product innovation, we referenced patent databases and peer-reviewed polymer and textile journals. Where needed, we supplemented public information with paid database subscriptions focused on company financials and intelligence, and shipment-level import and export records to cross-check trade flows and timing. These examples are illustrative and not exhaustive, and other sources were also used for data collection, validation, and research clarification.
Primary Interviews and Surveys
Primary work focused on expert interviews and structured surveys with fiber producers, yarn and textile processors, distributors, and large buyers in apparel and medical supply chains across APAC, EMEA, and the Americas. Interview inputs were used to confirm utilization ranges, application mix shifts, and pricing behavior during tight and loose supply cycles, then to stress-test desk assumptions before finalizing the model.
Distribution of primary research fieldwork respondents
| Company type | Respondent position | Region |
|---|---|---|
| Top tier: 33% | CXOs: 16% | APAC: 43% |
| Mid tier: 46% | Functional/Unit leaders: 30% | EMEA: 37% |
| Smaller Players: 21% | Managers: 54% | Americas: 20% |
Market-Sizing & Forecasting
Sizing was built using a top-down and bottom-up logic. Capacity signals, trade balances, and end-use demand indicators were first used to reconstruct regional fiber consumption in tons, then rolled up into a global total. Because public production data can be incomplete, we corroborated the totals with selective bottom-up approximations such as supplier capacity roll-ups, sampled tons moving through key channels, and buyer-side checks on application demand.
The most decision-driving inputs were nameplate capacity by region, estimated operating rates, solution dry spinning share trends, the apparel versus medical demand mix, and export intensity for major producing countries. Where gaps appeared, we used conservative ranges reviewed with interviewees, then narrowed using trade statistics and known expansion start-up dates. Forecasting relied on scenario analysis, translating athleisure and performance wear demand, medical textiles stability, and planned capacity additions into volume growth paths that experts helped sanity-check for realism.
Data Validation & Update Cycle
Outputs were validated through checks that compared implied consumption with trade movements, reported capacity additions, and the direction of application mix shared by interviewees. If a region showed volume changes that did not align with utilization, trade, or demand signals, we re-tested the drivers and adjusted assumptions.
Before sign-off, the model and key inputs go through step-by-step analyst reviews, and re-contact is triggered when a critical input moves beyond an expected range. Reports are refreshed annually, with interim updates when material events occur such as large capacity starts, outages, or demand shocks. A final pre-delivery review is completed so clients receive the latest view.
Mordor Intelligence's Spandex Market Sizing Compared With Other Published Estimates
Published size estimates for spandex often do not match because some sources report value and others report volume, and conversion assumptions (price per ton, product purity, and currency timing) can move totals quickly. Differences also show up when the time window is not aligned, since some publications anchor to 2022 or 2024 even if the narrative discusses later years.
Some external figures include adjacent elastomeric materials or blend-level textile value that sits beyond the fiber itself, and a few rely on aggressive price growth to lift value forecasts. By counting only spandex fiber volumes in tons by production method, application, and geography, and then checking that utilization and trade flows support the year-by-year totals, Mordor Intelligence reduces scope and conversion noise.
Benchmark comparison
| Source | Market Size | Gaps in Research Methodology |
|---|---|---|
| Mordor Intelligence | USD 1.49 M (2026) | |
| Trade Journal A | USD 8.05 B (2022) | Value-based estimate anchored to 2022, and the implied average pricing and scope are not clearly reconciled to fiber tons, utilization, and trade movements. |
| Global Consultancy B | USD 6.80 B (2024) | Uses a value view for 2024, and differences can come from how blended textile value, price escalation, and currency timing are treated versus fiber-only counting. |
The table shows that the spread is mainly driven by unit choice (USD versus tons), base-year selection, and how pricing and adjacent scope are handled. When the market total is tied back to repeatable volume signals such as capacity, operating rates, and import-export balances, the final numbers are easier to audit and update as new expansions or demand shifts occur.


Key Questions Answered in the Report
How large is the spandex market in 2026?
The spandex market size reached 1.49 million tons in 2026 and is forecast to hit 1.96 million tons by 2031.
Which production method dominates the current supply?
Solution dry spinning delivers 91.78% of global output, thanks to its fiber-quality and energy-efficiency profile.
What is the fastest-growing application for spandex?
Medical compression garments are projected to grow at a 6.22% CAGR between 2026-2031, outpacing apparel.
Which region will grow quickest through 2031?
The Middle-East and Africa lead with a forecast 6.11% CAGR, supported by government-backed textile-cluster investments.
How are sustainability pressures shaping spandex innovation?
Producers are scaling bio-based diisocyanate chemistry and solvent-free spinning techniques to lower carbon footprints and meet EU sustainability mandates.
Page last updated on:


 Your data is secure and never sold or shared.


