
Market Overview
| Study Period | 2021 - 2031 |
|---|---|
| Forecast Data Period | 2026 - 2031 |
| Base Year Market Size (2025) | 150.93 gigawatt |
| Market Volume (2026) | 156.9 gigawatt |
| Market Volume (2031) | 190.55 gigawatt |
| Growth Rate (2026 - 2031) | 3.96 % |
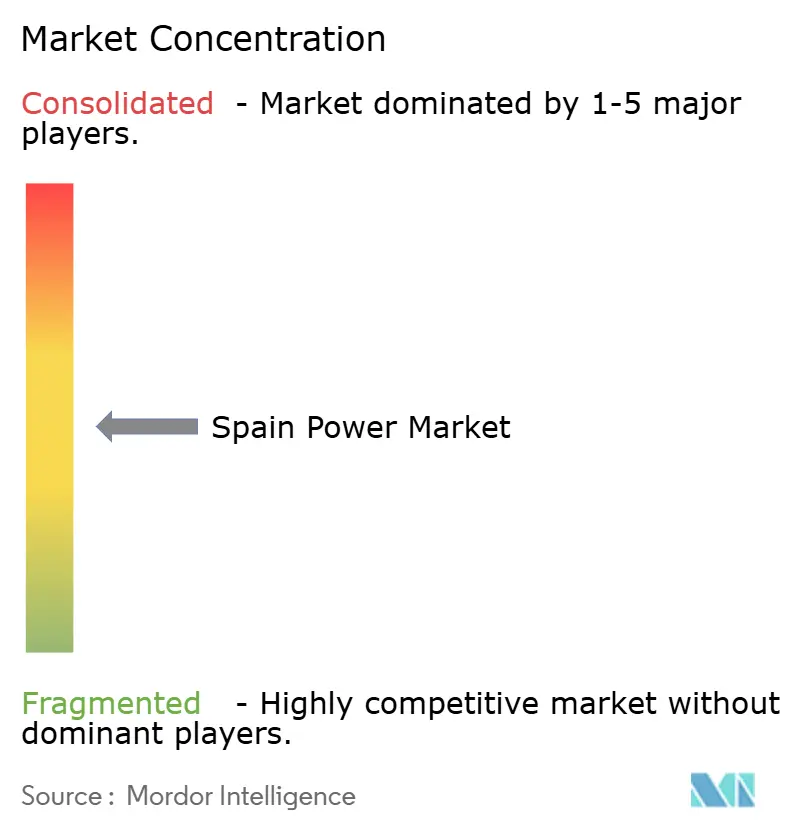
| Market Concentration | Medium |
Major Players *Disclaimer: Major Players sorted in no particular order Image © Mordor Intelligence. Reuse requires attribution under CC BY 4.0. | |
Spain Power Market Analysis by Mordor Intelligence
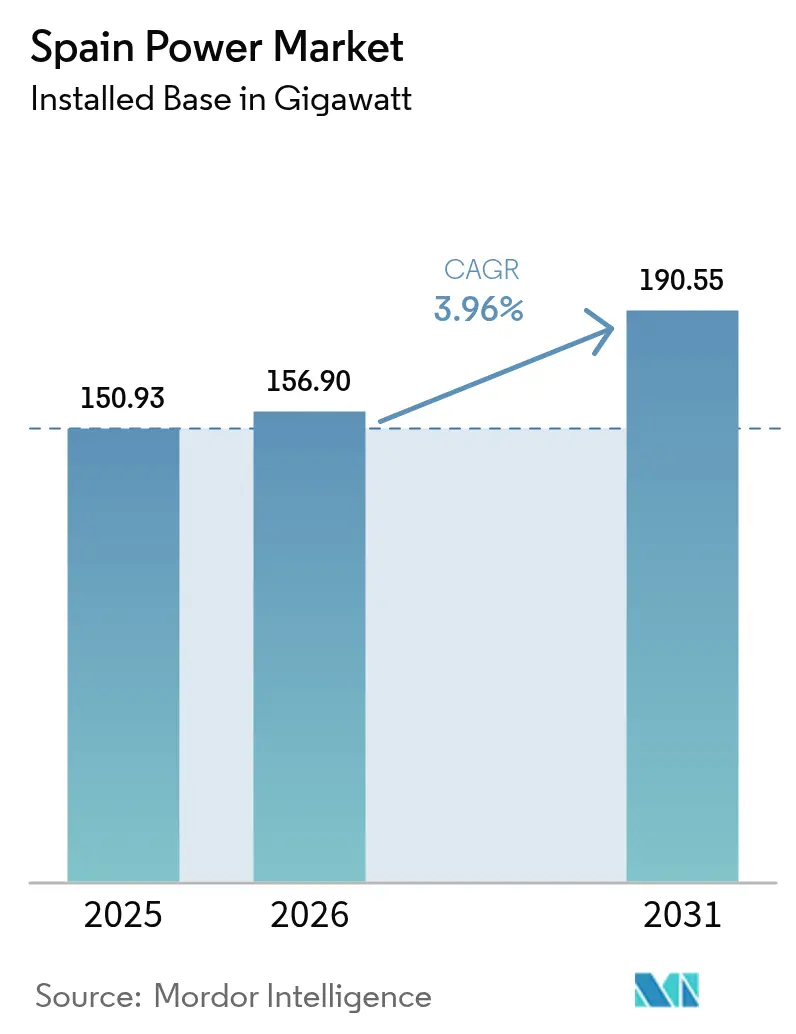
The Spain Power Market size is expected to grow from 150.93 gigawatt in 2025 to 156.9 gigawatt in 2026 and is forecast to reach 190.55 gigawatt by 2031 at 3.96% CAGR over 2026-2031.
The expansion is propelled by the country’s accelerated renewables build-out, EU decarbonization mandates, and strong corporate appetite for clean power purchase agreements. Solar PV became the nation’s single largest power source in 2024, confirming Spain’s pivot toward low-carbon generation. A grid-modernization agenda that prioritizes extra-high-voltage corridors, alongside EU-backed storage funding, is enabling ever-larger volumes of intermittent output to connect. Meanwhile, industrial electrification, e-mobility incentives, and data-center development are reshaping load profiles and sustaining demand for grid-connected renewables. Finally, the reversal of the nuclear phase-out adds baseload resilience and delays capacity-adequacy concerns while transmission upgrades catch up.
Key Report Takeaways
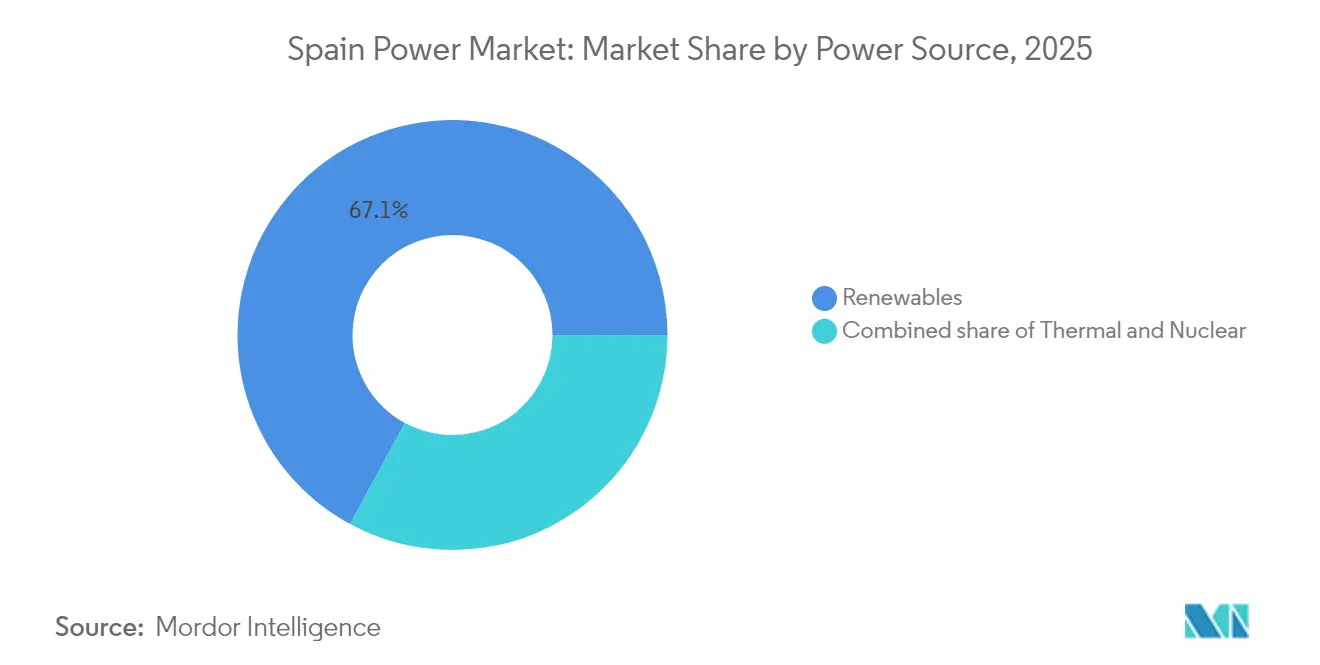
- By power source, renewables accounted for 67.10% Spain's power market in 2025, while solar photovoltaic capacity is advancing at a 6.95% CAGR through 2031.
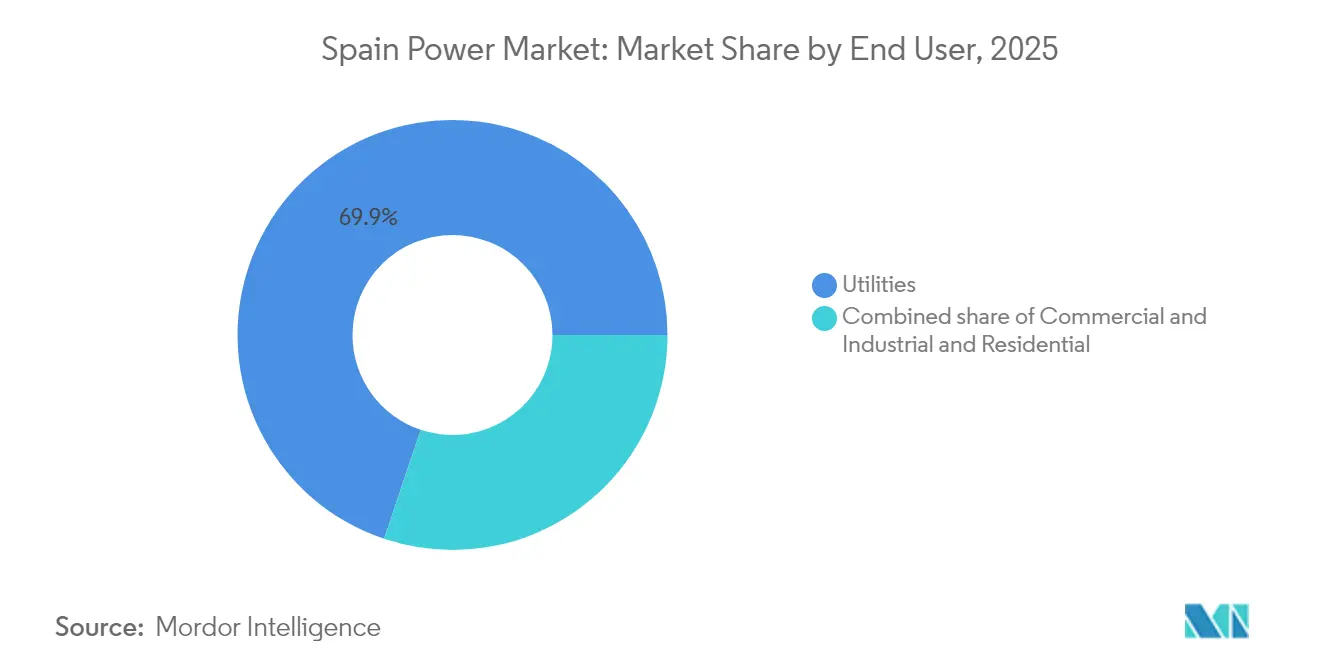
- By end user, utilities commanded a 69.85% share of the Spain power market size in 2025, whereas commercial and industrial buyers posted the fastest 6.65% CAGR to 2031.
Note: Market size and forecast figures in this report are generated using Mordor Intelligence’s proprietary estimation framework, updated with the latest available data and insights as of 2026.
Spain Power Market Trends and Insights
Drivers Impact Analysis*
| Driver | (~) % Impact on CAGR Forecast | Geographic Relevance | Impact Timeline |
|---|---|---|---|
| Accelerating grid-connected solar PV build-out | 1.80% | Andalusia, Extremadura, Castilla-La Mancha | Medium term (2–4 years) |
| Repowering of 1990s–2000s wind farms | 0.90% | Galicia, Castilla y León, Aragón | Short term (≤ 2 years) |
| Corporate PPAs led by hyperscale data centers | 0.70% | Madrid, Barcelona, Zaragoza clusters | Medium term (2–4 years) |
| EU Fit-for-55 & NECP-2030 mandates | 1.20% | Nationwide | Long term (≥ 4 years) |
| Rapid electrification of mobility & heating | 0.50% | Major urban and coastal regions | Long term (≥ 4 years) |
| EU funding for cross-border HVDC links | 0.40% | Northern and eastern export corridors | Medium term (2–4 years) |
| Source: Mordor Intelligence | |||
Accelerating Grid-Connected Solar PV Build-Out
Spain’s solar segment set a watershed in 2024 when it overtook gas and wind as the country’s top power source. Authorities cleared 26,159.2 MW of renewable construction in 2024, 22,326.1 MW of which is PV, underscoring cost declines, streamlined permitting, and corporate REC demand.(1)PV-Magazine, “Construction of 22.3 GW PV authorized in 2024,” pv-magazine.es Castilla y León, Aragón, and Castilla-La Mancha garnered the largest quotas, benefiting from superior irradiation and land availability. Distributed rooftop systems are likewise proliferating across industrial estates, cutting energy bills and Scope-2 emissions. Together, utility-scale and on-site arrays are raising the Spain electricity market’s renewable penetration, easing compliance with the 81% green-power target for 2030.
Corporate PPAs Led by Hyperscale Data-Center Entrants
Demand from hyperscale platforms is reshaping revenue models in the Spain electricity market. Google’s 35 MW, 10-year wind PPA, Amazon’s 469 MW solar commitment, and Apple’s 105 MW deal illustrate a shift toward developer-financed build-outs backstopped by tech majors.(2) Exus Renewables, “Google signs 35 MW wind PPA,” exusrenewables.com Data-center capacity could hit 600 MW in 2026 and 3,000 MW by 2030, sustaining multi-gigawatt renewable pipelines. PPAs provide bankable cash flows, lower financing costs, and dovetail with hyperscalers’ net-zero strategies, accelerating installations beyond traditional utility procurement volumes.
Rapid Electrification of Mobility & Heating
The MOVES III scheme, extended to December 2025 with an extra EUR 400 million, has funnelled EUR 2.735 billion into e-mobility to date.(3) La Moncloa, “Council of Ministers grid-reinforcement decree,” lamoncloa.gob.es Grants up to EUR 7,000 and 70% charger subsidies lifted EV registrations 48% year-on-year in January 2025, while 113,000 public and private charge points are operational. New metrological rules ensure billing accuracy, bolstering consumer trust. Heat-pump and induction-based industrial boilers are likewise multiplying, tilting demand toward electricity and raising load factors on the Spain electricity market’s distribution grids.
EU Fit-for-55 & NECP-2030 Decarbonisation Mandates
Spain’s NECP commits to 81% renewable electricity and 2.5–3.5 GW of new storage by 2030. Brussels endorsed a EUR 700 million storage aid scheme to mitigate intermittency and reinforce cross-border flows. Complementary policies span grid digitalization, efficiency standards, and interconnector build-outs that cement Spain’s role as the Southern-European renewables hub and anchor long-term confidence in the Spain electricity market.
Restraints Impact Analysis*
| Restraint | (~) % Impact on CAGR Forecast | Geographic Relevance | Impact Timeline |
|---|---|---|---|
| Escalating transmission upgrade CAPEX | -0.80% | Nationwide, acute in Andalusia & Castilla-La Mancha | Medium term (2–4 years) |
| Lengthy environmental & municipal permitting | -0.60% | Galicia, Castilla y León, Extremadura | Short term (≤ 2 years) |
| Rising curtailment risk in resource-rich areas | -0.40% | Andalusia, Castilla-La Mancha, Aragón | Short term (≤ 2 years) |
| Local opposition to on-shore wind siting | -0.30% | Galicia, Castilla y León rural districts | Medium term (2–4 years) |
| Source: Mordor Intelligence | |||
Escalating Transmission Upgrade CAPEX
Red Eléctrica budgets EUR 6.5 billion for reinforcements through 2026, yet identifies a EUR 10 billion need by 2030, leaving a EUR 3.5 billion gap. Tariff caps limit annual hikes to 15%, throttling cost recovery. Substation builds face land disputes, with 8 of 15 400-kV facilities delayed two years by legal appeals. Steel and copper inflation pushed line costs from EUR 1.2 million /km in 2020 to EUR 1.8 million /km in 2024. Absent reform, 5 TWh of renewable output could be shed each year by 2028, trimming effective solar utilization to 22%.
Lengthy Environmental & Municipal Permitting
Impact-assessment reviews averaged 48 months in 2024, double the timelines in France or Germany, because national, regional, and local authorities must each sign off. Galicia and Castilla y León wind projects need year-long avian studies under EU rules, stalling 900 MW in 2024. Rural councils increasingly demand higher community payments; Castilla-La Mancha renegotiated five solar deals at EUR 2 million per 100 MW, 50% above 2023 norms. A 50 MW fast-track helps smaller arrays, but most utility-scale plants exceed the threshold.
*Our forecasts treat driver/restraint impacts as directional, not additive. The impact forecasts reflect baseline growth, mix effects, and variable interactions.
Segment Analysis
By Power Source: Renewable Dominance Reshapes Generation Mix
Renewables accounted for 67.10% of installed capacity in 2025, and their 6.95% yearly advance ensures the Spain power market size for clean sources rises from 101.27 GW in 2025 to 150.66 GW in 2031. Solar photovoltaic eclipsed wind at 32.0 GW versus 32.0 GW in January 2025, propelled by low auction tariffs and 24% capacity factors. Repowering lifts onshore wind productivity without new land, while 2 GW of floating offshore leases open an untapped marine resource. Hydropower remains steady at 17 GW but suffers from lower reservoir levels that curb peak-shaving ability. Coal’s exit by 2027 and gas’s shift to peaking duty-free capacity for renewables will yet tighten reserve margins on low-wind, low-sun days.
Thermal fleets fell to 25.80% of capacity in 2025. Endesa’s coal phase-out removed 2 GW, slashing 12 million tpy of CO₂. Combined-cycle gas totals 24 GW but runs fewer hours as renewables scale, with hybrid storage enabling four-hour ramps. Nuclear stays flat at 7.1 GW through 2035, after which closures leave a 50 TWh gap to fill with imports or batteries. Biomass grows from 1.2 GW to a projected 1.8 GW by 2030 under circular-economy incentives. Together, this transformation underlines how the Spain power market pivots toward carbon-free technologies even as grid flexibility challenges mount.


By End User: Utilities Maintain Scale as C&I Demand Surges
Utilities owned 69.85% of 2025 capacity, translating to a dominant Spain power market share anchored by Iberdrola, Endesa, and Naturgy. Iberdrola’s USD 13 billion local program funds 4.2 GW of new solar and offshore wind, plus 500 MWh of batteries, reinforcing incumbent scale. Endesa redirects USD 1.6 billion from coal closures into 3.9 GW of renewables, while Naturgy pairs 800 MW of repowered wind with storage. Regulatory 15% premiums for projects above 100 MW keep the playing field skewed toward large portfolios that can monetize both energy and capacity revenues.
Commercial and industrial buyers post a 6.65% CAGR through 2031, lifting their Spain power market size from 33.44 GW to 49.2 GW as data-center PPAs proliferate. Amazon’s 1.1 GW deal signals hyperscalers rival utilities in procurement heft. Microsoft and Google follow with smaller, yet still material, tranches. Steel and cement firms add on-site solar to hedge volatile wholesale prices, with ArcelorMittal’s 50 MW rooftop array cutting grid purchases by 30%. Residential adoption remains slow at 8% of capacity despite a raised 500 kW export cap for multi-family buildings, revealing financing hurdles for distributed systems.
Geography Analysis
Spain’s autonomous communities display pronounced heterogeneity in demand growth, resource endowment, and policy execution. Catalonia, with 16.05% of national volume, matches industrial expansion to burgeoning renewable pipelines and attracts data-center campuses that lock in multi-decadal PPAs. Madrid and Valencia bolster overall activity through concentrated commerce and service sectors, complemented by dense EV-charging roll-outs that lift evening peak profiles. Distributed generation, battery aggregation, and flexible tariffs are tempering urban stresses and enabling smoother operation across the Spain power market.
Andalusia’s exceptional solar insolation underpins its 7.05% CAGR through 2031 and aligns with EU-funded storage clusters that safeguard voltage stability and unlock export revenues. Castilla-La Mancha and Castilla y León continue to host the lion’s share of utility-scale projects, capitalizing on land availability and upgraded 400 kV backbones. Regional governments are using renewable richness as a lever to court energy-intensive plants, ranging from green-steel mini-mills to ammonia synthesis, deepening local economic multipliers and diversifying loads within the Spain power market.
Galicia, Asturias, and Cantabria highlight the permitting conundrum: strong wind regimes juxtaposed with biodiversity concerns delay pipeline conversion and heighten curtailment of permitted capacity. These bottlenecks underscore the need for collaborative siting, early stakeholder engagement, and repowering of legacy assets. The Balearic and Canary archipelagos underscore islanded-grid challenges, where limited interconnection capacity necessitates synchronous condensers, battery-storage nodes, and demand-response schemes to accommodate rising renewable penetration in the Spain power market.
Regulatory Landscape
Spain's electricity sector is governed by Law 24/2013, with policy and planning led by MITECO, Red Electrica as the system operator, and CNMC as the independent regulator supervising electricity markets and setting transport and distribution methodologies.
In February 2026, Royal Decree 88/2026 updated the general framework for electricity supply and marketing and formalized demand aggregation in the rulebook. It clarifies rights and obligations for aggregators and strengthens consumer protection in retail. The 2025-2026 policy package reinforces system flexibility and consumer measures alongside network and tariff governance. In parallel, the February 2026 National Strategy against Energy Poverty 2026-2030 shifts support toward efficiency and cleaner energy access for vulnerable consumers, complementing ongoing reforms in market supervision and regulated charges led by CNMC in 2026.
Competitive Landscape
Spain’s power arena remains moderately concentrated: Endesa, Iberdrola, Naturgy, and EDP dominate generation and retail, while Acciona’s promotion from mid-tier to top-tier accentuates the pivot toward renewables. Together, the top four provide most capacity, pursue vertical integration, and marshal investment plans tailored to grids, renewables, and customer solutions that shape the Spain power market.
Iberdrola’s EUR 41 billion 2024-2026 program earmarks over EUR 21.5 billion for networks and EUR 15.5 billion for clean generation, consolidating its first-mover advantage. Endesa accelerates battery build-outs to firm its growing PV fleet, whereas Naturgy focuses on digital grid inspection and merchant solar. EDP expands corporate PPA offerings, complementing domestic growth with Iberian cross-border expertise. M&A remains selective; asset swaps target storage, hydrogen, and offshore concessions that fill portfolio gaps without overstretching balance sheets in the Spain power market.
Tech-driven entrants exploit white-space: battery aggregators bid into capacity auctions, hydrogen developers bundle long-term offtake with electrolyzer co-location, and EV-infrastructure platforms leverage SaaS billing to capture annuity revenue. These challengers raise competitive intensity and spur incumbents to diversify service lines, deepen customer engagement, and adopt faster capital-cycle models compatible with the Spain power market’s evolving risk-return profile.
Spain Power Industry Leaders
Iberdrola SA
Endesa S.A.
Naturgy Energy Group S.A.
EDP Group (EDP HC Energía)
Acciona Energía
- *Disclaimer: Major Players sorted in no particular order

Market Opportunities and Future Outlook
System-flexibility opportunities are expanding as Spain formalizes market routes for storage and demand-side participation. In May 2026, the European Commission approved a 10-year capacity mechanism for Spain that remunerates firm capacity from generation, storage, and demand-side resources. This improves bankability for batteries, hybrid renewable-plus-storage plants, and independent aggregation models.
Industrial self-consumption and green industrial projects are connecting generation, networks, and new demand pathways. In July 2026, MITECO launched an urgent hearing for a draft Royal Decree to speed renewables, industrial self-consumption, and storage integration. IDAE's RENOVAL 2 program allocated over EUR 162 million to 40 clean-tech manufacturing projects in 2026, with an emphasis on battery storage and grid technology. Spain is also advancing flexibility assets for constrained grids, including the Guimar pumped-storage project in Tenerife, with an estimated EUR 1 billion investment (July 2026). Royal Decree-Law 18/2026 (June 2026) tightens access and connection discipline.
Recent Industry Developments
- July 2026: Repsol and Masdar announced Masdar will acquire a 49.99% stake in a 705 MW operational renewables portfolio in Spain. The transaction supports cross-border collaboration and expands international investor participation in Spanish renewables. This action backs ongoing asset-rotation strategies and helps attract capital for new build and hybrid projects.
- June 2025: Spain's Council of Ministers approved an urgent package to reinforce the electricity system and grid resilience, expanding CNMC oversight and introducing tools to improve system flexibility. The measure supports faster operational coordination and network reliability as renewable penetration grows.
- April 2024: The Spanish government modified the national electricity planning framework to align network development with the pace of renewable integration. The change strengthens the link between transmission build-out and new generation connections and clarifies system operator execution and regulatory approvals tied to grid expansion.


Research Methodology Framework and Report Scope
Market Definition and Coverage
For this study, the Spain power market is defined as the country's installed electricity generation capacity, measured in gigawatts, across the operating fleet connected to the national power system.
Scope exclusions: Retail electricity revenue, network service revenue, and electricity trading value are excluded since the market is sized in capacity rather than money terms.
Segmentation Overview
- By Power Source
- Thermal (Coal, Natural Gas, Oil and Diesel)
- Nuclear
- Renewables (Solar, Wind, Hydro, Geothermal, Biomass & Waste, Tidal)
- By End User
- Utilities
- Commercial and Industrial
- Residential
- By T&D Voltage Level (Qualitative Analysis only)
- High-Voltage Transmission (Above 230 kV)
- Sub-Transmission (69 to 161 kV)
- Medium-Voltage Distribution (13.2 to 34.5 kV)
- Low-Voltage Distribution (Up to 1 kV)
Data Sources, Market Sizing, and Validation
Desk Research
Desk work started with building a clean view of Spain's capacity base, project pipeline, and technology split. We relied on public system and policy sources, including grid operator reporting, the national energy regulator's statistics, Eurostat energy balances, and energy ministry planning documents that describe targets, auctions, and permitting direction.
We then cross-checked those public numbers against widely available company disclosures, annual reports, investor decks, and credible press coverage on commissioning delays and repowering activity. Where useful, we also used paid subscriptions for company financials and intelligence, plus patent databases, to understand where equipment activity was shifting. The desk sources listed here are illustrative, and other public documents and datasets were also used to validate totals and clarify definitions.
Primary Interviews and Surveys
To reduce gaps left by desk sources, we ran expert interviews and surveys across the power value chain, including project developers, utilities, engineering teams, and sector advisors. The discussions were used to confirm commissioning timing, typical derating and retirement behavior, and how projects move from announcement to grid connection within Spain.
Distribution of primary research fieldwork respondents
| Company type | Respondent position |
|---|---|
| Top tier: 30% | CXOs: 12% |
| Mid tier: 49% | Functional/Unit leaders: 38% |
| Smaller Players: 21% | Managers: 50% |
Market-Sizing & Forecasting
The core model is a top-down capacity build, where Spain's national installed capacity is reconstructed by technology using official time series, then carried forward through additions and retirements. To keep totals realistic, we corroborated the outcome with selective bottom-up checks, such as sampling major plant additions, reviewing project pipeline conversion rates, and using ASP x volume style sense checks on equipment volumes where they supported the build plan.
Key inputs included announced and awarded capacity additions, grid connection and commissioning timelines, retirements and repowering activity, and policy indicators such as renewable targets and auction schedules. Forecasts were built using scenario analysis on build-out pace, then adjusted with interview feedback on bottlenecks like permitting, grid access, and supply availability. When project-level visibility was weak, conservative conversion factors were applied first, then revised only after additional validation.
Data Validation & Update Cycle
Results were validated through multiple checks, including year-on-year capacity change reconciliation, technology mix consistency, and outlier review for unusually large jumps tied to single projects. We also compared model outputs with independent signals such as commissioning announcements, regulator statistics, and utility reporting, and then re-contacted sources when timing assumptions did not align.
The report is refreshed annually, and interim updates are made when material events occur, such as major policy shifts or large project slippage. Before delivery, we perform a final scan of the latest public releases so the published numbers reflect the most current view available at the time.
Mordor Intelligence's Spain Power Market Size Versus Other Published Estimates
Published market sizes for Spain's power sector often show wide variation because some sources express the market in revenue, while others express it in installed capacity, and the two are not interchangeable. Differences also come from timing choices, since capacity snapshots shift when large projects are commissioned late in the year.
A refresh-led gap is common in this market because newer build and retirement signals can change the capacity base quickly, while older revenue-style models can still rely on prior-year tariffs, demand, and currency conversion points. By locking the market to a capacity definition and re-checking late-year commissioning against the latest public system updates, the spread narrows. This is the approach applied in Mordor Intelligence.
Benchmark comparison
| Source | Market Size | Gaps in Research Methodology |
|---|---|---|
| Mordor Intelligence | USD 150.93 B (2025) | |
| Global Consultancy A | USD 44.94 B (2026) | This figure is built as market revenue for the full electricity value chain, so tariffs, demand, and currency timing drive the number, and capacity additions are only an indirect input. |
| Regional Consultancy B | USD 40.00 B (2024) | This estimate is presented as a value-based market snapshot without a clear installed-capacity boundary, which can understate the impact of recent commissioning and retirement updates. |
The table shows that the largest differences come from mixing a capacity metric with revenue metrics, and from using different timing assumptions around the latest year's changes. Our method stays traceable because each step ties back to capacity additions, retirements, and commissioning timing that can be checked and repeated.


Key Questions Answered in the Report
How large is the Spain power market in 2026, and what is the growth outlook?
Installed capacity stands at 156.9 GW in 2026 and is forecast to reach 190.55 GW by 2031 at a 3.96% CAGR.
Which segment holds the largest Spain power market share today?
Renewables command 67.10% of capacity, led by solar photovoltaic installations.
Why are corporate PPAs important for future generation growth?
Hyperscale data-center operators such as Amazon procure multi-GW renewable contracts, accelerating project financing while locking in demand at below-wholesale prices.
What infrastructure challenges threaten Spain's renewable build-out?
Transmission upgrades lag plant additions, creating congestion that could curtail up to 7% of generation by 2026 if funding gaps persist.
How will Spain replace coal and aging nuclear output?
Accelerated solar and wind additions, repowering of existing wind farms, and 22 GWh of planned grid-scale batteries are expected to fill the post-coal and post-nuclear supply gap.
Page last updated on:


 Your data is secure and never sold or shared.


