| Study Period | 2018 - 2030 |
| Base Year For Estimation | 2024 |
| Forecast Data Period | 2025 - 2030 |
| Market Volume (2025) | 0.98 Thousand MW |
| Market Volume (2030) | 1.36 Thousand MW |
| CAGR | 6.68 % |
| Market Concentration | Low |
Major Players*Disclaimer: Major Players sorted in no particular order |

Spain Data Center Market Analysis
The Spain Data Center Market size is estimated at 0.98 thousand MW in 2025, and is expected to reach 1.36 thousand MW by 2030, growing at a CAGR of 6.68%. Further, the market is expected to generate colocation revenue of USD 963.8 Million in 2025 and is projected to reach USD 1,716.5 Million by 2030, growing at a CAGR of 12.24% during the forecast period (2025-2030).
Spain's strategic geographical position has established it as a crucial digital infrastructure hub, connecting the Americas to the west, Africa to the south, and the Middle East and Asia to the east. The country's data center market is experiencing significant transformation driven by increasing digitalization across industries. Madrid, as the third-largest metropolitan region in Europe after London and Paris, has emerged as a prime location for data center investments. The city hosts over 20,554 companies as of 2022, with 99% being SMEs, creating substantial demand for data center infrastructure and storage facilities. This concentration of businesses, combined with Spain's role as a connectivity crossroads, has attracted major cloud service providers and data center operators to the region.
The market is witnessing a notable shift toward higher-tier data center facilities, reflecting the increasing sophistication of enterprise requirements. Tier 3 and Tier 4 facilities are expected to dominate the market by 2029, collectively holding a 99.3% market share. This transition is driven by enterprises' growing need for enhanced reliability, reduced downtime, and superior infrastructure capabilities. Large businesses are particularly drawn to Tier 4 data centers due to their fault-tolerant capabilities and 99.99% uptime guarantee, while Tier 3 facilities remain popular among a broader range of users due to their balanced offering of reliability and cost-effectiveness.
The financial services sector is emerging as a key driver of data center demand, with neo-banking expected to reach USD 138.5 billion by 2027. Digital payment adoption continues to accelerate, with user numbers projected to reach 40.6 million by 2027. This digital transformation in the financial sector is complemented by the broader adoption of cloud data center services, with major providers like AWS developing new cloud regions in Madrid with three availability zones. The increasing integration of financial technology and digital services is creating sustained demand for robust data center infrastructure.
The market is experiencing a significant shift toward hyperscale data center facilities, particularly in Madrid and other major cities. These facilities are designed to meet the growing demands of cloud service providers, content delivery networks, and large enterprises requiring substantial computing resources. The industry's focus on environmental sustainability is evident in the adoption of energy-efficient technologies and renewable energy sources, with many facilities implementing advanced cooling systems and power management solutions. This trend aligns with Spain's broader digital transformation initiatives, including the Digital Spain 2026 roadmap, which aims to enhance the country's digital infrastructure and connectivity capabilities.
Spain Data Center Market Trends
Rising smartphone ownership and increase in number of app downloads boost the market growth
- The total number of smartphone users in the country was 42.51 million in 2022, which is expected to reach 46.6 million by 2029, witnessing a CAGR of 1.3% during the forecast period. In Spain, digital usage is growing quickly. The swift uptake of the internet and mobile technology in a range of enterprises has had an impact on consumer behavior. Consumer spending in Spain was USD 802.79 billion in 2021, a 12.04% increase from 2020. Thus, more people can now buy smartphones, increasing the usage of smartphones.
- Over the next several years, it is anticipated that when 5G technology is deployed throughout Spain, a greater proportion of people will have smartphones that can use the new technology. Spain has four operators: Movistar, Orange, Vodafone, and Yoigo, which have 5G customers. With a 5G smartphone and a 5G tariff plan, consumers on these operators' networks spent 9.6-10.6% of their time connected to a 5G network.
- The pandemic accelerated Spain's move toward digitalization. WhatsApp was the social media platform 95.05% of Spaniards utilized, followed by Instagram, Facebook, and YouTube. They spent three to four hours a day on these applications. In order to maintain contactless services, public and private organizations switched to digital platforms, which increased the need for data center services in Spain.
- This tendency has been especially noticeable in the financial sector, as Spaniards are becoming more dependent on online banking. For instance, compared to 17.3% before the pandemic, 36.4% of banking service users now utilize their online banking applications every day or virtually daily. As a result, the number of data centers in Spain has increased due to the large amount of data generated by smartphones.

Understand The Key Trends Shaping This Market
Download PDF
Increase usage of FTTx broadband and fiber optic network lead to market demand
- The maximum speed of a copper-based internet connection is 62.8 Mbps, whereas the maximum speed of a fiber-optic internet connection is 134.6 Mbps. Compared to the expected speed of 1,342 Mbps in 2029, the FTTx broadband data speed in 2022 stood at 159.2 Mbps. The goal of data centers' efforts to become faster is to provide higher network connections and simple and flexible scalability as bandwidth demands change on a moment-by-moment basis. More people use the internet, which necessitates data storage that is increasing in size and boosting the volume of processing facilities.
- DSL remained the most prevalent technology in Spain till 2020, while its connectivity has decreased since then. The decline of DSL networks demonstrated that Spanish operators prioritize brand-new FTTP deployments over upgrading copper networks. The trend of declining DSL coverage is the result of both targeted decommissioning and a rise in the number of households. By 2020, 84.9% of homes had access to FTTP broadband services, owing to Spanish operators' expansion of their FTTP network infrastructure, which saw a 4.6% increase in FTTP coverage.
- Three major operators control the majority of Spain's extensive fiber optic network. Telecom companies better fulfill users' rising bandwidth demands with a quicker network. In terms of gigabit-speed connectivity, Spain is among the top countries, owing to the ongoing improvements in FTTP availability. The Spanish national broadband plan focused primarily on rural areas, given an already high FTTP coverage in urban areas, which is the driving rural FTTP coverage and expansion.

OTHER KEY INDUSTRY TRENDS COVERED IN THE REPORT
- Increasing users of social networking sites and availability of high-speed internet incrrases the market demand
- High penetration rate of FTTH network and government initiatives towards Programa de Extensión de la Banda Ancha (PEBA, Broadband Extension Program) leads to the market growth
- High levels of broadband and fiber cable connections increases the data speed leading to market demand
Segment Analysis: Data Center Size
Mega Segment in Spain Data Center Market
The mega data center size segment dominates the Spain data center market share, commanding approximately 47% market share in 2024, with a total IT load capacity of 443.79 MW. This segment's prominence is driven by the increasing demand for large network, storage, and server capacity to support retail financial centers, ATMs, and active online accounts. Major construction locations include Madrid and Barcelona, with companies like Interxion (Digital Realty) operating mega data centers with significant capacities. The segment is experiencing robust growth at a CAGR of around 17% during 2024-2029, supported by numerous companies such as Global Switch and Iron Mountain that are expected to drive the growth of mega-sized data centers. The combined capacity of facilities currently under construction is projected to surpass 20 MW by 2029, further solidifying the segment's market leadership.
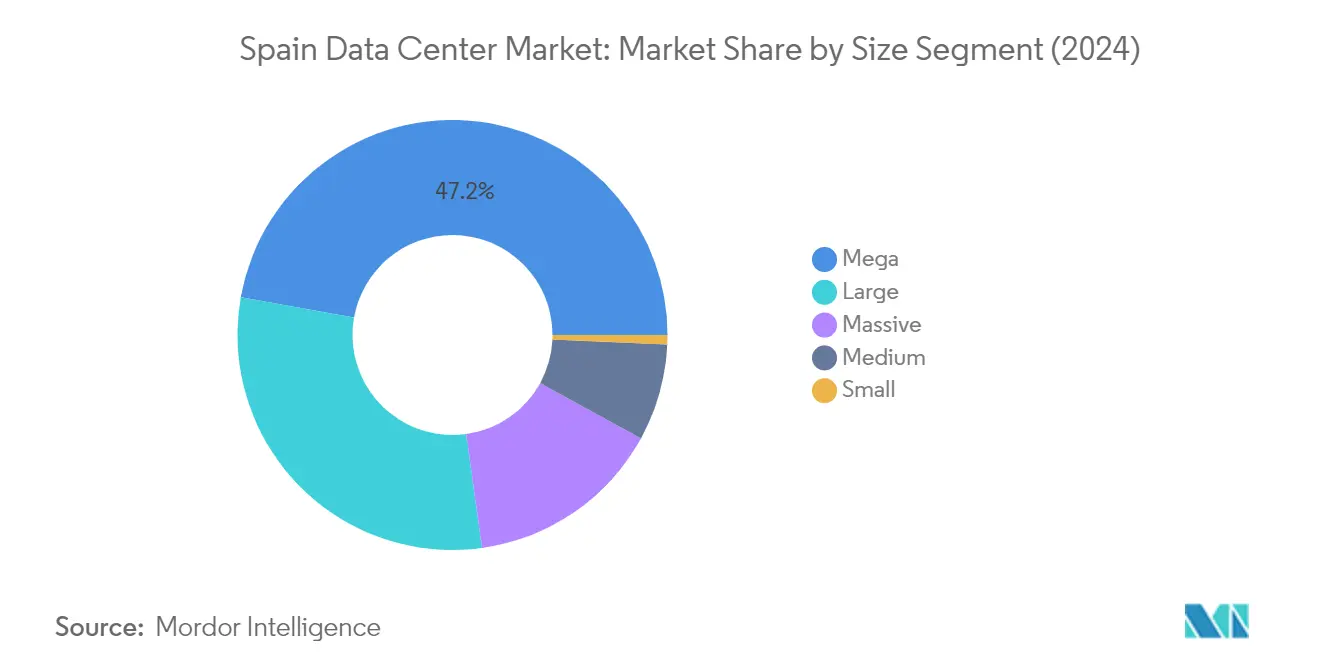
Remaining Segments in Data Center Size Market
The large data center size segment represents the second-largest category in the market, followed by massive, medium, and small data centers. Large data centers cater to diverse industry verticals with multiple facilities spread across key locations, while massive data centers focus on providing concentrated computing power in strategic locations. Medium-sized facilities serve as regional data processing centers, offering balanced capabilities for mid-sized enterprises. Small data centers, though limited in capacity, play a crucial role in serving local businesses and specific industry requirements. These segments collectively provide a comprehensive ecosystem that supports various business needs, from local operations to regional data processing requirements.
Segment Analysis: Tier Type
Tier 3 Segment in Spain Data Center Market
Tier 3 data centers dominate the Spanish data center market, commanding approximately 67% market share in 2024. The segment's prominence is driven by its optimal balance of reliability and cost-effectiveness, making it particularly attractive for enterprises requiring high availability without the premium costs of Tier 4 facilities. These data centers offer concurrent maintainability features and N+1 redundancy across critical components, ensuring 99.982% uptime. Madrid hosts the country's largest concentration of Tier 3 facilities, with a market share exceeding 70% of all Tier 3 data centers, followed by other regions in Spain. Major operators like Interxion (Digital Realty) and Global Switch lead this segment with significant facilities in Madrid, offering capacities of 79.52 MW and 39 MW respectively.
Tier 4 Segment in Spain Data Center Market
The Tier 4 segment is experiencing the most rapid expansion in the Spanish data center market, with a projected growth rate of approximately 14% from 2024 to 2029. This robust growth is primarily driven by increasing demand from hyperscale colocation data center services and major cloud providers requiring the highest levels of reliability and uptime. Tier 4 facilities are distinguished by their fault-tolerant infrastructure, complete redundancy in power and cooling systems, and superior uptime guarantee of 99.995%. The segment is witnessing significant construction activity, with numerous companies such as Equinix, Iron Mountain, and Nixval actively developing new Tier 4 certified facilities. These upcoming constructions are predominantly concentrated in the Madrid region, reflecting the growing preference for maximum reliability and redundancy in data center operations.
Remaining Segments in Tier Type
The Tier 1 and Tier 2 segments represent the basic level of data center infrastructure in Spain, primarily serving small and medium enterprises with minimal IT load requirements. These facilities offer single power and cooling paths with limited redundancy, making them suitable for organizations with basic computing needs and lower uptime requirements. While these tiers provide cost-effective solutions for smaller businesses, their market influence continues to diminish as enterprises increasingly prioritize higher reliability and uptime guarantees. Major providers in this segment, including Aire Networks and Adam, focus on serving SMEs requiring minimal IT loads at affordable prices, though the segment shows minimal growth potential due to the market's shift toward higher tier facilities.
Segment Analysis: Absorption
Utilized Segment in Spain Data Center Absorption Market
The utilized segment dominates the Spain data center absorption market, accounting for approximately 74% of the total IT load capacity in 2024. This significant market share is driven by the increasing adoption of data center services across various sectors, including cloud, e-commerce, BFSI, telecom, and other industries. The segment's dominance is particularly evident in Madrid, which maintains about a 76% occupancy rate, showcasing the strong demand for data center facilities in the region. The widespread deployment of hyperscale facilities, coupled with the growing presence of retail and wholesale colocation data center services, continues to strengthen the utilized segment's position in the market. The segment's robust performance is further supported by Spain's position as the fourth largest e-commerce market in the European Union, with over 26 million customers driving the demand for data center services.
Utilized Segment Growth in Spain Data Center Absorption Market
The utilized segment is experiencing remarkable growth in the Spain data center absorption market, driven by several key factors. The segment's expansion is fueled by the rapid adoption of cloud-based services, increasing digitalization across industries, and the growing demand for data processing capabilities. The growth is particularly notable in the hyperscale and wholesale colocation sectors, where major cloud providers and enterprises are expanding their presence. The segment's growth is further accelerated by Spain's strategic position as an interconnection hub, attracting significant investments from international data center operators. The increasing deployment of 5G technology throughout Spain, coupled with the rising smartphone adoption rate, is creating additional demand for data center services, contributing to the segment's expansion.
Remaining Segments in Data Center Absorption Market
The non-utilized segment represents the remaining portion of the Spain data center absorption market. This segment primarily consists of vacant rack space and unused IT load capacity within existing data center facilities. While the non-utilized segment plays a crucial role in providing expansion opportunities and maintaining operational flexibility, its share is gradually declining as data center operators optimize their facility utilization rates. The segment serves as a strategic reserve for future growth, allowing data center providers to quickly accommodate sudden increases in demand or new client requirements. The presence of non-utilized capacity also enables data center operators to maintain competitive pricing and service quality while ensuring sufficient room for technological upgrades and infrastructure improvements.
Spain Data Center Industry Overview
Top Companies in Spain Data Center Market
The data center market in Spain is characterized by continuous infrastructure expansion and technological advancement among key players. Companies are actively investing in expanding their facilities with increased IT load capacities and enhanced power densities to meet growing demand. Operators are focusing on implementing energy-efficient systems and obtaining environmental certifications to align with sustainability goals. Strategic partnerships with telecom providers and internet exchanges are being prioritized to improve data center services offerings. Facility modernization efforts include upgrading to advanced cooling systems, implementing enhanced security measures, and achieving higher tier certifications. Companies are also expanding their geographical presence beyond Madrid into emerging hubs like Barcelona and other regions, while simultaneously developing specialized data center solutions for different industry verticals.
Market Dominated by Global Infrastructure Specialists
The Spanish data center market exhibits a mix of global infrastructure providers and specialized colocation data center operators, with international players holding significant market share. Major global operators like Digital Realty (through Interxion), Equinix, and Global Switch have established strong positions through their extensive infrastructure networks and comprehensive service portfolios. These companies leverage their international expertise and financial resources to maintain competitive advantages in areas such as facility design, operational efficiency, and service quality. The market structure shows moderate consolidation, with the top players controlling substantial capacity share while smaller specialized providers serve specific regional or industry niches.
The market is experiencing ongoing consolidation through strategic acquisitions and partnerships, particularly as global operators seek to strengthen their presence in the Spanish market. Companies are pursuing both horizontal integration to expand geographic coverage and vertical integration to enhance data center management capabilities. Local operators are increasingly becoming acquisition targets for larger international players looking to quickly establish or expand their Spanish footprint. This consolidation trend is reshaping the competitive landscape while raising entry barriers for new market participants, although opportunities remain in emerging regional markets and specialized service segments.
Innovation and Sustainability Drive Future Success
Success in the Spanish data center market increasingly depends on operators' ability to balance infrastructure scalability with sustainability initiatives. Market leaders are strengthening their positions by investing in renewable energy solutions, implementing advanced cooling technologies, and developing energy-efficient facilities. Companies must also focus on strategic location selection, considering factors such as power availability, connectivity options, and proximity to major business centers. Building strong relationships with local authorities and utility providers while maintaining compliance with evolving environmental regulations has become crucial for sustainable growth.
For emerging players and market contenders, differentiation through specialized services and regional focus presents viable growth strategies. Success factors include developing expertise in specific industry verticals, offering flexible colocation options, and providing value-added services such as enhanced security solutions or industry-specific compliance capabilities. Companies must also consider the increasing demand for edge computing facilities and the growing importance of data sovereignty requirements. The ability to adapt to changing customer needs, particularly in sectors like cloud services, financial services, and digital media, while maintaining competitive pricing structures, will be critical for market success.
Spain Data Center Market Leaders
-
Acens Technologies SL
-
Equinix Inc.
-
EXA Infrastructure
-
Interxion (Digital Reality Trust Inc.)
-
T-Systems International GmbH
- *Disclaimer: Major Players sorted in no particular order

Need More Details on Market Players and Competiters?
Download PDF
Spain Data Center Market News
- December 2022: EXA Infrastructure invested in the Iberian Peninsula with a terrestrial transport route connecting Spain and Lisbon to EXA’s Spanish backbone. The new northern route fulfills customer demand across the Iberian Peninsula by connecting to European data center hubs.
- October 2022: Equinix opened an IBX facility called MD6, with an area of 1,466 sq. m (15,780 sq. ft) and a power of 4.8 MW, offering 600 racks.
- May 2022: Interxion expanded its Mediterranean presence in Barcelona with the development of a new colocation and connectivity hub. The land parcel can house 15 MW of total installed IT power. Construction was to begin in 2022 and be completed in 2024.
Free With This Report
We provide a complimentary and exhaustive set of data points on the country and regional level metrics that present the fundamental structure of the industry. Presented in the form of 50+ free charts, the sections cover difficult to find data on various countries on smartphone users, data traffic per smartphone, mobile and broadband data speed, fiber connectivity network, and submarine cables.


Spain Data Center Market Report - Table of Contents
1. EXECUTIVE SUMMARY & KEY FINDINGS
2. REPORT OFFERS
3. INTRODUCTION
- 3.1 Study Assumptions & Market Definition
- 3.2 Scope of the Study
- 3.3 Research Methodology
4. MARKET OUTLOOK
- 4.1 It Load Capacity
- 4.2 Raised Floor Space
- 4.3 Colocation Revenue
- 4.4 Installed Racks
- 4.5 Rack Space Utilization
- 4.6 Submarine Cable
5. Key Industry Trends
- 5.1 Smartphone Users
- 5.2 Data Traffic Per Smartphone
- 5.3 Mobile Data Speed
- 5.4 Broadband Data Speed
- 5.5 Fiber Connectivity Network
-
5.6 Regulatory Framework
- 5.6.1 Spain
- 5.7 Value Chain & Distribution Channel Analysis
6. MARKET SEGMENTATION (INCLUDES MARKET SIZE IN VOLUME, FORECASTS UP TO 2030 AND ANALYSIS OF GROWTH PROSPECTS)
-
6.1 Hotspot
- 6.1.1 Madrid
- 6.1.2 Rest of Spain
-
6.2 Data Center Size
- 6.2.1 Large
- 6.2.2 Massive
- 6.2.3 Medium
- 6.2.4 Mega
- 6.2.5 Small
-
6.3 Tier Type
- 6.3.1 Tier 1 and 2
- 6.3.2 Tier 3
- 6.3.3 Tier 4
-
6.4 Absorption
- 6.4.1 Non-Utilized
- 6.4.2 Utilized
- 6.4.2.1 By Colocation Type
- 6.4.2.1.1 Hyperscale
- 6.4.2.1.2 Retail
- 6.4.2.1.3 Wholesale
- 6.4.2.2 By End User
- 6.4.2.2.1 BFSI
- 6.4.2.2.2 Cloud
- 6.4.2.2.3 E-Commerce
- 6.4.2.2.4 Government
- 6.4.2.2.5 Manufacturing
- 6.4.2.2.6 Media & Entertainment
- 6.4.2.2.7 Telecom
- 6.4.2.2.8 Other End User
7. COMPETITIVE LANDSCAPE
- 7.1 Market Share Analysis
- 7.2 Company Landscape
-
7.3 Company Profiles (includes Global Level Overview, Market Level Overview, Core Business Segments, Financials, Headcount, Key Information, Market Rank, Market Share, Products and Services, and Analysis of Recent Developments).
- 7.3.1 Acens Technologies SL
- 7.3.2 Adam Ecotech SA
- 7.3.3 Data4
- 7.3.4 Digital Data Centre Bidco SL (Nabiax)
- 7.3.5 Equinix Inc.
- 7.3.6 EXA Infrastructure
- 7.3.7 Global Switch Holdings Limited
- 7.3.8 Interxion (Digital Reality Trust Inc.)
- 7.3.9 NetActuate Inc.
- 7.3.10 T-Systems International GmbH
- 7.3.11 VPS House Technology Group LLC
- 7.3.12 Zenlayer Inc.
- 7.4 LIST OF COMPANIES STUDIED
8. KEY STRATEGIC QUESTIONS FOR DATA CENTER CEOS
9. APPENDIX
-
9.1 Global Overview
- 9.1.1 Overview
- 9.1.2 Porter’s Five Forces Framework
- 9.1.3 Global Value Chain Analysis
- 9.1.4 Global Market Size and DROs
- 9.2 Sources & References
- 9.3 List of Tables & Figures
- 9.4 Primary Insights
- 9.5 Data Pack
- 9.6 Glossary of Terms
You Can Purchase Parts Of This Report. Check Out Prices For Specific Sections
Get Price Break-up Now
List of Tables & Figures
- Figure 1:
- VOLUME OF IT LOAD CAPACITY, MW, SPAIN, 2018 - 2030
- Figure 2:
- VOLUME OF RAISED FLOOR AREA, SQ.FT. ('000), SPAIN, 2018 - 2030
- Figure 3:
- VALUE OF COLOCATION REVENUE, USD MILLION, SPAIN, 2018 - 2030
- Figure 4:
- VOLUME OF INSTALLED RACKS, NUMBER, SPAIN, 2018 - 2030
- Figure 5:
- RACK SPACE UTILIZATION, %, SPAIN, 2018 - 2030
- Figure 6:
- COUNT OF SMARTPHONE USERS, IN MILLION, SPAIN, 2018 - 2030
- Figure 7:
- DATA TRAFFIC PER SMARTPHONE, GB, SPAIN, 2018 - 2030
- Figure 8:
- AVERAGE MOBILE DATA SPEED, MBPS, SPAIN, 2018 - 2030
- Figure 9:
- AVERAGE BROADBAND SPEED, MBPS, SPAIN, 2018 - 2030
- Figure 10:
- LENGTH OF FIBER CONNECTIVITY NETWORK, KILOMETER, SPAIN, 2018 - 2030
- Figure 11:
- VOLUME OF IT LOAD CAPACITY, MW, SPAIN, 2018 - 2030
- Figure 12:
- VOLUME OF HOTSPOT, MW, SPAIN, 2018 - 2030
- Figure 13:
- VOLUME SHARE OF HOTSPOT, %, SPAIN, 2018 - 2030
- Figure 14:
- VOLUME SIZE OF MADRID, MW, SPAIN, 2018 - 2030
- Figure 15:
- VOLUME SHARE OF MADRID, MW, HOTSPOT, %, SPAIN, 2018 - 2030
- Figure 16:
- VOLUME SIZE OF REST OF SPAIN, MW, SPAIN, 2018 - 2030
- Figure 17:
- VOLUME SHARE OF REST OF SPAIN, MW, HOTSPOT, %, SPAIN, 2018 - 2030
- Figure 18:
- VOLUME OF DATA CENTER SIZE, MW, SPAIN, 2018 - 2030
- Figure 19:
- VOLUME SHARE OF DATA CENTER SIZE, %, SPAIN, 2018 - 2030
- Figure 20:
- VOLUME SIZE OF LARGE, MW, SPAIN, 2018 - 2030
- Figure 21:
- VOLUME SIZE OF MASSIVE, MW, SPAIN, 2018 - 2030
- Figure 22:
- VOLUME SIZE OF MEDIUM, MW, SPAIN, 2018 - 2030
- Figure 23:
- VOLUME SIZE OF MEGA, MW, SPAIN, 2018 - 2030
- Figure 24:
- VOLUME SIZE OF SMALL, MW, SPAIN, 2018 - 2030
- Figure 25:
- VOLUME OF TIER TYPE, MW, SPAIN, 2018 - 2030
- Figure 26:
- VOLUME SHARE OF TIER TYPE, %, SPAIN, 2018 - 2030
- Figure 27:
- VOLUME SIZE OF TIER 1 AND 2, MW, SPAIN, 2018 - 2030
- Figure 28:
- VOLUME SIZE OF TIER 3, MW, SPAIN, 2018 - 2030
- Figure 29:
- VOLUME SIZE OF TIER 4, MW, SPAIN, 2018 - 2030
- Figure 30:
- VOLUME OF ABSORPTION, MW, SPAIN, 2018 - 2030
- Figure 31:
- VOLUME SHARE OF ABSORPTION, %, SPAIN, 2018 - 2030
- Figure 32:
- VOLUME SIZE OF NON-UTILIZED, MW, SPAIN, 2018 - 2030
- Figure 33:
- VOLUME OF COLOCATION TYPE, MW, SPAIN, 2018 - 2030
- Figure 34:
- VOLUME SHARE OF COLOCATION TYPE, %, SPAIN, 2018 - 2030
- Figure 35:
- VOLUME SIZE OF HYPERSCALE, MW, SPAIN, 2018 - 2030
- Figure 36:
- VOLUME SIZE OF RETAIL, MW, SPAIN, 2018 - 2030
- Figure 37:
- VOLUME SIZE OF WHOLESALE, MW, SPAIN, 2018 - 2030
- Figure 38:
- VOLUME OF END USER, MW, SPAIN, 2018 - 2030
- Figure 39:
- VOLUME SHARE OF END USER, %, SPAIN, 2018 - 2030
- Figure 40:
- VOLUME SIZE OF BFSI, MW, SPAIN, 2018 - 2030
- Figure 41:
- VOLUME SIZE OF CLOUD, MW, SPAIN, 2018 - 2030
- Figure 42:
- VOLUME SIZE OF E-COMMERCE, MW, SPAIN, 2018 - 2030
- Figure 43:
- VOLUME SIZE OF GOVERNMENT, MW, SPAIN, 2018 - 2030
- Figure 44:
- VOLUME SIZE OF MANUFACTURING, MW, SPAIN, 2018 - 2030
- Figure 45:
- VOLUME SIZE OF MEDIA & ENTERTAINMENT, MW, SPAIN, 2018 - 2030
- Figure 46:
- VOLUME SIZE OF TELECOM, MW, SPAIN, 2018 - 2030
- Figure 47:
- VOLUME SIZE OF OTHER END USER, MW, SPAIN, 2018 - 2030
- Figure 48:
- VOLUME SHARE OF MAJOR PLAYERS, %, SPAIN
Spain Data Center Industry Segmentation
Madrid are covered as segments by Hotspot. Large, Massive, Medium, Mega, Small are covered as segments by Data Center Size. Tier 1 and 2, Tier 3, Tier 4 are covered as segments by Tier Type. Non-Utilized, Utilized are covered as segments by Absorption.| Hotspot | Madrid | |||
| Rest of Spain | ||||
| Data Center Size | Large | |||
| Massive | ||||
| Medium | ||||
| Mega | ||||
| Small | ||||
| Tier Type | Tier 1 and 2 | |||
| Tier 3 | ||||
| Tier 4 | ||||
| Absorption | Non-Utilized | |||
| Utilized | By Colocation Type | Hyperscale | ||
| Retail | ||||
| Wholesale | ||||
| By End User | BFSI | |||
| Cloud | ||||
| E-Commerce | ||||
| Government | ||||
| Manufacturing | ||||
| Media & Entertainment | ||||
| Telecom | ||||
| Other End User | ||||
Need A Different Region or Segment?
Customize Now
Market Definition
- IT LOAD CAPACITY - The IT load capacity or installed capacity, refers to the amount of energy consumed by servers and network equipments placed in a rack installed. It is measured in megawatt (MW).
- ABSORPTION RATE - It denotes the extend to which the data center capacity has been leased out. For instance, a 100 MW DC has leased out 75 MW, then absorption rate would be 75%. It is also referred as utilization rate and leased-out capacity.
- RAISED FLOOR SPACE - It is an elevated space build over the floor. This gap between the original floor and the elevated floor is used to accommodate wiring, cooling, and other data center equipment. This arrangement assist in having proper wiring and cooling infrastructure. It is measured in square feet (ft^2).
- DATA CENTER SIZE - Data Center Size is segmented based on the raised floor space allocated to the data center facilities. Mega DC - # of Racks must be more than 9000 or RFS (raised floor space) must be more than 225001 Sq. ft; Massive DC - # of Racks must be in between 9000 and 3001 or RFS must be in between 225000 Sq. ft and 75001 Sq. ft; Large DC - # of Racks must be in between 3000 and 801 or RFS must be in between 75000 Sq. ft and 20001 Sq. ft; Medium DC # of Racks must be in between 800 and 201 or RFS must be in between 20000 Sq. ft and 5001 Sq. ft; Small DC - # of Racks must be less than 200 or RFS must be less than 5000 Sq. ft.
- TIER TYPE - According to Uptime Institute the data centers are classified into four tiers based on the proficiencies of redundant equipment of the data center infrastructure. In this segment the data center are segmented as Tier 1,Tier 2, Tier 3 and Tier 4.
- COLOCATION TYPE - The segment is segregated into 3 categories namely Retail, Wholesale and Hyperscale Colocation service. The categorization is done based on the amount of IT load leased out to potential customers. Retail colocation service has leased capacity less than 250 kW; Wholesale colocation services has leased capacity between 251 kW and 4 MW and Hyperscale colocation services has leased capacity more than 4 MW.
- END CONSUMERS - The Data Center Market operates on a B2B basis. BFSI, Government, Cloud Operators, Media and Entertainment, E-Commerce, Telecom and Manufacturing are the major end-consumers in the market studied. The scope only includes colocation service operators catering to the increasing digitalization of the end-user industries.
| Keyword | Definition |
|---|---|
| Rack Unit | Generally referred as U or RU, it is the unit of measurement for the server unit housed in the racks in the data center. 1U is equal to 1.75 inches. |
| Rack Density | It defines the amount of power consumed by the equipment and server housed in a rack. It is measured in kilowatt (kW). This factor plays a critical role in data center design and, cooling and power planning. |
| IT Load Capacity | The IT load capacity or installed capacity, refers to the amount of energy consumed by servers and network equipment placed in a rack installed. It is measured in megawatt (MW). |
| Absorption Rate | It denotes how much of the data center capacity has been leased out. For instance, if a 100 MW DC has leased out 75 MW, then the absorption rate would be 75%. It is also referred to as utilization rate and leased-out capacity. |
| Raised Floor Space | It is an elevated space built over the floor. This gap between the original floor and the elevated floor is used to accommodate wiring, cooling, and other data center equipment. This arrangement assists in having proper wiring and cooling infrastructure. It is measured in square feet/meter. |
| Computer Room Air Conditioner (CRAC) | It is a device used to monitor and maintain the temperature, air circulation, and humidity inside the server room in the data center. |
| Aisle | It is the open space between the rows of racks. This open space is critical for maintaining the optimal temperature (20-25 °C) in the server room. There are primarily two aisles inside the server room, a hot aisle and a cold aisle. |
| Cold Aisle | It is the aisle wherein the front of the rack faces the aisle. Here, chilled air is directed into the aisle so that it can enter the front of the racks and maintain the temperature. |
| Hot Aisle | It is the aisle where the back of the racks faces the aisle. Here, the heat dissipated from the equipment’s in the rack is directed to the outlet vent of the CRAC. |
| Critical Load | It includes the servers and other computer equipment whose uptime is critical for data center operation. |
| Power Usage Effectiveness (PUE) | It is a metric which defines the efficiency of a data center. It is calculated by: (𝑇𝑜𝑡𝑎𝑙 𝐷𝑎𝑡𝑎 𝐶𝑒𝑛𝑡𝑒𝑟 𝐸𝑛𝑒𝑟𝑔𝑦 𝐶𝑜𝑛𝑠𝑢𝑚𝑝𝑡𝑖𝑜𝑛)/(𝑇𝑜𝑡𝑎𝑙 𝐼𝑇 𝐸𝑞𝑢𝑖𝑝𝑚𝑒𝑛𝑡 𝐸𝑛𝑒𝑟𝑔𝑦 𝐶𝑜𝑛𝑠𝑢𝑚𝑝𝑡𝑖𝑜𝑛). Further, a data center with a PUE of 1.2-1.5 is considered highly efficient, whereas, a data center with a PUE >2 is considered highly inefficient. |
| Redundancy | It is defined as a system design wherein additional component (UPS, generators, CRAC) is added so that in case of power outage, equipment failure, the IT equipment should not be affected. |
| Uninterruptible Power Supply (UPS) | It is a device that is connected in series with the utility power supply, storing energy in batteries such that the supply from UPS is continuous to IT equipment even during utility power is snapped. The UPS primarily supports the IT equipment only. |
| Generators | Just like UPS, generators are placed in the data center to ensure an uninterrupted power supply, avoiding downtime. Data center facilities have diesel generators and commonly, 48-hour diesel is stored in the facility to prevent disruption. |
| N | It denotes the tools and equipment required for a data center to function at full load. Only "N" indicates that there is no backup to the equipment in the event of any failure. |
| N+1 | Referred to as 'Need plus one', it denotes the additional equipment setup available to avoid downtime in case of failure. A data center is considered N+1 when there is one additional unit for every 4 components. For instance, if a data center has 4 UPS systems, then for to achieve N+1, an additional UPS system would be required. |
| 2N | It refers to fully redundant design wherein two independent power distribution system is deployed. Therefore, in the event of a complete failure of one distribution system, the other system will still supply power to the data center. |
| In-Row Cooling | It is the cooling design system installed between racks in a row where it draws warm air from the hot aisle and supplies cool air to the cold aisle, thereby maintaining the temperature. |
| Tier 1 | Tier classification determines the preparedness of a data center facility to sustain data center operation. A data center is classified as Tier 1 data center when it has a non-redundant (N) power component (UPS, generators), cooling components, and power distribution system (from utility power grids). The Tier 1 data center has an uptime of 99.67% and an annual downtime of <28.8 hours. |
| Tier 2 | A data center is classified as Tier 2 data center when it has a redundant power and cooling components (N+1) and a single non-redundant distribution system. Redundant components include extra generators, UPS, chillers, heat rejection equipment, and fuel tanks. The Tier 2 data center has an uptime of 99.74% and an annual downtime of <22 hours. |
| Tier 3 | A data center having redundant power and cooling components and multiple power distribution systems is referred to as a Tier 3 data center. The facility is resistant to planned (facility maintenance) and unplanned (power outage, cooling failure) disruption. The Tier 3 data center has an uptime of 99.98% and an annual downtime of <1.6 hours. |
| Tier 4 | It is the most tolerant type of data center. A Tier 4 data center has multiple, independent redundant power and cooling components and multiple power distribution paths. All IT equipment are dual powered, making them fault tolerant in case of any disruption, thereby ensuring interrupted operation. The Tier 4 data center has an uptime of 99.74% and an annual downtime of <26.3 minutes. |
| Small Data Center | Data center that has floor space area of ≤ 5,000 Sq. ft or the number of racks that can be installed is ≤ 200 is classified as a small data center. |
| Medium Data Center | Data center which has floor space area between 5,001-20,000 Sq. ft, or the number of racks that can be installed is between 201-800, is classified as a medium data center. |
| Large Data Center | Data center which has floor space area between 20,001-75,000 Sq. ft, or the number of racks that can be installed is between 801-3,000, is classified as a large data center. |
| Massive Data Center | Data center which has floor space area between 75,001-225,000 Sq. ft, or the number of racks that can be installed is between 3001-9,000, is classified as a massive data center. |
| Mega Data Center | Data center that has a floor space area of ≥ 225,001 Sq. ft or the number of racks that can be installed is ≥ 9001 is classified as a mega data center. |
| Retail Colocation | It refers to those customers who have a capacity requirement of 250 kW or less. These services are majorly opted by small and medium enterprises (SMEs). |
| Wholesale Colocation | It refers to those customers who have a capacity requirement between 250 kW to 4 MW. These services are majorly opted by medium to large enterprises. |
| Hyperscale Colocation | It refers to those customers who have a capacity requirement greater than 4 MW. The hyperscale demand primarily originates from large-scale cloud players, IT companies, BFSI, and OTT players (like Netflix, Hulu, and HBO+). |
| Mobile Data Speed | It is the mobile internet speed a user experiences via their smartphones. This speed is primarily dependent on the carrier technology being used in the smartphone. The carrier technologies available in the market are 2G, 3G, 4G, and 5G, where 2G provides the slowest speed while 5G is the fastest. |
| Fiber Connectivity Network | It is a network of optical fiber cables deployed across the country, connecting rural and urban regions with high-speed internet connection. It is measured in kilometer (km). |
| Data Traffic per Smartphone | It is a measure of average data consumption by a smartphone user in a month. It is measured in gigabyte (GB). |
| Broadband Data Speed | It is the internet speed that is supplied over the fixed cable connection. Commonly, copper cable and optic fiber cable are used in both residential and commercial use. Here, optic cable fiber provides faster internet speed than copper cable. |
| Submarine Cable | A submarine cable is a fiber optic cable laid down at two or more landing points. Through this cable, communication and internet connectivity between countries across the globe is established. These cables can transmit 100-200 terabits per second (Tbps) from one point to another. |
| Carbon Footprint | It is the measure of carbon dioxide generated during the regular operation of a data center. Since, coal, and oil & gas are the primary source of power generation, consumption of this power contributes to carbon emissions. Data center operators are incorporating renewable energy sources to curb the carbon footprint emerging in their facilities. |
Need More Details on Market Definition?
Ask a Question
Research Methodology
Mordor Intelligence follows a four-step methodology in all our reports.
- Step-1: Identify Key Variables: In order to build a robust forecasting methodology, the variables and factors identified in Step-1 are tested against available historical market numbers. Through an iterative process, the variables required for market forecast are set and the model is built on the basis of these variables.
- Step-2: Build a Market Model: Market-size estimations for the forecast years are in nominal terms. Inflation is not a part of the pricing, and the average selling price (ASP) is kept constant throughout the forecast period for each country.
- Step-3: Validate and Finalize: In this important step, all market numbers, variables and analyst calls are validated through an extensive network of primary research experts from the market studied. The respondents are selected across levels and functions to generate a holistic picture of the market studied.
- Step-4: Research Outputs: Syndicated Reports, Custom Consulting Assignments, Databases & Subscription Platforms

Get More Details On Research Methodology
Download PDF


