
Market Overview
| Study Period | 2020 - 2031 |
|---|---|
| Forecast Data Period | 2026 - 2031 |
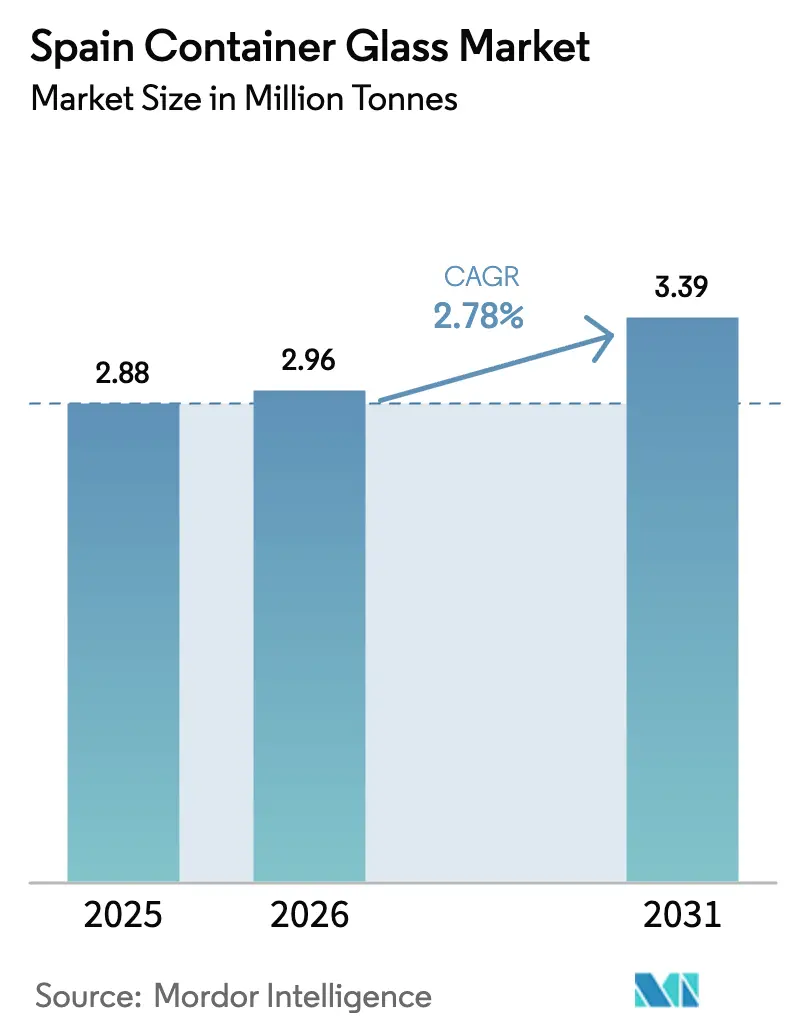
| Base Year Market Size (2025) | 2.88 Million tonnes |
| Market Volume (2026) | 2.96 Million tonnes |
| Market Volume (2031) | 3.39 Million tonnes |
| Growth Rate (2026 - 2031) | 2.78% CAGR |
| Market Concentration | Low |
Major Players *Disclaimer: Major Players sorted in no particular order Image © Mordor Intelligence. Reuse requires attribution under CC BY 4.0. | |
Spain Container Glass Market Analysis by Mordor Intelligence
The Spain Container Glass Market size was valued at 2.88 million tonnes in 2025 and estimated to grow from 2.96 million tonnes in 2026 to reach 3.39 million tonnes by 2031, at a CAGR of 2.78% during the forecast period (2026-2031). Consistent policy pressure for closed‐loop recycling, premiumization in wine, olive oil, and beauty packaging, and strong cullet availability underpin this measured trajectory for the Spain container glass market. Brand owners in beverages, cosmetics, and gourmet foods now specify lightweight eco-designed bottles, accelerating technology investments in oxygen-fueled furnaces and inline AI inspection. Sector resilience also stems from Spain’s stature as the world’s third-largest wine producer and the largest olive-oil supplier, both of which favor glass to convey authenticity and preserve product integrity. Nonetheless, energy price volatility and competition from plastics and metal packaging continue to pressure margins. Consolidation is intensifying as Vidrala, O-I Glass, and Verallia optimize capacity, while mid-tier specialists pursue design-led niches to defend share in the Spain container glass market.
Key Report Takeaways
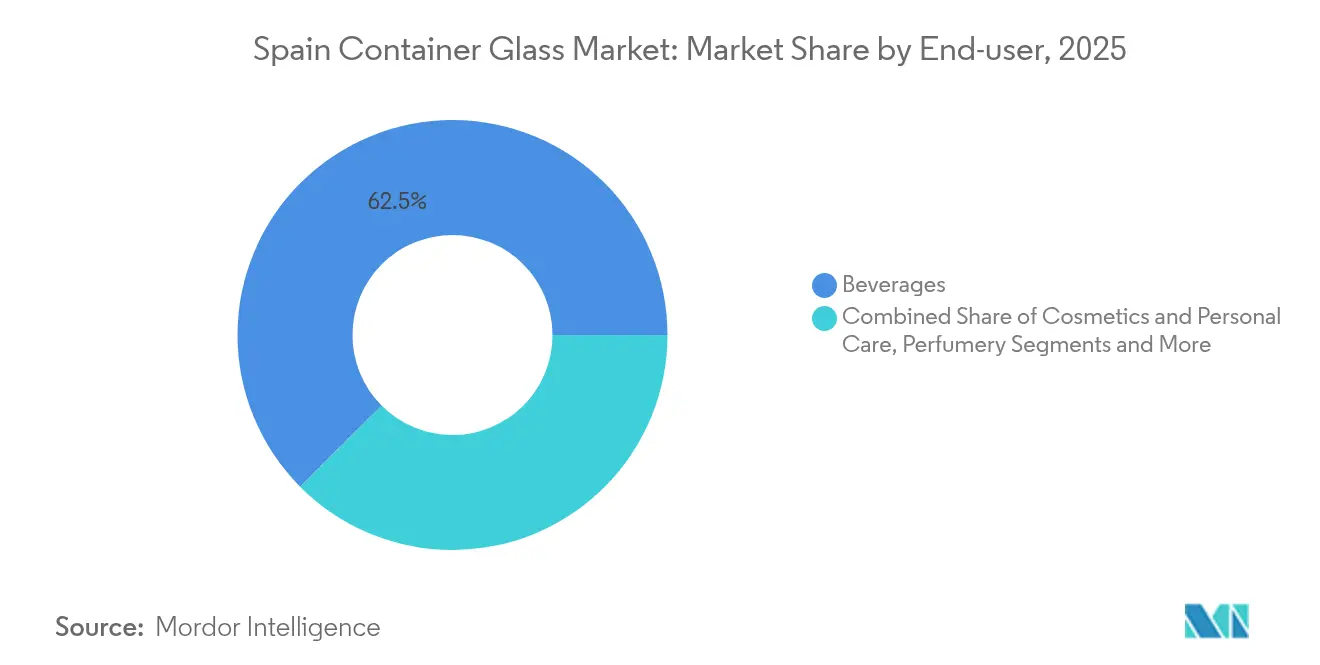
- By end-user, beverages captured 62.46% of the Spain container glass market share in 2025.
- By color, the Spain container glass market for amber glass is projected to grow at a 4.07% CAGR between 2026-2031.
Note: Market size and forecast figures in this report are generated using Mordor Intelligence’s proprietary estimation framework, updated with the latest available data and insights as of 2026.
Spain Container Glass Market Trends and Insights
Drivers Impact Analysis*
| Driver | (~) % Impact on CAGR Forecast | Geographic Relevance | Impact Timeline |
|---|---|---|---|
| Increasing demand for sustainable packaging solutions | +0.8% | National (Madrid, Barcelona, Valencia) | Medium term (2-4 years) |
| Growing preference for recyclable and eco-friendly glass | +0.6% | Urban centers nationwide | Long term (≥ 4 years) |
| Rising consumption of alcoholic beverages | +0.4% | Rioja, Ribera del Duero, Catalonia | Short term (≤ 2 years) |
| Premiumization trends in wine, olive oil and cosmetics | +0.4% | Nationwide with export pull | Medium term (2-4 years) |
| Government Incentives for Circular Economy and Recycling | +0.5% | National, with EU-wide regulatory influence | Long term (≥ 4 years) |
| Premiumization Trends in Wine, Olive Oil, and Cosmetics Packaging | +0.4% | National, with export market implications | Medium term (2-4 years) |
| Source: Mordor Intelligence | |||
Increasing Demand for Sustainable Packaging Solutions
EU legislation mandating 90% collection and 85% recycling of glass by 2030 amplifies corporate sustainability targets, steering brand owners toward the Spain container glass market. Premium wine producers such as Torres have switched to 15-20% lighter bottles, reducing scope 3 emissions while retaining shelf appeal. Manufacturers able to deliver lighter yet structurally robust containers gain priority in supplier rosters. This alignment of regulatory pull, investor scrutiny, and consumer sentiment collectively lifts baseline demand despite higher unit costs than plastic, sustaining growth momentum for the Spain container glass market.
Growing Preference for Recyclable and Eco-Friendly Glass
Consumer surveys show willingness to pay price premiums for products in infinitely recyclable glass, particularly among health-conscious demographics in Spain’s larger cities. Glass retains flavor and aroma better than plastics that degrade after limited recycling loops, reinforcing quality perceptions. Ecovidrio’s network of 240,302 green bins underpins Spain’s 79.8% glass collection rate, ensuring an abundant cullet supply that lowers furnace energy by 2-3% per 10% cullet usage.[1]Ecovidrio, “Memoria de Sostenibilidad 2024,” ecovidrio.es As virtuous collection-recycling cycles strengthen, cost competitiveness improves, further anchoring glass as the preferred premium pack in the Spain container glass market.
Rising Consumption of Alcoholic Beverages in Spain
Domestic beer and craft cider volumes rebounded post-pandemic, while wine exports to the United States and Asia registered high-single-digit growth in 2024. Producers favor glass for shelf differentiation, oxidation resistance, and the premium cues essential in crowded international aisles. Region-specific denominations such as Rioja and Ribera del Duero rely on fast lead times from nearby plants, supporting local capacity utilization in the Spain container glass market.
Premiumization Trends in Wine, Olive Oil, and Cosmetics Packaging
Spain’s olive-oil sector targets production of 4 million tonnes by 2040, with top brands adopting customized flint or emerald bottles that lift retail pricing by 20-30%. Cosmetics leader Puig reported rising demand for sculpted heavy-glass flacons, inflating glass spend per unit. These shifts provide margin upside for manufacturers offering complex shapes, specialty colors, embossing, and acid-etched textures, reinforcing value capture in the Spain container glass market.
Restraints Impact Analysis*
| Restraint | (~) % Impact on CAGR Forecast | Geographic Relevance | Impact Timeline |
|---|---|---|---|
| High production costs of glass containers | –0.5% | Nationwide | Short term (≤ 2 years) |
| Intense competition from plastic and metal packaging | –0.4% | Nationwide | Medium term (2-4 years) |
| Energy-Intensive Manufacturing Process | -0.3% | National, concentrated in major production hubs | Long term (≥ 4 years) |
| Supply Chain Disruptions and Raw Material Volatility | -0.2% | National, with import dependency for certain materials | Short term (≤ 2 years) |
| Source: Mordor Intelligence | |||
High Production Costs of Glass Containers
Energy accounts for 35-39% of glass production costs, and although Spanish industrial electricity averaged EUR 0.17/kWh (USD 0.19/kWh) in 2023 29% below the broader EU, furnaces operating at 1,600 °C remain exposed to price spikes. O-I Glass absorbed USD 175 million in incremental expenses in 2024, prompting its “Fit to Win” plan to shed at least 7% European capacity by mid-2025. Soda-ash and silica volatility compounds the pressure, forcing relentless efficiency drives across the Spain container glass market.
Intense Competition from Plastic and Metal Packaging
PET bottles cost 60-70% less per unit and weigh a fraction of glass, translating into reduced logistics emissions and expenses. Aluminum cans offer production speed and durability, winning share in carbonated beverages. Carton innovator Elopak is edging into juice and dairy aisles with fiber-based packs that combine sustainability cues with cost savings. While lightweighting narrows the freight gap, glass continues to cede volume in mass-market segments, moderating expansion prospects for the Spain container glass market.
*Our forecasts treat driver/restraint impacts as directional, not additive. The impact forecasts reflect baseline growth, mix effects, and variable interactions.
Segment Analysis
By End-user: Beverages Drive Market Leadership
Beverages accounted for 62.46% of Spain's container glass market share in 2025, led by wine, beer, and spirits. The alcoholic-beverage subsegment benefits from premium cues, oxygen impermeability, and export authenticity requirements, ensuring stable demand. Craft brewers also prefer embossed amber bottles that protect against UV and reinforce artisanal positioning. Non-alcoholic drinks lean on glass for niche organic juices and kombucha, where provenance matters. Cosmetics and personal care are the fastest-growing applications at a 3.95% CAGR to 2031, buoyed by luxury skincare, perfumery, and wellness products packaged in heavy, custom-shaped jars.
The Spain container glass market size for cosmetics is projected to rise steadily as deluxe brands favor tactile heft and sustainable storytelling. Food applications such as olive oil, jam, and gourmet sauces sustain stable tonnage, underpinned by Spain’s agricultural export engine. Pharmaceuticals retain moderate demand for neutral borosilicate bottles outside vial niches, while perfumery leverages intricate glass sculpting to bolster brand equity. Segment diversity shields the Spain container glass market from cyclical shocks in any single end-use stream.


By Color: Flint Glass Maintains Dominance
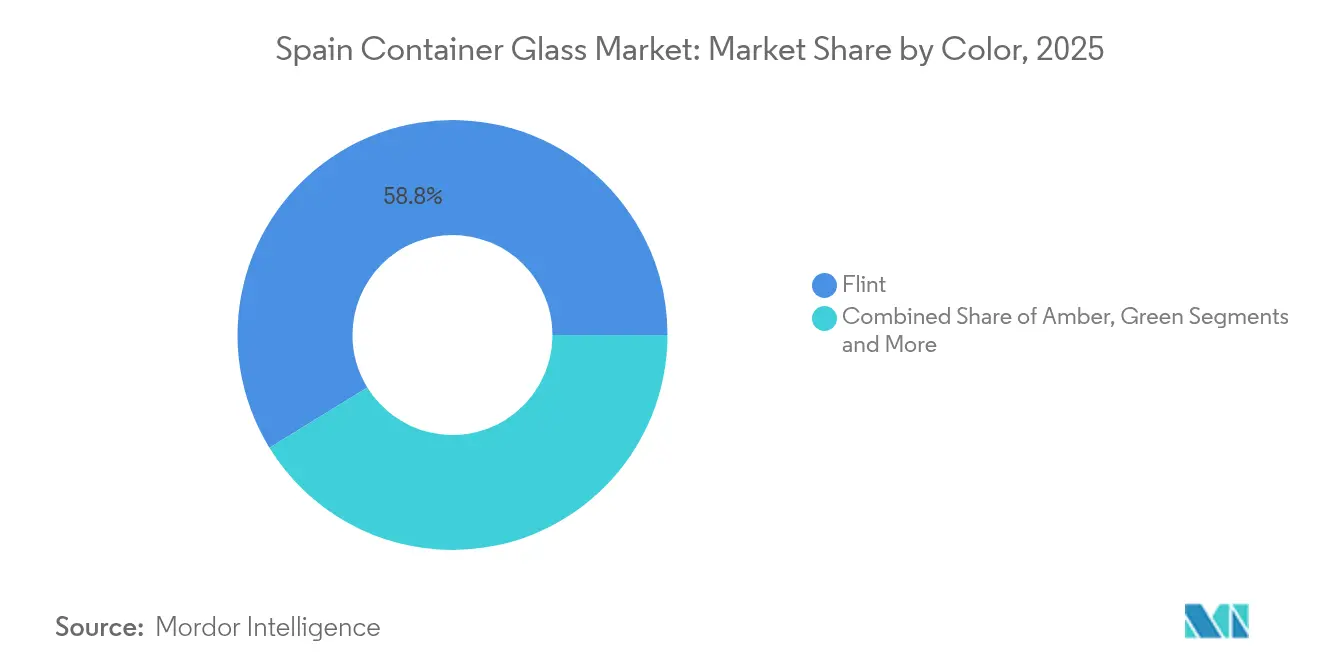
Flint held 58.78% of the Spain container glass market size in 2025, thanks to its clarity, versatility, and ability to spotlight product color, crucial for olive oil and rosé wines. Winemakers prize flint for showcasing shade and sediment, enhancing shelf appeal. Gourmet food brands use clear jars to demonstrate purity, while cosmetics rely on transparency to display textures. Amber is the fastest-growing color at 4.07% CAGR through 2031, propelled by pharmaceutical and craft-beer demand that requires UV protection.
Beer bottlers favor amber to minimize light-struck flavor deterioration, and drug makers package light-sensitive formulations similarly. Green glass sustains relevance in red-wine bottles that convey heritage cues in export markets, whereas cobalt and specialty tints occupy niche premium roles, commanding higher margins within the Spain container glass market.
Geography Analysis
Catalonia anchors the Spain container glass market with multiple furnaces clustered around Barcelona’s port, granting export reach and feedstock access. Andalusia hosts plants tied to the olive-oil belt, ensuring swift supply to bottlers during harvest peaks. Valencia marries manufacturing capacity with agricultural demand for jam, citrus preserves, and specialty sauces.
Northern regions, the Basque Country and Castile & León, share proximity with celebrated wine appellations Rioja and Ribera del Duero, lowering freight costs and enabling just-in-time bottle dispatch. BA Glass Iberia’s León and Villafranca sites generated EUR 201.76 million (USD 228 million) sales in 2021 with 654 staff, underscoring regional employment and specialization.
Madrid’s central logistics hub channels finished containers nationwide to FMCG headquarters, sustaining balanced load factors. Proximity between plants and demand nodes trims transportation, which can weigh 10-15% of delivered cost, reinforcing domestic incumbents against imports.
Value Chain Analysis
Spain's container-glass value chain starts with raw materials (silica sand, soda ash, limestone and additives) and high-energy melting operations, then moves through forming, annealing, decoration and inspection before distribution to beverage, food, cosmetics and pharma fillers. On the upstream and circular side, Spain benefits from a mature post-consumer collection ecosystem that feeds cullet back into furnaces. Ecovidrio supports high collection penetration (240,302 green bins) with a 79.8% collection rate, which improves furnace efficiency as cullet share rises.
Industry coordination and standards-setting are supported by sector bodies such as ANFEVI, which represents over 98% of Spanish container-glass production across 13 production centers and around 19 million bottles and jars made daily, and Vidrio Espana, which represents more than 92% of production capacity subject to EU greenhouse-gas emissions trading requirements. Downstream, large buyers (wine, beer, olive oil and beauty brands) increasingly specify lightweight, eco-designed packs, which is pushing manufacturers such as Verallia Spain (seven production centers in the Iberian Peninsula), O-I and Vidrala to invest in oxy-fuel, electrification and digital quality control. Logistics costs, often 10-15% of delivered cost, also keeps plant-bottler proximity strategically important.
Competitive Landscape
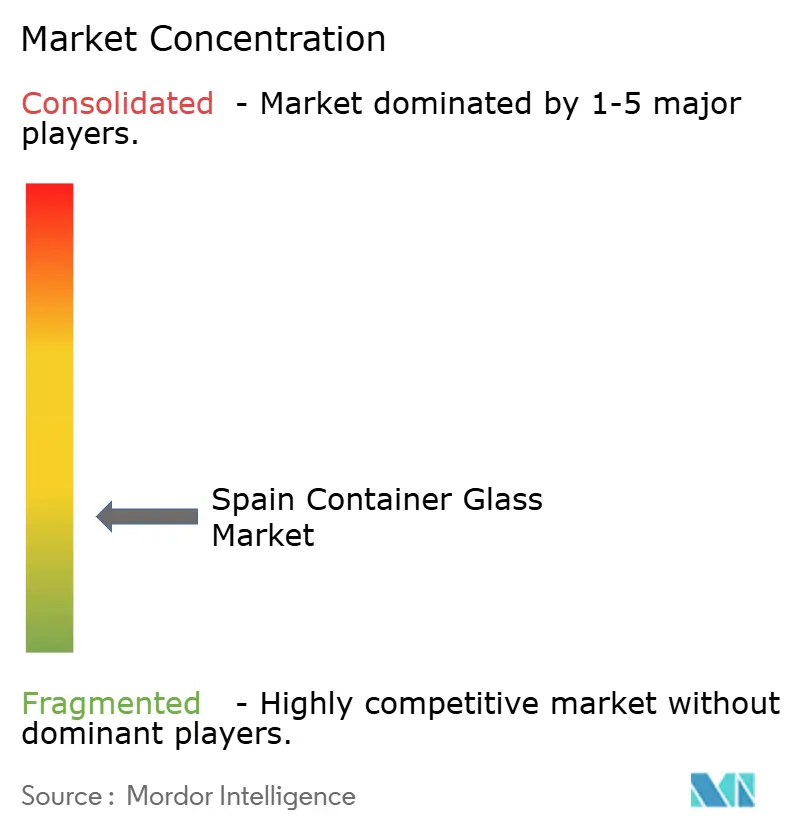
The Spain container glass market is moderately consolidated. Vidrala, O-I Glass, and Verallia jointly secured roughly 65% revenue in 2024, while BA Glass and regional niche players hold the remainder.[3]FindingMoats Research, “Vidrala Competitive Edge 2025,” findingmoats.substack.comO-I’s “Fit to Win” plan targets a 7% reduction in European furnace capacity by mid-2025, tightening supply but releasing USD 250 million in cost savings. Vidrala has pioneered 260-gram lightweight wine bottles, blending lower emissions with premium aesthetics and cushioning margins amid energy volatility.
Verallia focuses on recycled-content furnaces to match retailer decarbonization scorecards. Strategic themes span lightweighting, cullet integration, waste-heat recovery, and digital quality control. Larger groups leverage capital to modernize furnaces, whereas smaller firms hedge via custom molds and artisan short runs.
M&A activity centers on geographic diversification; BA Glass’s 60% stake in Mexico’s Vidrio Formas expanded its global footprint to surpass EUR 1.8 billion (USD 2.03 billion) revenue. With end-market defensiveness, incumbents will prioritize throughput, energy hedging, and high-margin premium accounts to protect profitability in the Spain container glass market.
Spain Container Glass Industry Leaders
Verallia Spain S.A.
O-I Manufacturing Spain, S.L.
Saverglass Iberica S.A.U.
Ardagh Group S.A.
Gerresheimer Zaragoza S.A.
- *Disclaimer: Major Players sorted in no particular order

Market Opportunities and Future Outlook
Decarbonized melting and low-carbon product lines are becoming a clearer whitespace as brand owners and retailers tighten packaging emissions scorecards, and Spain moves deeper into reuse and recycling compliance under Real Decreto 1055/2022 and EU packaging rules clarified in 2025 by MITECO. Verallia's April 2026 inauguration of a EUR 63 million hybrid furnace in Zaragoza, positioned to cut CO2 emissions by about 50%, provides a tangible reference point for how Spanish supply can deliver differentiated, lower-carbon container glass for beverages, gourmet foods and cosmetics.
Premiumization-driven formats remain an opportunity area where Spanish demand is structurally diversified, with beverages already accounting for 62.46% of 2025 volume and cosmetics and personal care growing faster within the study period. Producers that combine lightweighting with premium aesthetics (specialty colors, embossing and complex shapes) can address substitution pressure from PET and cans in mass-market segments while protecting value in wine, olive oil and beauty packaging. On the supply side, European footprint optimization, including Ardagh's stated focus on better-invested and better-utilized glass facilities, and O-I's Fit to Win capacity and cost actions, creates room for Spanish plants to run efficiently on high cullet inputs and upgraded furnaces, positioning them for higher-spec, sustainability-led tenders.
Recent Industry Developments
- May 2026: Verallia shifts Conservas Manchegas Antonio from metal to glass jars at Verallia Spain site under AURA range. This expands premium, transparent packaging for regional brands, supporting premiumization and cullet recycling goals. The move reinforces Verallia's capability to meet growing demand for high value glass packaging in Iberia.
- April 2026: Verallia inaugurates its first hybrid furnace in Zaragoza, Spain, program backed by SORG. The launch expands manufacturing capacity with lower emissions and energy efficiency gains for glass production. The capacity addition strengthens the ability to meet demand for low carbon glass packaging in Iberia.
- May 2025: O-I Glass global shipment growth of 4.4% and USD 250 million ‘Fit to Win’ savings target with USD 80 million restructuring charges. The efficiency program improves profitability and capacity discipline across the European packaging supply chain. The action influences European glass sector dynamics through enhanced cost discipline and through-puts improvements.


Research Methodology Framework and Report Scope
Market Definition and Coverage
For this report, the Spain container glass market covers glass packaging made in Spain for bottles and jars that are used to pack beverages, food, and other consumer products, measured on a volume basis (tonnes) and tracked across the full year.
Scope exclusions: This sizing excludes flat glass, fiberglass, tableware, and other non-container glass products.
Segmentation Overview
- By End-user
- Beverages
- Alcoholic
- Beer
- Wine
- Spirits
- Other Alcoholic Beverages (Cider and Other Fermented Drinks)
- Non-Alcoholic
- Juices
- Carbonated Drinks (CSDs)
- Dairy Product Based Drinks
- Other Non-Alcoholic Beverages
- Alcoholic
- Food (Jam, Jelly, Marmalades, Honey, Sausages and Condiments, Oil, Pickles)
- Cosmetics and Personal Care
- Pharmaceuticals (excluding Vials and Ampoules)
- Perfumery
- Beverages
- By Color
- Green
- Amber
- Flint
- Other Colors
Data Sources, Market Sizing, and Validation
Desk Research
Desk research was used to set the factual base for the model and to keep assumptions tied to real industry signals in Spain. We reviewed public statistics and industry releases that help explain glass output levels, recycling availability, and the end use demand that drives bottle and jar consumption.
Typical sources included official datasets and publications such as Eurostat, Spain's national statistics office (INE), UN Comtrade trade statistics, and environmental packaging and recycling bodies in Spain, along with European container glass and glass-industry associations such as FEVE and Glass Alliance Europe. To connect volumes with manufacturing reality, we also reviewed company annual reports, investor presentations, and reputable press coverage of furnace upgrades, capacity changes, and energy related operating constraints. Patent databases were used selectively to understand the direction of lightweighting and furnace technology adoption. This list is not exhaustive, and many other references were used for data collection, cross-checks, and clarification.
Primary Interviews and Surveys
Primary work focused on validating how demand moves across the main bottle and jar applications, and how producers manage output through cullet availability, furnace campaigns, and mix shifts between colors. We spoke with a mix of manufacturers, distributors, recyclers, and large buying functions across Spain so that secondary findings could be checked, gaps could be closed, and key inputs could be aligned before finalizing the model.
Distribution of primary research fieldwork respondents
| Company type | Respondent position | Region |
|---|---|---|
| Top tier: 26% | CXOs: 12% | |
| Mid tier: 59% | Functional/Unit leaders: 35% | |
| Smaller Players: 15% | Managers: 53% |
Market-Sizing & Forecasting
The market was built using both top-down and bottom-up logic, where Spain-level container glass demand was first reconstructed using production and trade signals and then pressure-tested with supplier and channel feedback. In practice, we start from the reported market volume baseline of 2.88 million tonnes (2025) and map it to a demand pool that is consistent with Spain packaging consumption patterns and domestic manufacturing realities.
Several market-specific inputs were used to shape the model, such as container glass production levels, import and export movements for glass containers, cullet collection and recycling rates that influence furnace recipes, and shifts in end markets like wine, beer, non-alcoholic drinks, and packaged foods. We also tracked practical operating indicators mentioned by interviewees, such as furnace rebuild cycles, capacity utilization direction, and lightweighting (which can change tonnes even when filled units are stable). Where a bottom-up view was needed, sampled checks were run by applying typical weight-per-container ranges to estimated filled-volume demand for major applications, and then adjusting for refillable versus single-use patterns where relevant.
For forecasting, scenario analysis was used, anchored on expected beverage and food packaging demand, policy driven recycling traction, and expected capacity changes over the forecast window. Assumptions were only carried forward after they were consistent with what respondents reported on contract renewals, mix shifts by color, and likely energy cost pass-through behavior that can affect production decisions.
Data Validation & Update Cycle
Outputs were validated through a step-by-step set of checks so that the final totals stay aligned with observable market signals. We compared the resulting tonnes against independent indicators like reported production trends, trade direction, and end-use demand movement, and then investigated outliers before locking assumptions.
Before sign-off, the model goes through internal analyst reviews, followed by targeted re-contact with selected interviewees when large variances appear around utilization, cullet constraints, or sudden capacity changes. Reports are refreshed annually, and interim updates are made when material events occur, such as major furnace shutdowns, expansions, or policy changes that can shift packaging demand. Right before delivery, a fresh analyst pass is completed so clients receive the latest updated view.
Mordor Intelligence's Spain Container Glass Market Size Compared With Other Published Estimates
Published market sizes for Spain container glass often do not match because the scope boundary is not handled the same way and the unit of measurement can shift the story. Some sources speak in money terms and others focus on tonnes, and a few also combine container glass with wider glass packaging activities.
Key gap drivers usually include whether import and export flows are netted out, whether recycled cullet handling is treated as a separate activity, and whether adjacent products are mixed into the total (like non-container glass or glass packaging services). Differences can also come from how "Spain market" is interpreted, meaning domestic production versus domestic consumption, and from the timing of currency conversions when value figures are created.
Benchmark comparison
| Source | Market Size | Gaps in Research Methodology |
|---|---|---|
| Mordor Intelligence | USD 2.88 M (2025) | |
| Industry Association A | USD 3.20 M (2023) | Often reflects production-side reporting and may include broader glass output context in Spain, which can inflate container-only tonnage if boundaries between glass sub-sectors are not fully separated. |
| Trade Journal B | USD 2.50 M (2024) | May lean on trade and shipment snapshots and apply conservative operating-rate assumptions, which can understate volumes in years where local production is supported by stable cullet supply and contracted demand. |
The table shows that the spread is largely explained by what is being counted as Spain container glass and which year is used, and in Mordor Intelligence's model the market is kept strictly as container glass volume in tonnes for Spain, which are then reconciled with production and trade checks before forecasting forward. When the scope stays consistent and the update logic is repeatable, the resulting estimate becomes easier to trace back to clear drivers like output, net trade, and end-use demand shifts.


Key Questions Answered in the Report
What is the current size of the Spain container glass market?
The market stands at 2.96 million tonnes in 2026 and is projected to reach 3.39 million tonnes by 2031.
Which end-user segment dominates demand?
Beverages hold 62.46% share, led by wine, beer and spirits that rely on premium glass for brand integrity.
Why is flint glass so prevalent?
Flint accounts for 58.78% share because its transparency showcases product color, vital for olive oil, wines and cosmetics.
How are manufacturers reducing costs amid high energy prices?
Firms deploy waste-heat recovery, oxy-fuel furnaces and lightweighting to trim energy use 10-15% and material inputs.
Which color segment grows fastest?
Amber glass is rising at a 4.07% CAGR on the back of UV-sensitive beer and pharmaceutical applications.
What drives premiumization in Spanish glass packaging?
Upmarket wine, olive oil and luxury beauty brands demand custom shapes and heavier bottles that command 20-30% price uplifts.
Page last updated on:






