
Market Overview
| Study Period | 2020 - 2031 |
|---|---|
| Forecast Data Period | 2026 - 2031 |
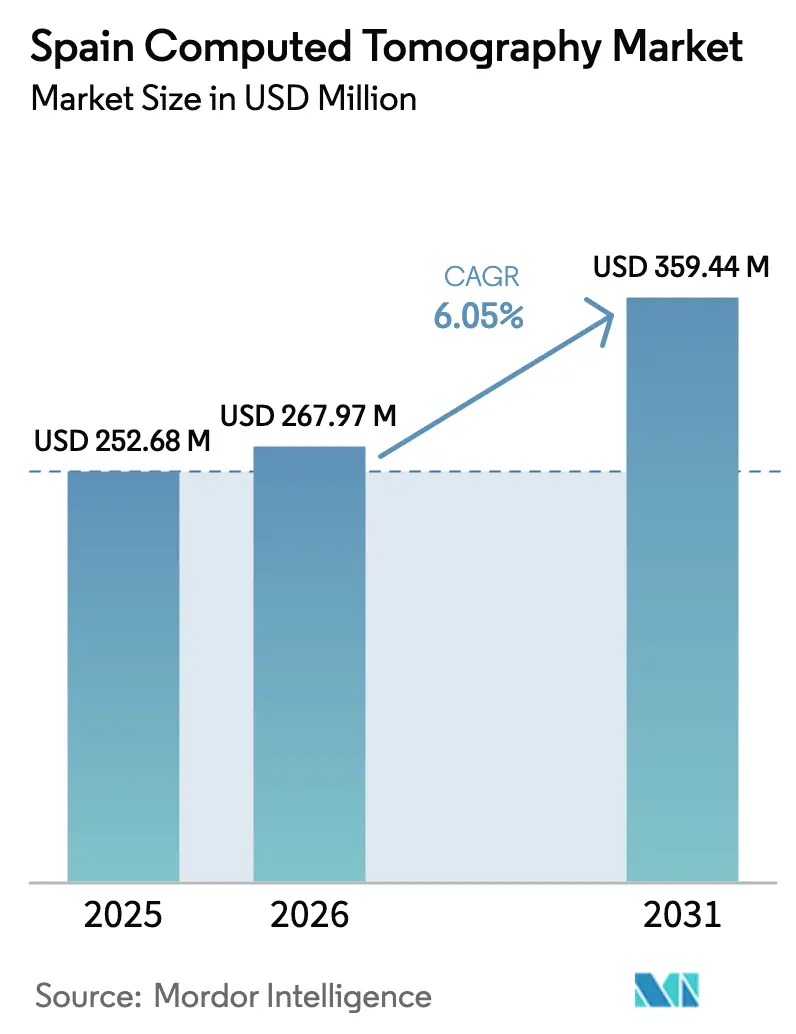
| Base Year Market Size (2025) | USD 252.68 Million |
| Market Size (2026) | USD 267.97 Million |
| Market Size (2031) | USD 359.44 Million |
| Growth Rate (2026 - 2031) | 6.05 % |
| Market Concentration | Medium |
Major Players *Disclaimer: Major Players sorted in no particular order Image © Mordor Intelligence. Reuse requires attribution under CC BY 4.0. | |
Spain Computed Tomography Market Analysis by Mordor Intelligence
The Spain computed tomography market size is expected to grow from USD 252.68 million in 2025 to USD 267.97 million in 2026 and is forecast to reach USD 359.44 million by 2031 at 6.05% CAGR over 2026-2031. Population aging, the government’s EUR 400 million INVEAT equipment renewal plan, and the rapid roll-out of AI-ready scanners are the primary catalysts for steady volume growth. Fixed installations form the backbone of public hospitals, yet mobile units are expanding quickly across rural provinces, reflecting a shift toward point-of-care imaging. Private insurers now cover 26% of Spain’s residents, unlocking a premium segment that absorbs high-slice and photon-counting systems. Vendors are therefore balancing price-performance medium-slice platforms for public tenders with spectral upgrades for private facilities. Supply constraints in radiology staffing and stricter EURATOM dose limits act as friction but are being countered by workflow automation and low-dose protocols.
Key Report Takeaways
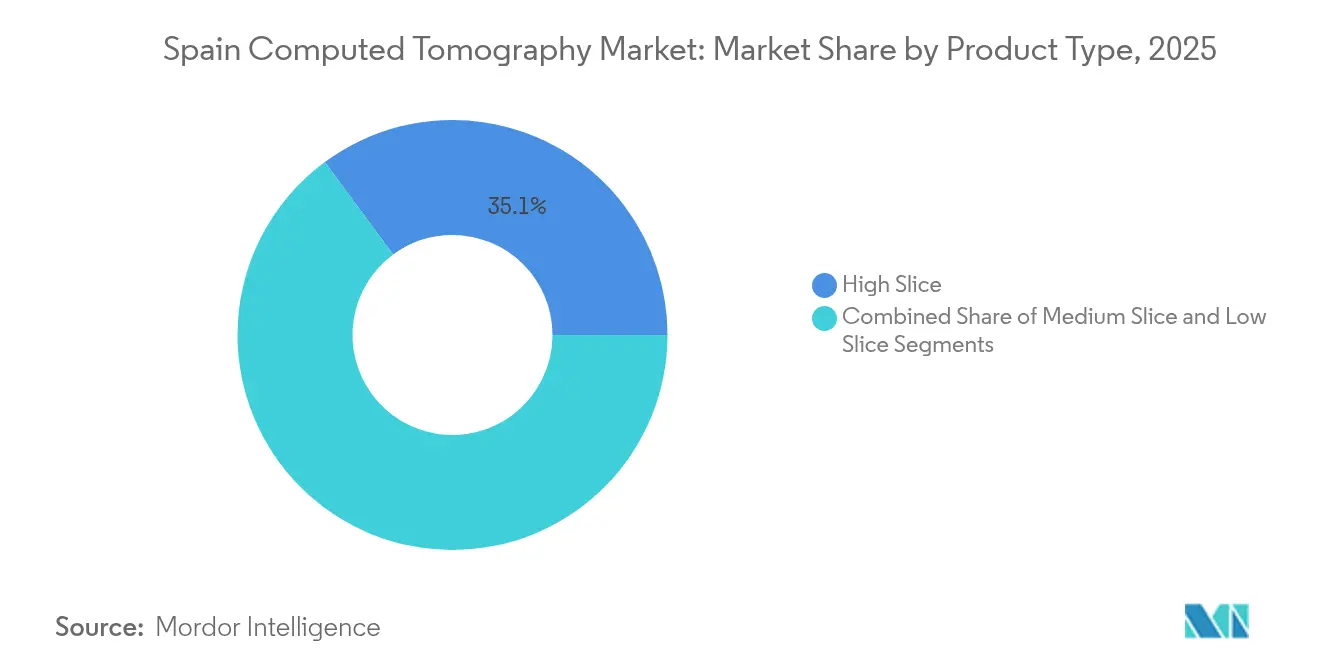
- By product type, high-slice systems led with 35.12% of Spain computed tomography market share in 2025; medium-slice systems are forecast to expand at 6.78% CAGR to 2031.
- By application, oncology accounted for 31.05% share of the Spain computed tomography market size in 2025, while neurology is advancing at a 6.85% CAGR through 2031.
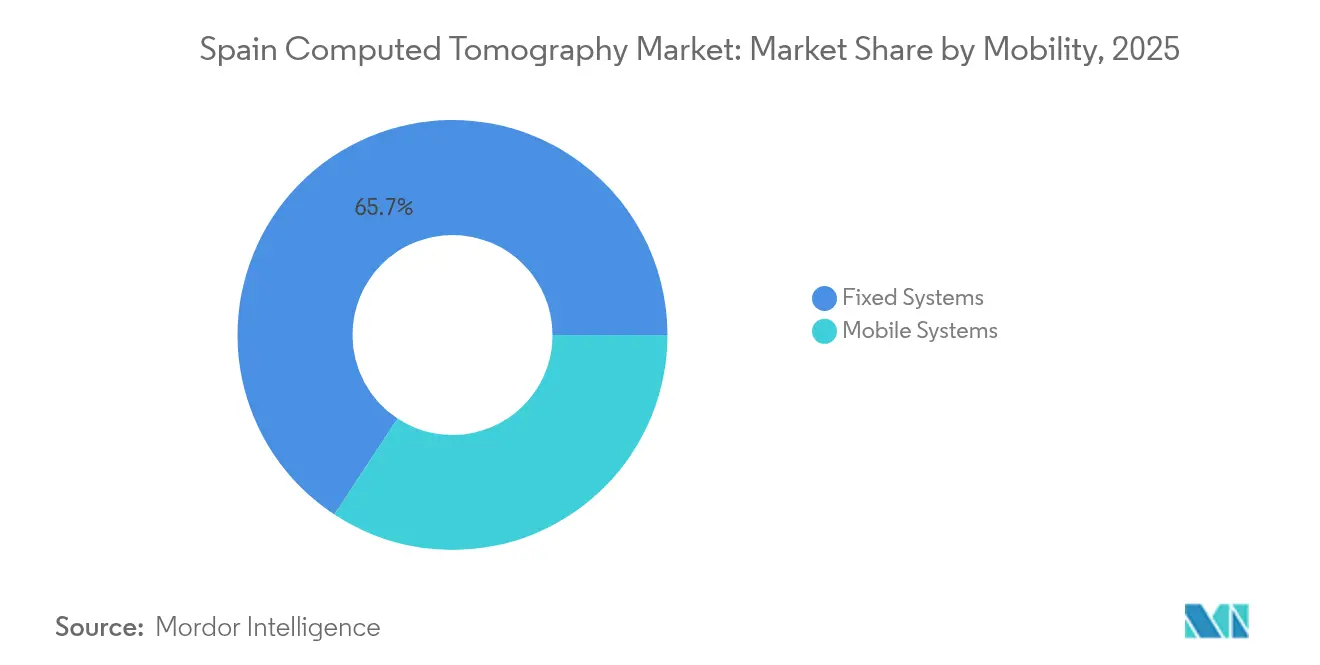
- By mobility, fixed platforms held 65.74% share of the Spain computed tomography market size in 2025 and mobile units are projected to grow at 7.1% CAGR to 2031.
- By end user, hospitals captured 49.20% of Spain computed tomography market share in 2025, whereas diagnostic imaging centers register the fastest expansion at 7.02% CAGR.
Note: Market size and forecast figures in this report are generated using Mordor Intelligence’s proprietary estimation framework, updated with the latest available data and insights as of 2026.
Spain Computed Tomography Market Trends and Insights
Drivers Impact Analysis*
| Driver | (~) % Impact on CAGR Forecast | Geographic Relevance | Impact Timeline |
|---|---|---|---|
| Government INVEAT programme accelerating scanner replacement | +1.8% | National, with priority in underserved regions | Medium term (2-4 years) |
| Rising geriatric population & chronic disease incidence | +1.5% | National, concentrated in rural and coastal areas | Long term (≥ 4 years) |
| Rapid uptake of spectral / photon-counting CT upgrades | +1.2% | Urban centers, private hospitals, academic medical centers | Short term (≤ 2 years) |
| Private health-insurance expansion boosting scan volumes | +1.0% | Madrid, Barcelona, Valencia metropolitan areas | Medium term (2-4 years) |
| AI-ready DICOM standardisation mandates in public hospitals | +0.8% | National, phased implementation by autonomous communities | Medium term (2-4 years) |
| Growing demand for ultra-low-dose paediatric protocols | +0.4% | National, specialized pediatric centers | Long term (≥ 4 years) |
| Source: Mordor Intelligence | |||
Government INVEAT Programme Accelerating Scanner Replacement
Spain’s INVEAT plan allocates EUR 400 million for high-tech equipment, positioning the public sector to replace aging scanners and close regional gaps in diagnostic capacity. The Spanish Society of Medical Radiology reported that between 32% and 59% of imaging devices exceeded 10 years in service, underscoring the programme’s urgency. Madrid is already linking all public hospitals to a unified imaging network scheduled for completion by end-2025, enabling shared protocols and bulk servicing economies [1]. Standardized specifications under INVEAT are encouraging hospitals to favor 64-slice platforms that dovetail with AI upgrades. Training grants attached to the plan are also mitigating the learning curve for spectral imaging and dose-optimization tools.
Rising Geriatric Population & Chronic Disease Incidence
The share of Spaniards aged 65 and above is projected to climb from 20.4% in 2024 to 30.5% by 2055, driving long-run demand for CT-based cancer staging, stroke evaluation, and coronary assessment [2]. New cancer diagnoses are expected to reach 296,103 in 2025, led by prostate, breast, and lung malignancies. Hypertension affects 47% of adult men and 39% of women, increasing CT angiography referrals for plaque characterization [3]. Rural provinces with the steepest aging rates rely on mobile scanners that rotate among district hospitals, ensuring population coverage despite staffing shortages. Low-dose algorithms tailored for frail patients now form part of standard procurement criteria.
Rapid Uptake of Spectral / Photon-Counting CT Upgrades
Photon-counting detectors deliver higher spatial resolution with radiation savings and have begun scaling beyond academic centers into private hospitals. Early adopters note clearer coronary visualization and improved oncologic lesion conspicuity, reducing follow-up imaging by nearly 19% over 10 years. Siemens Healthineers’ NAEOTOM Alpha installations in Spain illustrate a competitive pivot toward premium differentiation. Cost-effectiveness studies estimate lifetime savings of USD 794 per oncology patient due to fewer additional scans. Vendors are bundling AI-guided calcium scoring and spectral lung protocols that match Spain’s cardiovascular and oncology caseload.
Private Health-Insurance Expansion Boosting Scan Volumes
Health insurance coverage rose from 19% to 26% of the population over the past decade, trimming wait times from public queues exceeding 94 days for specialist visits. SegurCaixa Adeslas now insures 5.6 million clients, paying network providers rates that support same-day CT slots. Out-of-pocket CT pricing ranges from EUR 200-700 without insurance versus EUR 5-30 with coverage, reinforcing the migration to private diagnostics. Madrid, Barcelona, and Valencia concentrate the bulk of new private imaging centers, each outfitted with high-slice cardiology packages and oncology spectral modes.
Restraints Impact Analysis*
| Restraint | (~) % Impact on CAGR Forecast | Geographic Relevance | Impact Timeline |
|---|---|---|---|
| High capital & maintenance cost of multi-slice systems | -1.5% | National, particularly affecting smaller hospitals and rural centers | Long term (≥ 4 years) |
| Radiation-dose concerns and tightening EURATOM limits | -0.8% | EU-wide, with stricter enforcement in academic medical centers | Medium term (2-4 years) |
| Shortage of radiologists lengthening scan-to-report times | -1.2% | National, acute in rural areas and smaller cities | Medium term (2-4 years) |
| Regional procurement audits slowing equipment tenders | -0.7% | Andalusia, other autonomous communities with procurement irregularities | Short term (≤ 2 years) |
| Source: Mordor Intelligence | |||
High Capital & Maintenance Cost of Multi-Slice Systems
Purchasing a 128-slice scanner can exceed EUR 1 million, with annual service contracts adding 8-12% of the purchase price. Smaller hospitals therefore favor refurbished 64-slice units even though diagnostic throughput is lower. One-third of Spain’s CT inventory remains past recommended replacement cycles, raising downtime risk and repair bills. Public tenders attempt to counter cost pressures through group purchasing yet budget ceilings still cap the number of units awarded per region. Maintenance complexity is heightened for photon-counting scanners that require specialized calibration engineers and spare detector modules.
Shortage of Radiologists Lengthening Scan-to-Report Times
Aging radiology personnel and limited residency slots have resulted in an estimated 12-13% attrition rate, creating reporting delays particularly in smaller cities. AI triage solutions route urgent head trauma or pulmonary embolism cases to available readers but do not fully solve staffing gaps. Private groups lure specialists with higher pay and flexible schedules, intensifying geographic imbalances. Teleradiology fills part of the void yet some autonomous communities restrict cross-border reading for medico-legal reasons, prolonging turnaround times in remote areas.
*Our forecasts treat driver/restraint impacts as directional, not additive. The impact forecasts reflect baseline growth, mix effects, and variable interactions.
Segment Analysis
By Product Type: Medium-Slice Systems Drive Modernization
Medium-slice platforms are projected to register a 6.78% CAGR through 2031 as hospitals prioritize balanced performance and cost. High-slice models kept a 35.12% Spain computed tomography market share in 2025, cemented by academic centers that manage complex cardiac and oncology protocols. Hospitals use medium-slice units for emergency throughput, abdominal workups, and routine chest scans, stretching budgets without compromising core capability. The Spain computed tomography market size expansion for medium-slice equipment is further supported by standardized INVEAT specifications that list 64-slice minimums, effectively sidelining low-slice offerings. Photon-counting options slot into the high-end niche, attracting private facilities that differentiate on image clarity.
Budget pressures inside the public system tilt replacement cycles toward modular upgrades rather than full-chassis swaps, extending hardware life while adding AI-based dose management. Rural centers deploy refurbished systems sourced from large urban hospitals, yet still benefit from software enhancements covering metal artifact reduction. Vendor service contracts increasingly bundle remote monitoring that predicts tube wear, a feature that trims unplanned downtime.

By Application: Oncology Leadership Amid Neurology Acceleration
Oncology held 31.05% share in 2025 as CT remains fundamental for tumor staging, radiation planning, and recurrence surveillance. The Spain computed tomography market size for oncology segments is forecast to keep pace with rising cancer incidence that tops 296,000 new cases in 2025. Neurology scans, driven by stroke codes and dementia workups, are set to grow at 6.85% CAGR, fastest among applications. Stroke prevalence is 2.02% nationally, and door-to-scan times are benchmarked at under 20 minutes for thrombectomy eligibility, stimulating neurology demand.
Cardiovascular studies gain traction on the back of 47% male hypertension prevalence, relying on CT angiography to guide statin therapy and invasive angiograms. Musculoskeletal indications pivot toward low-dose protocols for sports injuries, aligning with Spain’s active aging demographic. AI decision support tools in oncology flag subtle lung nodules and bone metastases, decreasing false negatives and standardizing follow-up intervals.
By Mobility: Mobile Systems Gain Rural Traction
Fixed scanners anchored 65.74% of installations in 2025, yet mobile units are projected to climb at 7.1% CAGR through 2031. Mobile platforms bring chest, trauma, and head imaging to provincial hospitals lacking permanent suites. Coastal regions employ truck-mounted scanners during summer tourist surges, alleviating overflow from local emergency departments. Bedside CT in intensive care units reduces transport risk for ventilated patients while exploiting a compact footprint.
Vendors are refining vibration dampening and generator efficiency to extend mobile uptime across Spain’s varied terrain. Integrated telepresence screens allow radiologists in Madrid to observe scans executed hundreds of kilometers away, improving scan protocol adherence. Private operators run subscription models that supply mobile CT services on scheduled routes, capturing revenue from small clinics without capital capacity.
By End User: Diagnostic Centers Accelerate Growth
Hospitals accounted for 49.20% of scanner placements in 2025 because emergency and in-patient workflows demand round-the-clock imaging. Diagnostic imaging centers show a 7.02% CAGR, propelled by private insurance coverage and consumer preference for short waiting lists. Centers typically house dual-energy or high-slice scanners plus MRI suites, positioning themselves as one-stop shops. Capital groups such as Nexxus Iberia finance chain expansion, standardizing brand experience and raising service quality benchmarks.
Diagnostic centers concentrate in Madrid, Barcelona, and Valencia, regions where private plans dominate. Competitive pricing bundles CT angiography with cardiology consults, edging specialist demand away from public hospitals. Mobile CT vendors complement this ecosystem by leasing hours at rural clinics, broadening reach without bricks-and-mortar investment.
Geography Analysis
Spain’s CT footprint reflects the nation’s economic and demographic mosaic. Madrid and Catalonia combine for nearly 40% of scanner stock, powered by tertiary hospitals and dense private networks. Andalusia is the fastest-growing region through 2031; its coastal provinces host retired and expatriate populations that push imaging volumes for oncology and cardiology. The Basque Country and Valencia leverage strong industrial bases and research clusters, with Valencia acting as an AI hub via Quibim’s imaging development.
Rural regions such as Castilla-La Mancha, Extremadura, and Galicia contend with population decline yet benefit from state-funded mobile programs. These mobile routes follow weekly circuits connecting district hospitals and primary care centers, balancing equity in diagnostic access. The Canary and Balearic Islands service tourist peaks with flexible mobile fleets and seasonal staffing, ensuring throughput for trauma and chest scans. Cross-border care with Portugal influences Extremadura and Galicia, where bilateral agreements allow patient referrals, stabilizing demand despite local demographics. The INVEAT allocation includes regional quotas, anchoring a baseline of two new CT units per underserved province by 2026. Implementation pace varies, with decentralized regions finalizing tenders slower than centrally managed ones. Procurement audits in Andalusia temporarily slowed rollouts but also spurred transparent tender reforms.
Regulatory Landscape
Spain regulates CT medical devices under the EU MDR. The Spanish Agency of Medicines and Medical Devices (AEMPS), under the Ministry of Health, acts as the competent authority for device oversight, clinical investigations, and post-market surveillance.
Royal Decree 192/2023 requires medical devices placed on the Spanish market to be registered in the national database administered by AEMPS. Spain also participates in the Voluntary Harmonisation Procedure (VHP) to streamline multi-state clinical trial applications for imaging devices.
Competitive Landscape
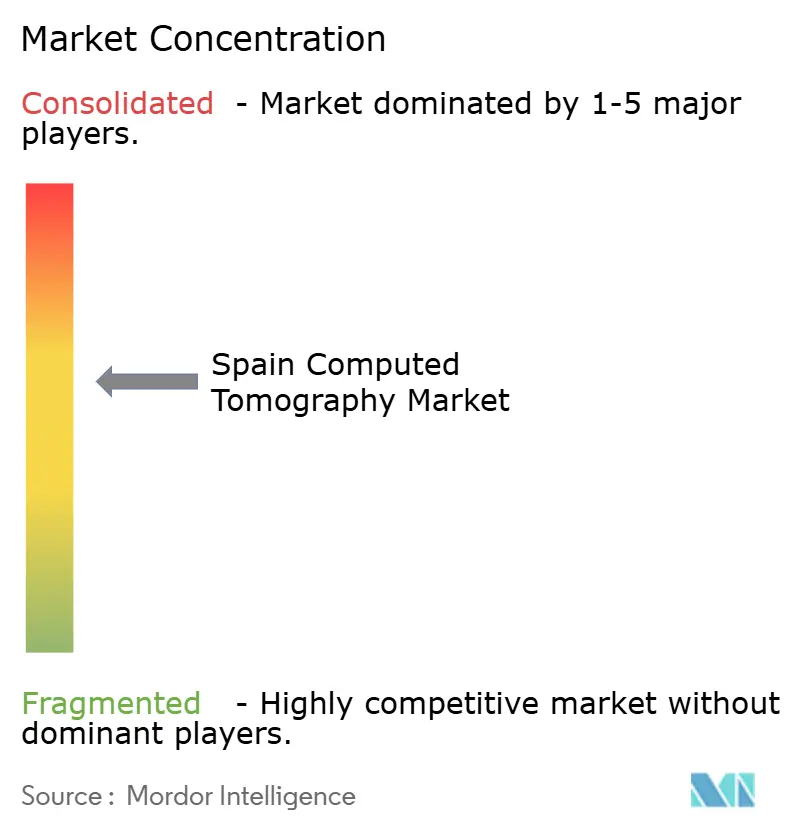
The Spain computed tomography market is moderately consolidated. GE HealthCare, Siemens Healthineers, Philips, and Canon Medical Systems supply the majority of hardware. Siemens capitalizes on photon-counting early-bird adoption and recently signed a EUR 60.3 million multi-vendor partnership with Nantes University Hospital that includes nine CT scanners, reinforcing service-based revenue streams. GE HealthCare commands cardiology niches with its Revolution line and heads a EUR 25.3 million Thera4Care consortium that advances cancer theranostics.
Local innovators shape the AI stack. Valencia-based Quibim raised USD 50 million to scale multi-modal imaging algorithms that embed into vendor-neutral viewers. Partnerships with Philips integrate AI lesion characterization into routine workflows. Private hospital group Ribera Salud is expanding into Aragon and Asturias, enhancing bargaining power over equipment pricing while widening regional service coverage. Mergers among diagnostic chains are expected as private equity seeks to pool procurement leverage and brand presence.
White-space growth lies in mobile fleet operators that provide subscription-based rural coverage and in turnkey AI platforms that streamline radiologist throughput. Market risk stems from procurement scrutiny, as evidenced by the EUR 1.223 billion Andalusian contract investigation. Vendor compliance programs and local service centers become decisive differentiators in future tenders.
Spain Computed Tomography Industry Leaders
-
GE Healthcare
-
Canon Medical System
-
Koninklijke Philips N.V.
-
Fujifilm Holdings Corporation
-
Siemens Healthineers AG
- *Disclaimer: Major Players sorted in no particular order
Market Opportunities and Future Outlook
The EUR 400 million INVEAT equipment renewal plan is the main whitespace lever for replacing aging CT fleets and standardizing minimum specifications (notably 64-slice class platforms) across public tenders, with Madrid linking all public hospitals to a unified imaging network scheduled for completion by end-2025. Private insurers now cover about 26% of Spain’s residents, creating a premium segment for high-slice and spectral CT configurations.
Vendors are balancing cost and performance for public tenders with upgrades to AI-enabled workflows. Sustainability and circular procurement models are also starting to show up in replacement cycles, reinforced by Philips' 25.5% of Spain sales tied to circular business models in 2026.
Recent Industry Developments
- July 2026: Siemens Healthineers installed a new Photon Counting Computed Tomography (PCTC) system as part of a 10-year strategic technology partnership with Hospiten for the new Madrid Boadilla Hospital. The upgrade signals a CT technology expansion within a major private hospital network. The capacity expansion supports higher private-sector radiology throughput and adds photon counting performance across Madrid's CT fleet.
- March 2025: GE HealthCare unveiled the Revolution Vibe CT system featuring Unlimited One-Beat Cardiac imaging and AI solutions to enhance cardiovascular workflows. The launch accelerates adoption of AI-ready CT platforms in Spain. It also reinforces GE's position in cardiology imaging workflows while expanding AI-driven workflow enhancements.
- January 2025: Quibim closed a USD 50 million Series A round to advance AI interpretation tools across MRI, CT, and PET modalities. The investment expands AI imaging interpretation capabilities for CT workflows. This supports AI stack integration in Spain radiology, helping hospitals and clinics move toward faster and more consistent CT analysis.
Research Methodology Framework and Report Scope
Market Definition and Coverage
For this study, the Spain computed tomography (CT) market is defined as the value generated from the sale and deployment of CT systems used for clinical imaging in Spain, covering fixed and mobile installations across care settings.
Scope exclusions: We exclude non-CT modalities (such as MRI, ultrasound, and X-ray) and we do not count imaging procedure reimbursement revenue.
Segmentation Overview
- By Product Type
- Low Slice
- Medium Slice
- High Slice
- By Application
- Oncology
- Neurology
- Cardiovascular
- Musculoskeletal
- Other Applications
- By Mobility
- Fixed Systems
- Mobile Systems
- By End User
- Hospitals
- Diagnostic Imaging Centers
- Others
Data Sources, Market Sizing, and Validation
Desk Research
Desk research starts with mapping the installed base and demand signals for CT in Spain, and then aligning them with procurement, regulatory, and care delivery realities. We used public sources such as Spain's Ministry of Health releases, OECD Health Statistics, Eurostat health and population series, and the European Commission public procurement portal, which helped ground volumes and replacement logic.
To make the model practical, we also reviewed sources such as peer reviewed radiology journals for utilization and clinical adoption cues, plus company annual reports, investor presentations, and credible press for product rollout timing and pricing direction. Where needed, paid subscriptions for company financials, patent databases, and global tenders were used to cross-check supplier exposure and contract activity. This list is not exhaustive, and additional public and paid references were used for data collection, validation, and clarification.
Primary Interviews and Surveys
Primary work focused on validating how procurement cycles, replacement timing, and typical configuration choices play out within Spain's public and private imaging networks. We spoke with a mix of hospital radiology leaders, diagnostic imaging center operators, service partners, and distributor-level stakeholders, and then used follow-up checks to close gaps on pricing ranges and the share of mobile deployments.
Findings from these discussions were used to confirm what was seen in desk research, and to stress-test assumptions that can shift totals, such as average selling price movement, adoption of higher slice systems, and the pace of upgrades for advanced clinical use.
Distribution of primary research fieldwork respondents
| Company type | Respondent position |
|---|---|
| Top tier: 29% | CXOs: 12% |
| Mid tier: 49% | Functional/Unit leaders: 37% |
| Smaller Players: 22% | Managers: 51% |
Market-Sizing & Forecasting
Sizing starts with a top-down build where public spend signals, equipment procurement patterns, and replacement cycles are used to reconstruct annual CT system demand in Spain, and then converted to value using realistic price bands. To keep the totals honest, we've also done selective bottom-up checks using supplier presence, distributor channel reads, and sampled system ASP multiplied by likely unit placements, then adjusted for gaps where coverage was thin.
Inputs that mattered most included the expected CT replacement interval in hospitals, the split between fixed and mobile deployments, the mix shift toward higher slice configurations, the pace of new site additions in diagnostic imaging centers, and the direction of system ASPs after currency timing and typical discounting are considered. Where interview feedback pointed to uneven purchasing in a given year, the model allowed for lumpy tenders rather than forcing a smooth curve.
Forecasts were built using scenario analysis, because capital budgets and tender timing can change quickly even when clinical demand stays steady. Assumptions for unit growth and pricing were aligned to expert consensus gathered in primary discussions, and then checked so the implied penetration and replacement logic stayed within reasonable bounds year by year.
Data Validation & Update Cycle
Model outputs were checked against independent signals such as public tender visibility, installed base direction, and reported imaging infrastructure priorities, and then reviewed for year-to-year jumps that did not match known procurement cycles. When variances appeared, we re-opened the assumptions, repeated the arithmetic, and re-contacted selected experts to confirm whether a shift was real or just a data artifact.
Before sign-off, the work goes through multiple analyst reviews so formulas, conversions, and scope choices are consistent across the full time series. Reports are refreshed annually, and interim updates are made when a material change affects demand or pricing assumptions. Right before delivery, an analyst performs a final update pass so clients receive the most current view possible.
Mordor Intelligence's Spain Computed Tomography Ct Market Size Compared With Other Published Estimates
Published market sizes for CT in Spain can differ even when they appear to track the same product, because the scope and timing choices are rarely identical. The biggest swings usually come from what is counted as CT (for example, whether mobile systems are included), what year is treated as the base, and how pricing is handled when procurement is tender-driven.
In our review, the spread also relates to whether adjacent technologies are mixed in, how aggressively the upgrade cycle is assumed for higher slice systems, and whether the value reflects end-user spending versus narrower manufacturer revenue. Currency timing and refresh cadence matter too, because a newly awarded tender can shift one year more than the trend would suggest.
Benchmark comparison
| Source | Market Size | Gaps in Research Methodology |
|---|---|---|
| Mordor Intelligence | USD 0.27 B (2026) | |
| Industry Publisher A | USD 0.49 B (2026) | Uses a broader technology definition that explicitly folds in cone-beam and spectral or photon-counting categories under one computed tomography bucket, which inflates the equipment value pool compared with conventional CT-only scope. |
| Industry Publisher B | USD 0.08 B (2025) | Likely reflects a narrower revenue lens, closer to scanner-only sales without consistently capturing installation and configuration uplift, and it is anchored to a different base year with limited clarity on pricing updates. |
Taken together, the gap is mostly explained by what gets grouped into the CT label and how completely the transaction value is captured at the time of purchase. By keeping the scope tied to CT systems deployed in Spain and cross-checking tender timing with realistic ASP bands, the 2026 total stays traceable to repeatable steps, which is the modeling choice applied by Mordor Intelligence.
Key Questions Answered in the Report
What is the current value of the Spain computed tomography market?
The Spain computed tomography market is valued at USD 267.97 million in 2026.
How fast will the Spain computed tomography market grow by 2031?
It is projected to expand at a 6.05% CAGR, hitting USD 359.44 million by 2031.
Which segment holds the largest Spain computed tomography market share?
High-slice scanners dominate with 35.12% share in 2025, driven by cardiac and oncology demand.
Why are mobile CT units gaining traction in Spain?
Mobile scanners grow at 7.1% CAGR because they improve access in rural and tourist regions that lack fixed installations.
How is private health insurance influencing CT scan volumes?
Private coverage now reaches 26% of Spaniards, cuts wait times, and boosts premium scan demand in urban diagnostic centers.