
Space Lander And Rover Market Size and Share
Market Overview
| Study Period | 2020 - 2031 |
|---|---|
| Market Size (2026) | USD 1.07 Billion |
| Market Size (2031) | USD 1.47 Billion |
| Growth Rate (2026 - 2031) | 6.43 % |
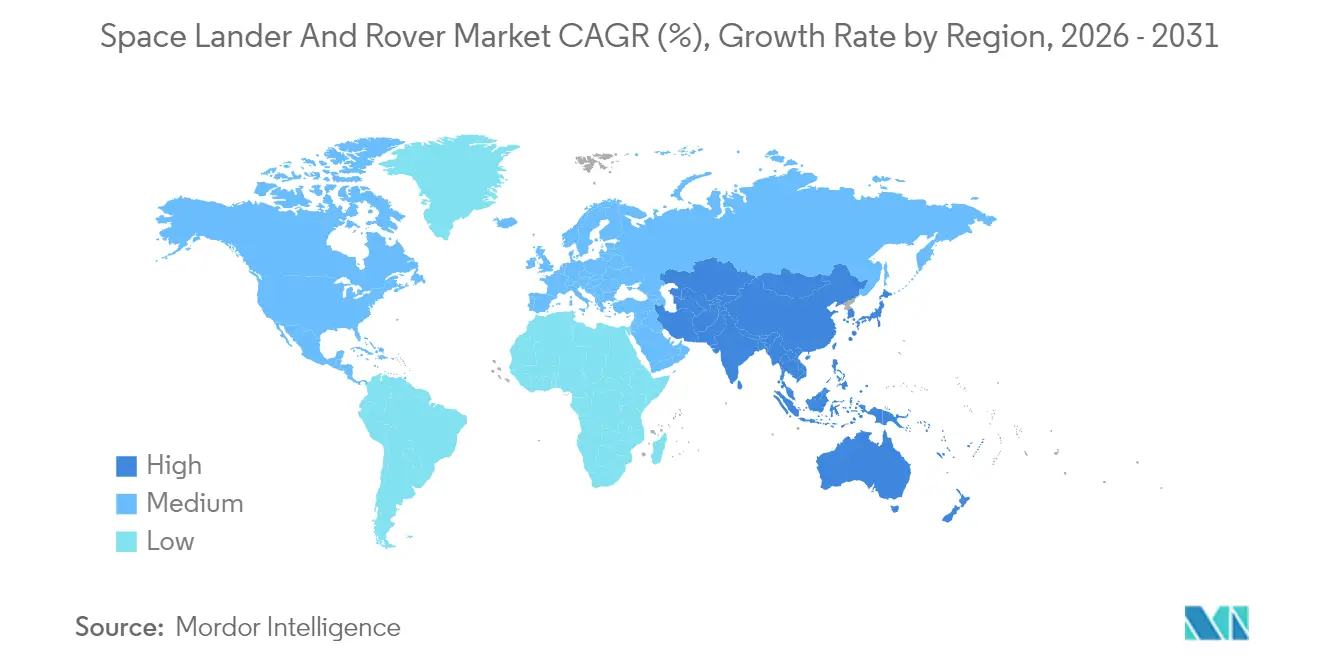
| Fastest Growing Market | Asia Pacific |
| Largest Market | North America |
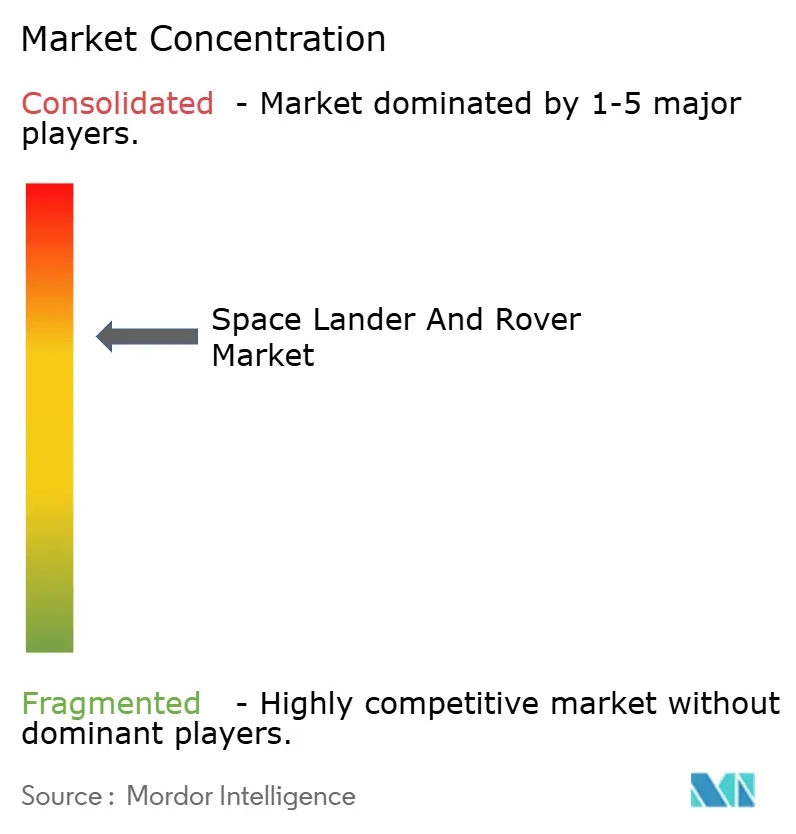
| Market Concentration | Medium |
Major Players *Disclaimer: Major Players sorted in no particular order Image © Mordor Intelligence. Reuse requires attribution under CC BY 4.0. | |
Space Lander And Rover Market Analysis by Mordor Intelligence
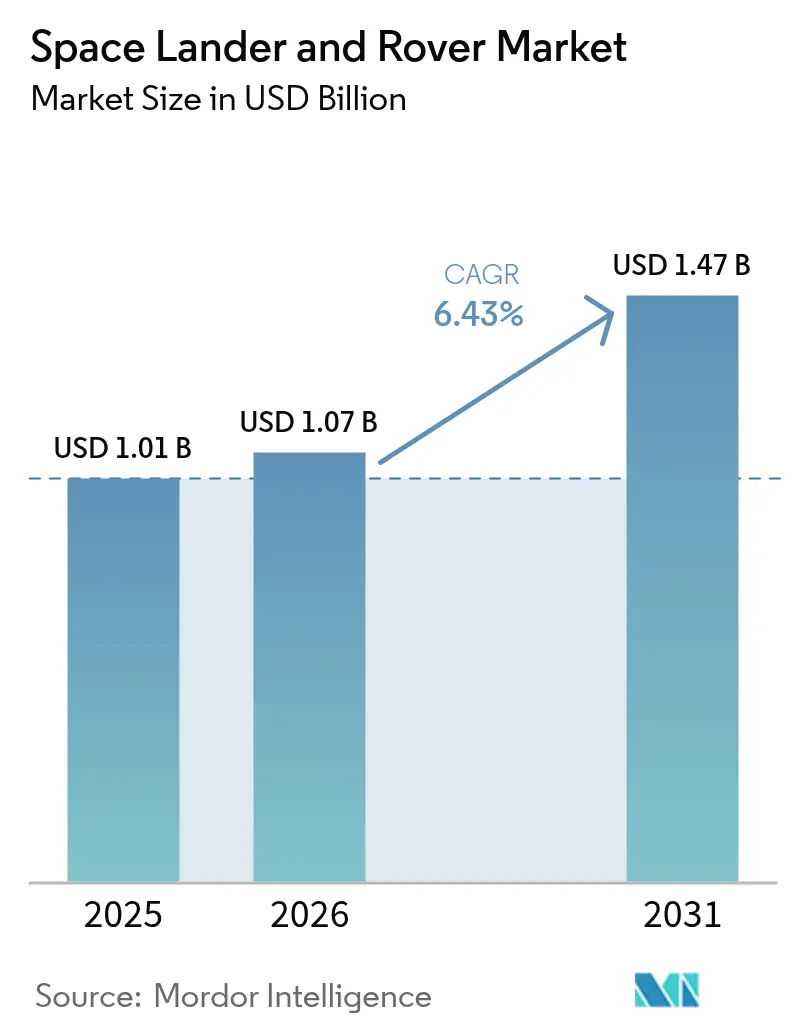
The space lander and rover market size is expected to grow from USD 1.01 billion in 2025 to USD 1.07 billion in 2026 and is forecast to reach USD 1.47 billion by 2031 at 6.43% CAGR over 2026-2031. Solid government budgets, a surge of commercial partnerships, and rapid progress in autonomous navigation keep the space lander and rover market on an upward path. Momentum from NASA’s Artemis program, China’s parallel lunar plans, and ESA’s commitment to launch ExoMars Rosalind Franklin in 2028 underpin demand. Medium-class platforms anchor revenue today, yet micro systems are scaling quickly as miniaturization trims launch mass and cost. Meanwhile, hopper and legged vehicles extend surface reach, and fuel-cell power systems gain traction where sunlight is scarce. Commercial firms now win fixed-price delivery contracts, lowering cost barriers and widening mission cadence.
Key Report Takeaways
- By target body, lunar missions held 45.62% of the space lander and rover market share in 2025; asteroid and comet exploration is projected to expand at a 10.21% CAGR through 2031.
- By platform mass class, the medium segment led with 31.02% revenue share in 2025, while micro platforms are poised for an 8.39% CAGR to 2031.
- By mobility type, wheeled systems accounted for 46.88% of the space lander and rover market size in 2025, whereas hopper landers recorded the fastest growth at 7.95% CAGR.
- By power source, solar arrays dominated with a 55.66% share in 2025; fuel-cell solutions are advancing at a 9.74% CAGR through 2031.
- By end user, government agencies commanded 61.25% share in 2025, yet commercial players register the highest 9.52% CAGR.
- By geography, North America controlled 32.44% of 2025 revenue; Asia-Pacific is set to grow at an 8.27% CAGR on the strength of Chinese and Indian lunar programs.
Note: Market size and forecast figures in this report are generated using Mordor Intelligence’s proprietary estimation framework, updated with the latest available data and insights as of 2026.
Market Trends and Insights
Drivers Impact Analysis of Space Lander And Rover Market*
| Driver | ( ~ ) % Impact on CAGR Forecast | Geographic Relevance | Impact Timeline |
|---|---|---|---|
| Expansion of globally coordinated lunar exploration initiatives | +1.8% | Global (US, China, Europe) | Medium term (2-4 years) |
| Growing planetary science investments and mission pipeline | +1.2% | North America and EU, expanding to APAC | Long term (≥ 4 years) |
| Technological advancements in ultra-lightweight rover materials | +0.9% | Global, led by advanced manufacturing hubs | Medium term (2-4 years) |
| Acceleration of in-situ resource utilization (ISRU) testbed missions | +0.7% | Moon-focused regions | Long term (≥ 4 years) |
| Emergence of commercial payload sponsorship and rideshare models | +0.6% | North America core, expanding globally | Short term (≤ 2 years) |
| Rising demand for autonomy-driven terrain navigation and hazard avoidance | +0.5% | Global | Medium term (2-4 years) |
| Source: Mordor Intelligence | |||
Expansion of Globally Coordinated Lunar Exploration Initiatives
Forty-seven nations have signed the Artemis Accords, standardizing surface protocols and enabling interoperable rovers serving multiple stakeholders.[1] China aims to place astronauts on the Moon by 2030, paired with Chang’e 7 and Chang’e 8, and create a parallel infrastructure that multiplies vehicle demand. The LUPEX mission by ISRO and JAXA shows how combining budgets delivers a 250 kg class rover that neither agency would field alone. ESA’s Heracles concept, staged from the Lunar Gateway, adds multi-agency cargo runs that require rugged autonomous vehicles. These coalitions shift procurement from bespoke one-off craft to modular fleets suited for diverse payloads.
Growing Planetary Science Investments and Mission Pipeline
NASA’s planetary science budget surpasses USD 3 billion annually, and ESA secures EUR 2.7 billion (USD 3.19 billion) for exploration through 2030. A dense manifest now includes low-cost Mars missions at USD 300 million each, China’s Tianwen-2 asteroid return in 2025, ESA’s Ramses mission to Apophis in 2028, and Japan’s MMX visit to Martian moons. The commercial lunar payload services program funnels USD 2.6 billion in fixed-price contracts to private lander firms, encouraging standardized rover frames that are easily tailored for individual payloads. Continuous launches stabilize production lines and shorten learning curves, propelling the space lander and rover market.
Technological Advancements in Ultra-Lightweight Rover Materials
New composites cut chassis mass by up to 40% without sacrificing strength. Carbon-nanotube structures and aerogel insulation broaden temperature tolerance to –230 °C-120 °C. NASA’s C-103 niobium and ToughMet alloys raise heat resilience for reusable fittings. Additive manufacturing with processed lunar regolith was demonstrated in 2024, reducing Earth-launched mass by 60%. Weight savings open the micro-platform niche and support rideshare launches, widening participation in the space lander and rover market.
Acceleration of In-Situ Resource Utilization (ISRU) Testbed Missions
The Perseverance rover’s MOXIE unit produced oxygen on Mars in 2024, confirming on-site life-support potential. Lunar rovers now integrate drills and reactors that extract water ice and oxygen, laying the groundwork for propellant depots. 3D-printing attachments can turn regolith into landing pads or shelter walls, pivoting vehicles from pure science to infrastructure roles. Commercial builders such as Lunar Outpost position ISRU rovers as revenue generators, expanding the space lander and rover industry beyond exploration to resource development.
Restraints Impact Analysis of Space Lander And Rover Market*
| Restraint | ( ~ ) % Impact on CAGR Forecast | Geographic Relevance | Impact Timeline |
|---|---|---|---|
| Escalating R&D costs and frequent schedule delays | -0.8% | Global, high-complexity missions | Short term (≤ 2 years) |
| Limited planetary-launch windows and capacity | -0.6% | Global | Long term (≥ 4 years) |
| Strict planetary protection and biocontamination compliance | -0.5% | Global, with stricter enforcement in Mars missions | Medium term (2-4 years) |
| Thermal and radiation shielding challenges in extreme environments | -0.4% | Outer solar system and polar regions primarily | Long term (≥ 4 years) |
| Source: Mordor Intelligence | |||
Escalating R&D Costs and Frequent Schedule Delays
NASA’s Mars Sample Return program grew to USD 11 billion and now faces an undefined launch date. ESA’s ExoMars rover was re-scoped after losing Russian hardware, adding years to the calendar. Advanced autonomy, radiation shielding, and deep-drill systems raise qualification hurdles, while smaller firms underestimate planetary certification demands. Cost overruns force agencies to trim flight opportunities, tempering potential gains for the space lander and rover market.
Limited Planetary-Launch Windows and Capacity
Mars transfer windows open every 26 months; heavy-lift launches cost upward of USD 100 million and remain tightly booked. Payload sterilization adds months of lead time, and conflicts arise when multiple missions target the same trajectories. Tight cycles restrict cadence no matter how many rovers are ready, capping realizable growth.
*Our forecasts treat driver/restraint impacts as directional, not additive. The impact forecasts reflect baseline growth, mix effects, and variable interactions.
Space Lander And Rover Market Segment Analysis
By Target Body:
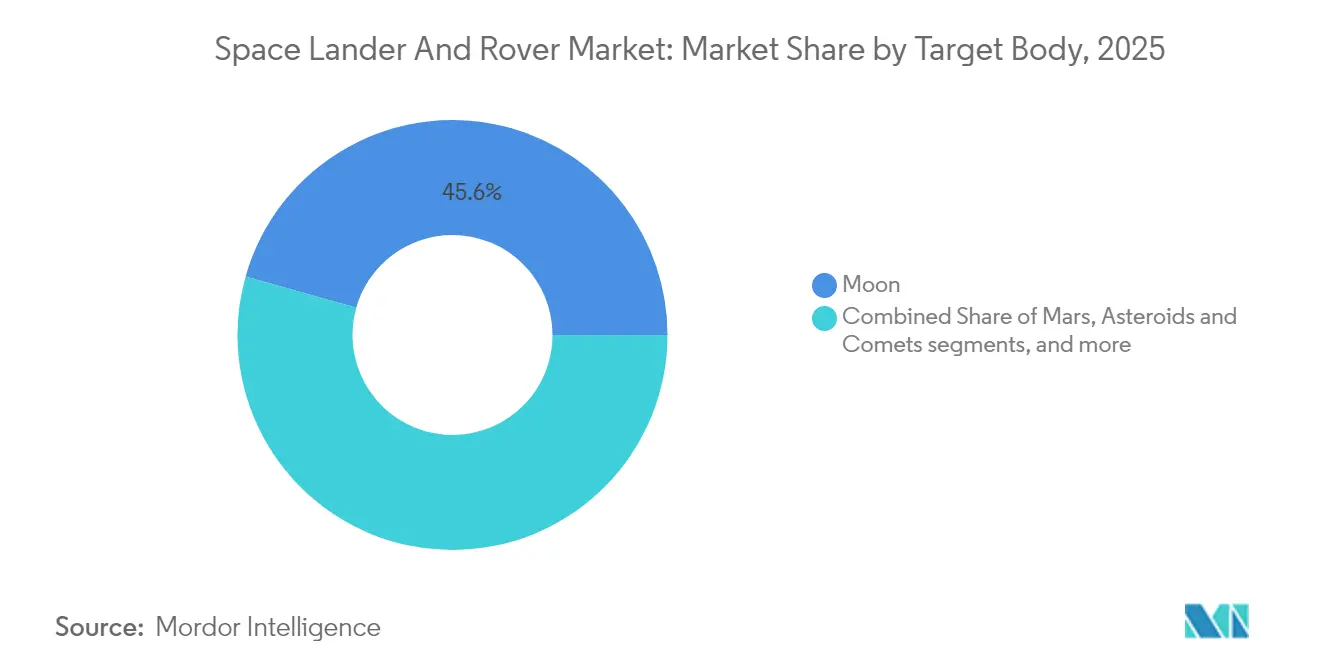
Lunar Missions Drive Revenue While Asteroid Projects SurgeLunar programs contributed 45.62% of the space lander and rover market share in 2025. Continued Artemis surface sorties, Chang’e cargo runs, and commercial payload deliveries anchor spending. However, asteroid and comet projects deliver the fastest 10.21% CAGR to 2031 as small-body sampling feeds science and resource appraisal. Mars missions hold steady with Perseverance and the 2028 ExoMars lander, while outer-solar-system concepts such as Enceladus rovers appear in agency roadmaps. Broader celestial coverage diversifies the space lander and rover market and underpins its long-term stability.
Growing interest in planetary defense also promotes asteroid rovers that map composition and internal structure. The success of the OSIRIS-REx sample return spurs more reconnaissance craft. Europa and Enceladus become reachable as nuclear power and autonomy mature, extending the addressable market into icy-moon environments that demand new thermal designs.

By Platform Mass Class:
Medium Units Prevail as Micros Scale FastMedium craft held 31.02% of 2025 revenue, balancing payload capacity against launch price. Perseverance exemplifies their endurance and laboratory-grade instruments. At the same time, micro platforms post an 8.39% CAGR by leveraging miniaturized sensors and shared rides. Swarms of sub-100 kg rovers provide redundancy and broad terrain coverage, reshaping mission architecture toward distributed networks.
Small and heavy categories fill niche roles. Small systems scout landing zones, while heavy flagships carry deep drills or ISRU reactors. Yet advances in lightweight alloys mean tasks once reserved for 800 kg vehicles can migrate to 200 kg frames. That shift lowers overall mission cost and enlarges the pool of operators entering the space lander and rover market.
By Mobility Type:
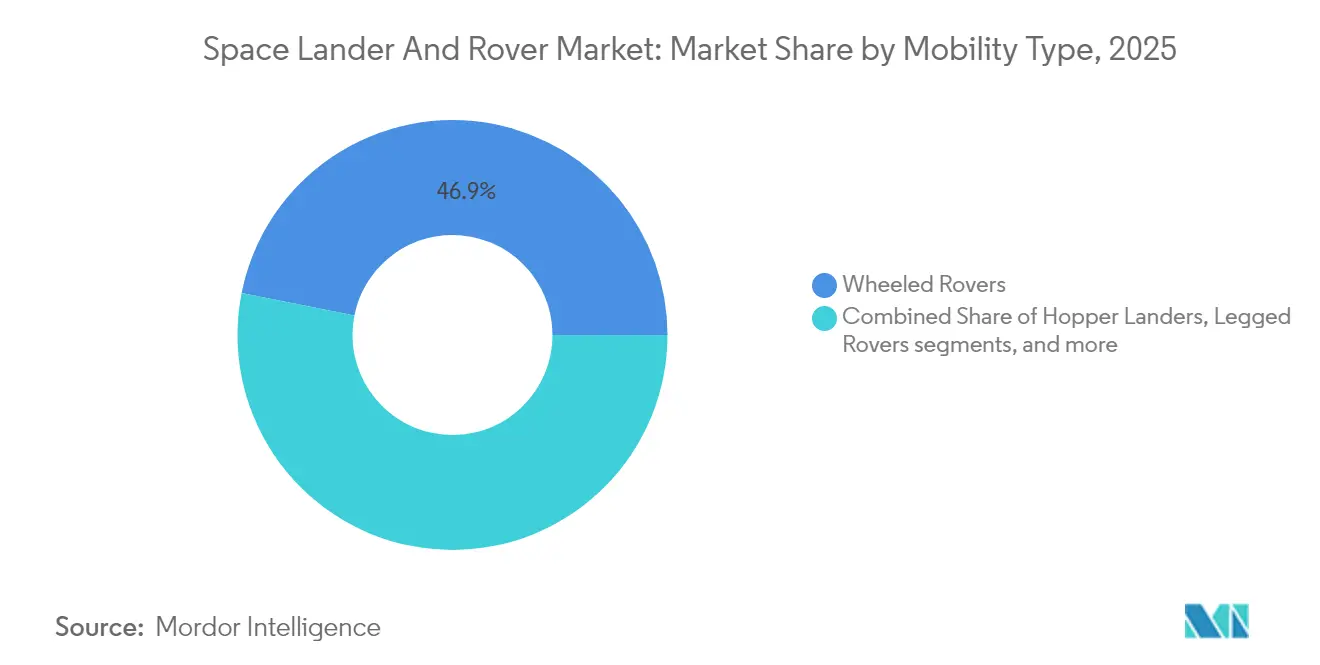
Wheels Dominate as Hoppers Open New GroundWheeled designs delivered 46.88% of the space lander and rover market size in 2025, buoyed by a proven rocker-bogie suspension that tackles moderate slopes. Propelled by controlled ballistic hops, Hopper craft registers an 7.95% CAGR. They reach crater rims and lava tubes without complex climbing actuators. Legged concepts, including quadrupeds with wheel-leg hybrids, progress from labs to field tests, promising better footing on boulder fields.
Tracked carriers and hybrid formats round out options where load distribution or adaptability outweigh speed. Flexibility in locomotion lets agencies match terrain with vehicle style, promoting platform diversity and fueling competitive differentiation across the space lander and rover market.
By Power Source:
Solar Leads, Fuel-Cells Catch UpSolar panels supplied 55.66% of 2025 revenue, with >30% efficient multi-junction cells toughened for dust and thermal cycles. Yet shadowed craters and 14-day lunar nights drive a 9.74% CAGR for fuel cells, which store reactants and run continuously. Regenerative hydrogen-oxygen stacks are under trial for Artemis surface ops and promise multi-mission reuse. RTGs remain indispensable for outer-planet journeys, and new Americium-241 units extend supply security. Battery-only packs serve quick sorties and act as contingency reserves.
Hybrid architectures blend solar, RTGs, and batteries, ensuring fail-safe operations. Diverse power options extend mission latitude, expanding the space lander and rover market into deeper and darker destinations.
By End User:
Government Keeps Lead, Commercial Grows FastGovernment agencies held 61.25% of 2025 revenue, funded by steady public budgets. However, the Commercial Lunar Payload Services framework pushes private firms toward a 9.52% CAGR. Companies such as Astrobotic and Intuitive Machines offer standardized landers that host multiple rover customers on fixed-price flights. Research universities ride these buses with niche instruments, while defense departments test reconnaissance payloads for cislunar awareness.
The symbiosis widens mission queues and reallocates risk. As private capital funds hardware alongside public grants, the space lander and rover market gains resilience against policy swings. Fixed-price service contracts have replaced many cost-plus agreements. Commercial providers front development capital, recouping investment over repeat flights. The result is launch cadence acceleration, lower per-mission expense, and a bigger pipeline of payloads. Governments still direct policy and own strategic objectives, but private operators supply the hardware at industrial scale, reinforcing the virtuous cycle of demand and capacity in the space lander and rover market.
Geography Analysis
North America Space Lander and Rover Market
North America commanded 32.44% of 2025 revenue thanks to NASA’s USD 3 billion-plus planetary science line and a dense cluster of prime contractors. Integrated supply chains, test ranges, and regulatory clarity shorten development loops. SpaceX Starship, Blue Origin New Glenn, and ULA Vulcan boost lift capacity, enabling heavier rovers and aggregated payload classes that widen program options.
Europe, North America and APAC Space Lander and Rover Market
Europe secures second place on the strength of ESA’s EUR 2.7 billion (USD 3.19 billion) exploration envelope and forthcoming ExoMars liftoff in 2028. Airbus, Thales Alenia Space, and OHB supply propulsion, avionics, and structures. The region blends scientific rigor with sustainability aims, accelerating reusable lander stages and low-contamination sampling gear. Inter-agency collaboration remains Europe’s hallmark, drawing in Canada and Japan to share cost and expertise.
APAC Space Lander and Rover Market
Asia-Pacific posts the fastest 8.27% CAGR. China’s dual-launcher cadence underpins Chang’e and Tianwen missions, while its planned 2030 crewed landing drives procurement of heavy lunar rovers. India’s ISRO scales Chandrayaan heritage into the LUPEX drill rover with JAXA, and Japan’s MMX mission illustrates multi-body reach. Emerging space startups contribute cost-efficient components, reshaping supply dynamics for the space lander and rover market.
Regulatory Landscape
Regulation for landers and rovers is shaped by mission authorization, launch and reentry licensing, and planetary-protection compliance, with government procurement rules increasingly acting as de facto technical standards. In the United States, the FAA transitioned commercial space launch and reentry licensing to the performance-based Part 450 framework effective March 9, 2026, aligning compliance pathways across varied vehicle configurations used to deliver lunar landers and rover payloads.
Policy and program requirements also shape design choices such as interoperability and contamination control. A White House Executive Order signed December 18, 2025 directed reforms to space acquisition processes by mid-2026 to prioritize commercial solutions, reinforcing service-based procurement models used for lunar delivery. In April 2026, the FAA issued a policy statement to impose user fees for launch and reentry licensing and permitting based on payload mass (capped per launch), adding a cost line that commercial lunar delivery providers factor into mission pricing. NASA also tightened technical anchors for surface systems through Moon Base architecture guidance emphasizing interoperability for power, docking, and communications, and advanced the commercial procurement pathway via its CLPS 2.0 final request for proposal released May 15, 2026.
Value Chain Analysis
The value chain runs from mission definition and payload sponsorship (NASA, ESA and other agencies) to prime system integration for landers and rovers (heritage primes and commercial lunar providers), then down to subsystem supply (avionics, power, propulsion, structures, and thermal and radiation protection). It also covers environmental testing and qualification, launch services, and ultimately surface operations supported by software, autonomy, and communications networks. The market continues moving away from bespoke, one-off builds toward standardized platforms with frozen interfaces that can support multiple payload customers, reinforced by fixed-price, performance-based contracting approaches.
Upstream bottlenecks focus on high-reliability electronics, propulsion components, and long-lead qualification and sterilization activities. Downstream constraints include launch availability and integration queues for shared missions. NASA oversight highlights the scale and complexity of supplier dependence across Artemis-era programs through structured supply-chain monitoring, while the Moon Base and CLPS pipelines convert demand into repeatable deliveries rather than single flagship missions. Consolidation and vertical capability building are also visible, including Voyager Technologies completing its acquisition of Astrobotic in June 2026 to broaden lunar infrastructure capabilities, and Blue Origin reporting multiple Blue Moon landers in various assembly stages, which points to dedicated production lines and parallel builds to manage schedule and mission risk.
Competitive Landscape
The space lander and rover market is moderately concentrated, where heritage aerospace primes coexist with nimble newcomers. NASA, ESA, CNSA, and ISRO set technical baselines and mission needs. Lockheed Martin Corporation, Northrop Grumman, and Airbus SE leverage decades of flight heritage to secure large system contracts. Against them, Astrobotic, Intuitive Machines, iSpace, Inc., and Lunar Outpost commercialize modular landers and micro rovers under fixed-price terms, widening customer access.
Strategic alliances, rather than head-to-head fights, dominate. The Commercial Lunar Payload Services cohort teams with NASA on payload integration, while ISRO and JAXA share LUPEX responsibilities. Artificial intelligence is an emerging differentiator; JPL’s onboard machine-learning routines for Perseverance automate hazard avoidance and sample triage. Start-ups emphasize autonomy to offset limited ground control budgets, positioning software prowess as a route to market share. Standardized chassis and reusable propulsion units further shrink costs, encouraging procuring fleets rather than single craft and broadening the space lander and rover market customer base.
Space Lander And Rover Industry Leaders
-
National Aeronautics & Space Administration (NASA)
-
Lockheed Martin Corporation
-
Airbus SE
-
Blue Origin Enterprises, L.P.
-
Indian Space Research Organisation (ISRO)
- *Disclaimer: Major Players sorted in no particular order
Space Lander And Rover Market Companies Covered in this Report
- National Aeronautics & Space Administration (NASA)
- China Aerospace Science and Technology Corporation (CASC)
- Lockheed Martin Corporation
- Northrop Grumman Corporation
- Airbus SE
- ROSCOSMOS
- Canadian Space Agency
- Blue Origin Enterprises, L.P.
- Indian Space Research Organisation (ISRO)
- Japan Aerospace Exploration Agency (JAXA)
- ispace, Inc.
- Spacebit
- ASTROBOTIC TECHNOLOGY, INC.
- Space Exploration Technologies Corp.
- Intuitive Machines, LLC
- Thales Alenia Space
- Moon Express Inc.
- Firefly Aerospace Inc.
- Dynetics (Leidos, Inc.)
Market Opportunities and Future Outlook
The largest whitespace sits in scalable lunar surface logistics and mobility delivered as a repeatable service, rather than bespoke spacecraft procurement. NASA continues to use CLPS as an on-ramp for multiple payload owners to reach the lunar surface, and the program cadence through 2028 supports opportunities for standardized rover chassis, payload-adapter kits, and mission operations services that can be reused across deliveries. The Moon Base surface architecture direction on interoperability (power, docking, and communications) also points to demand for common interfaces, qualification tooling, and cross-mission compatibility testing that suppliers can package as products.
Surface mobility and infrastructure roles extend beyond science-only rovers into cargo handling, scouting, and ISRU-support tasks. That broadens the subsystem opportunity set, including night-capable power solutions, thermal management for polar regions, dust-tolerant mechanisms, and autonomy packages. Europe adds a parallel demand center through ESA programs. Argonaut targets its first mission launch by the end of 2030 with up to 1,500 kg cargo delivery to the lunar south pole, and ESA initiated a Venturi Space risk-reduction study starting January 1, 2026 focused on next-generation rover mobility, power, and thermal systems. Japan’s commitment to a pressurized rover (Lunar Cruiser) for crewed surface exploration, with a stated target completion year of 2031, supports a separate opportunity track for crew-rated mobility systems and supporting ground infrastructure such as charging, maintenance, and navigation aids.
Recent Industry Developments in Space Lander And Rover Market
- July 2026: Blue Origin continued production of Blue Moon lunar landers, including multiple Mark 1 vehicles, while recovering from a May 28, 2026, New Glenn launch pad explosion at Cape Canaveral. Keeping assembly moving supports schedule resilience for lunar delivery campaigns and signals parallel-build strategies to reduce single-point program risk.
- May 2026: NASA selected Astrolab and Lunar Outpost to develop Lunar Terrain Vehicles (LTVs) and picked Blue Origin to provide Blue Moon Mark 1 robotic landers to deliver these rovers to the Moon. The awards (including LTV development contracts and an initial Blue Origin Moon Base award with options) reinforce a multi-provider ecosystem where lander and rover suppliers integrate around standardized delivery missions.
- April 2024: Lockheed Martin joined Lunar Outpost, General Motors, The Goodyear Tire & Rubber Company, and MDA Space in the Lunar Dawn team after it was awarded a NASA Lunar Terrain Vehicle Services contract. The teaming structure highlights how rover programs pull automotive-grade mobility know-how and aerospace systems engineering into a single supply base for lunar surface operations.
Space Lander And Rover Market Report Scope and Research Methodology
Market Definition and Coverage
For this study, the market covers revenue generated from space landers and rovers used for surface operations on bodies such as the Moon, Mars, and small bodies. This includes mission-ready platforms and their core subsystems that are sold as part of the vehicle program.
Scope exclusions: We exclude orbiters and pure launch services, and we do not count standalone scientific instruments unless they are bundled within the lander or rover contract value.
Segments Covered in This Report
- By Target Body
- Moon
- Mars
- Asteroids and Comets
- Other Celestial Bodies
- By Platform Mass Class
- Micro
- Small
- Medium
- Heavy
- By Mobility Type
- Wheeled Rovers
- Hopper Landers
- Legged Rovers
- Tracked Rovers
- Hybrid Mobility Platforms
- By Power Source
- Solar
- Radioisotope Thermoelectric Generator
- Fuel-Cell
- Battery-Only
- By End User
- Government Space Agencies
- Commercial Space Companies
- Research Institutions and Universities
- Defense Agencies
- By Geography
- North America
- United States
- Canada
- Mexico
- Europe
- United Kingdom
- Germany
- France
- Italy
- Rest of Europe
- Asia-Pacific
- China
- India
- Japan
- South Korea
- Rest of Asia-Pacific
- South America
- Brazil
- Rest of South America
- Middle East and Africa
- Middle East
- United Arab Emirates
- Saudi Arabia
- Rest of Middle East
- Africa
- South Africa
- Rest of Africa
- Middle East
- North America
Data Sources, Market Sizing, and Validation
Desk Research
Desk work starts with building a clear list of active and planned lunar and planetary surface missions, and then mapping who is supplying landers, rovers, and key subsystems. We used public sources such as NASA budget documents and procurement updates, ESA program pages, and national space agency releases in APAC to understand mission cadence and funding timing. For cross-checks, we also leaned on open government contract notices, parliamentary or congressional budget materials, and peer reviewed papers that clarify technology readiness and typical subsystem content.
To convert these signals into market numbers, we screened annual reports, investor decks, and press disclosures that discuss contract values, delivery schedules, and scope (for example, whether autonomy software and ground-support equipment are included). A paid subscription for company financials and intelligence helped us standardize revenue splits when disclosures were partial. We also used a patent database to validate where new mobility, power, and thermal designs were being developed. This desk source list is not exhaustive, and many other public sources were used for data collection, validation, and clarification during analysis.
Primary Interviews and Surveys
Primary work focused on validating what is actually included in a typical lander or rover program value, and how often program scope changes after award. We spoke with platform primes, subsystem suppliers (mobility, power, avionics, comms, and thermal), and customer-side stakeholders across APAC, EMEA, and the Americas to confirm schedules, pricing logic, and which cost elements are treated as pass-through versus supplier revenue.
Distribution of primary research fieldwork respondents
| Company type | Respondent position | Region |
|---|---|---|
| Top tier: 29% | CXOs: 14% | APAC: 44% |
| Mid tier: 56% | Functional/Unit leaders: 41% | EMEA: 34% |
| Smaller Players: 15% | Managers: 45% | Americas: 22% |
Market-Sizing & Forecasting
Our main build uses a top-down approach where mission pipelines and program funding are reconstructed into an annual demand pool, which is then translated into lander and rover spend by destination and platform class. In practice, each program line is assigned expected award timing, development and build phasing, and the share that typically lands with the vehicle prime versus subsystem suppliers. To keep the totals grounded, we also run selective bottom-up approximations using sampled contract values, published payload delivery awards, and a few supplier roll-ups that indicate realistic revenue capture per mission.
Key inputs used in the model include the count of funded missions by year, average development cycle length, propulsion and power choices that shift vehicle cost, mass class progression (micro, small, and heavier platforms), and the split between government-led and commercially funded missions. The forecast is shaped using scenario analysis because mission slips and rebaselining are common, and then scenarios are adjusted using expert views on budget stability, launch availability, and technology readiness. Where contract value is not disclosed, we fill gaps using program analogs with similar destination and payload class. The final number is accepted only when it aligns with the likely mission cadence and known procurement windows.
Data Validation & Update Cycle
Validation is done by checking whether modeled revenue lines line up with independent signals such as agency budget allocations, announced award values, and expected launch and landing schedules. When an outlier appears, we revisit the assumptions behind timing, scope inclusion, or contract phasing. If the gap cannot be explained from public information, we re-contact the relevant expert. Before sign-off, outputs go through a multi-step analyst review so that unit economics, year splits, and destination shares are consistent with how programs are executed.
The report is refreshed annually, and interim updates are made when major awards, mission cancellations, or schedule shifts materially change the modeled demand pool. Right before delivery, a final pass is completed to incorporate any new public contract notices and program updates so clients receive the most current view.
Mordor Intelligence's Space Lander and Rover Market Sizing Compared With Other Published Estimates
Published market sizes for space landers and rovers often vary because each publisher treats program scope and timing differently, even when they are working from a similar mission set. Differences usually come from what gets counted as vehicle revenue versus pass-through costs, how multi-year development is spread across calendar years, and whether adjacent mission hardware is added into the same bucket.
The table points to a spread that is mainly explained by scope boundaries and year mapping. In Mordor Intelligence's model, the 2026 value is tied to lander and rover platform revenue recognized against the mission execution timeline, and it excludes categories like orbiters and stand-alone payload instruments that are sometimes bundled into broader exploration totals.
Benchmark comparison
| Source | Market Size | Gaps in Research Methodology |
|---|---|---|
| Mordor Intelligence | USD 1.07 B (2026) | |
| Regional Consultancy A | USD 1.12 B (2025) | Uses a different base year and tends to anchor sizing to awarded program values without consistently normalizing multi-year development spend into annual revenue timing, which can lift the stated number versus an execution-phased view. |
| Industry Database B | USD 0.91 B (2025) | Leans more heavily on a narrower list of disclosed deals and applies faster ramp assumptions into later years, which can understate the near-term market when privately negotiated or partially disclosed programs are not captured. |
Across the three figures, most of the gap is not about demand direction. It is primarily about what gets counted and when it is counted. By keeping scope tied to lander and rover platform revenue and then aligning program phasing to calendar years, we arrive at a number that is easier to reproduce and audit using mission cadence, budgets, and contract milestones.
Key Questions Answered in the Report
What is the current value of the space lander and rover market?
The space lander and rover market size is USD 1.07 billion in 2026 and is projected to reach USD 1.47 billion by 2031.
Which celestial target dominates rover demand today?
Lunar missions account for 45.62% of 2025 revenue, driven by Artemis, Chang’e, and commercial payload programs.
Which mobility technology is growing the fastest?
Hopper vehicles post the highest 7.95% CAGR because they can leap over rough terrain that wheels cannot traverse.
Why are fuel-cells gaining attention for planetary rovers?
Fuel-cells provide continuous power during long lunar nights or in shadowed craters where solar arrays are ineffective, supporting a 9.74% CAGR in their adoption.
How big is the commercial segment compared with government users?
Government agencies still hold 61.25% share, but commercial operators are expanding rapidly at a 9.52% CAGR thanks to fixed-price payload delivery contracts.
Which region is expected to grow the quickest?
Asia-Pacific records an 8.27% CAGR on the strength of Chinese, Indian, and Japanese exploration initiatives.