
Soybean Market Size and Share
Soybean Market Analysis by Mordor Intelligence
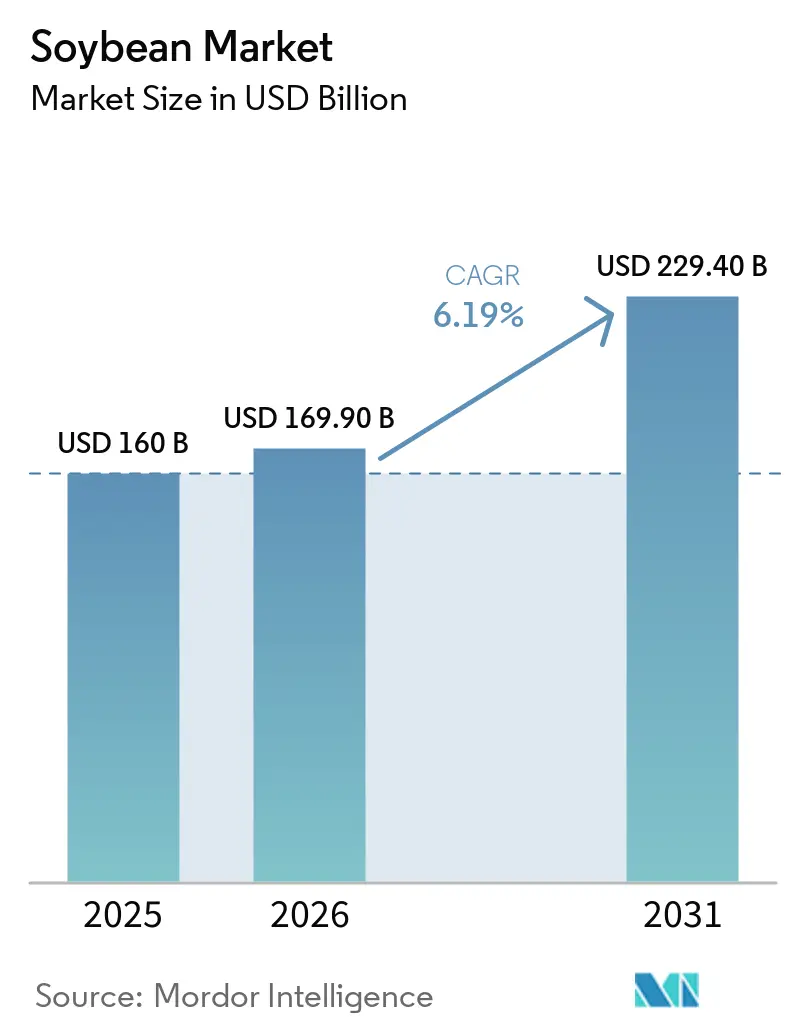
Soybean market size in 2026 is estimated at USD 169.9 billion, growing from 2025 value of USD 160 billion with 2031 projections showing USD 229.4 billion, growing at 6.19% CAGR over 2026-2031. Upbeat demand for high-protein feed, rapid biofuel adoption, and steady plant-based food growth continue to reshape supply chains, pricing, and processing strategies within the soybean market. Crushing margins remain attractive as soybean oil’s share of United States biofuel feedstocks climbed from less than 1% in 2001 to 46% in 2024, incentivizing a wave of refinery-linked crush projects. On the supply side, record Brazilian harvests and United States productivity gains keep aggregate supplies comfortable, although extreme weather and logistics bottlenecks still trigger episodic price volatility. Competition pivots on traceability, climate-smart traits, and synchronized investments that capture value across meal, oil, and specialty soy streams.
Key Report Takeaways
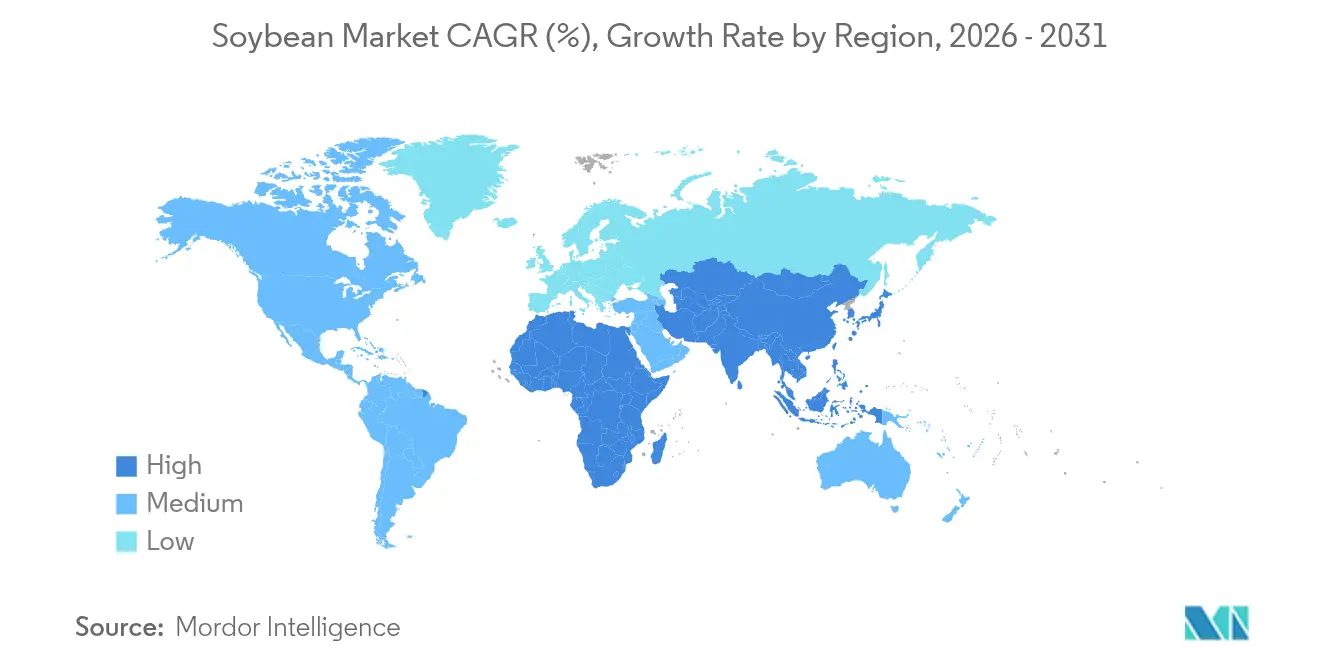
- By geography, Asia-Pacific commanded 44.70% of the soybean market in 2025, and Africa is set to register the fastest 7.58% CAGR during the forecast period.
Note: Market size and forecast figures in this report are generated using Mordor Intelligence’s proprietary estimation framework, updated with the latest available data and insights as of 2026.
Global Soybean Market Trends and Insights
Drivers Impact Analysis*
| Driver | (~) % Impact on CAGR Forecast | Geographic Relevance | Impact Timeline |
|---|---|---|---|
| Expansion of biofuel mandates boosting soybean-oil demand | +2.1% | Global, strongest in North America and Europe | Medium term (2-4 years) |
| Growth in high-protein animal feed (soybean meal) usage | +1.8% | Global, led by Asia-Pacific and South America | Long term (≥4 years) |
| Rising demand for plant-based protein and dairy substitutes | +1.2% | North America, Europe, Asia-Pacific urban centers | Medium term (2-4 years) |
| Commercialization of drought-tolerant, high-yield cultivars | +0.8% | Global, critical in marginal climate zones | Long term (≥4 years) |
| Blockchain-based traceability premiums for deforestation-free soy | +0.6% | Europe, North America premium markets | Short term (≤2 years) |
| Localized crush-plant build-outs reducing logistics cost | +0.7% | North America, South America, emerging in Africa | Medium term (2-4 years) |
| Source: Mordor Intelligence | |||
Expansion of Biofuel Mandates Boosting Soybean-Oil Demand
Stronger renewable fuel standards in the United States, the European Union, and Brazil have repositioned soybean oil from a meal by-product to a strategic energy feedstock. The United States Environmental Protection Agency established a biomass-based diesel requirement of 7.12 billion RINs (Renewable Identification Numbers) for 2026. This target necessitates approximately 5.6 billion gallons of biodiesel production and the processing of up to 524 million additional bushels[1]Source: Environmental Protection Agency, “Renewable Fuel Standard Final Rule 2026,” epa.gov. Renewable diesel output surpassed traditional biodiesel at 2.3 billion gallons in 2024, and soybean oil supplied 28% of that total [2]Source: U.S. Department of Agriculture Economic Research Service, “Renewable Diesel Production,” ers.usda.gov. Rapid demand growth lifted soybean oil prices 6.2% in a single trading session after the 2025 quota proposal, tightening the linkage between fuel policy and oilseed pricing. Refiners recently co-invest with crushers to secure feedstock and carbon-intensity data, creating integrated hubs that maximize crush margins and shorten supply chains. Food manufacturers increasingly hedge exposure through long-term supply agreements to safeguard edible-oil availability as fuel consumption accelerates.
Growth in High-Protein Animal Feed (Soybean Meal) Usage
Global protein demand keeps soybean meal at the core of poultry and swine rations. United States soybean meal exports reached 14.4 million metric tons valued at USD 6.7 billion in 2024, 10% above the prior year despite flat whole-bean shipments. Rising incomes in Southeast Asia and South America are driving per-capita meat intake, reinforcing continuous feed demand that buffers crushers from oil-price swings. Chinese pork herd recovery has stabilized soymeal import needs, while domestic feed companies increasingly specify de-hulled United States meal for its higher digestible amino-acid profile. Record Brazil supplies temper price spikes, but importers still pay quality premiums to diversify origin risk amid trade uncertainties.
Rising Demand for Plant-Based Protein and Dairy Substitutes
Consumer pursuit of healthier and lower-carbon diets elevates food-grade soybeans in beverages, meat analogs, and fermented products. Non-GM (Genetically Modified) identity-preserved beans secure USD 1 or more per bushel premiums, although acreage fell 16% to 3.5 million acres in 2024 on higher production costs. Japan, South Korea, and Singapore continue to import specialty edamame and natto beans, while United States and Canadian growers develop traceable supply programs that meet stringent labeling rules. Sustainable packaging claims and clean-label formulations drive brands to verify soy origin and cultivation practices.
Commercialization of Drought-Tolerant, High-Yield Cultivars
Seed innovation mitigates climate risk and expands planting frontiers. Bayer’s Vyconic soybeans combine five herbicide tolerances and have early-stage drought stress resilience, targeting full commercial launch for 2027 plantings. The USDA (United States Department of Agriculture) and university breeders report 15% yield gains under managed water deficit using growth-regulator treatments such as mepiquat chloride, increasing attractiveness in arid zones [3]Source: U.S. Department of Agriculture Agricultural Research Service, “Project: Development of Drought-Tolerant Soybeans,” usda.gov. African research hubs adopt these cultivars to cut import dependence and unlock dry-season production potential. Traders anticipate a productivity uplift that counterbalances acreage constraints in mature regions.
Restraints Impact Analysis*
| Restraint | (~) % Impact on CAGR Forecast | Geographic Relevance | Impact Timeline |
|---|---|---|---|
| Climate-change-driven yield variability and extreme weather | -1.5% | Global, severe in South America and North America | Long term (≥4 years) |
| Commodity-price volatility driven by speculative trading | -1.2% | Global, amplified in major trading centers | Short term (≤2 years) |
| Consumer backlash against genetically modified soybeans | -0.8% | Europe, Japan, and premium markets globally | Medium term (2-4 years) |
| Stricter marine-emission rules raising trans-ocean shipping costs | -0.6% | Global trade routes, especially trans-Pacific | Medium term (2-4 years) |
| Source: Mordor Intelligence | |||
Climate-Change-Driven Yield Variability and Extreme Weather
Unpredictable rainfall and heat waves curbed Brazil’s 2024 harvest by 6% to 153 million metric tons as Southern states battled floods during pod fill. Drought models forecast up to 40% yield loss in the American Midwest under high-temperature scenarios, prompting crop-insurance recalibration and varietal shifts. Moisture stress also lowers oil-to-protein ratios, complicating crushers’ product-mix planning. Investment in irrigation and climate-resilient genetics partially offsets risk but raises capital costs for growers and processors.
Commodity-Price Volatility Driven by Speculative Trading
Large-speculator net positions often swing soybean futures by 3–5% within days, detaching paper markets from physical demand signals. A stronger USD and record South American stocks compressed Chicago prices to USD 11.20 per bushel in 2024 compared with USD 14.20 in 2022. Heightened volatility complicates long-term contracting, discourages hedging, and exposes smaller traders to margin calls. Policymakers and producer cooperatives advocate transparency reforms to limit excessive speculation, though implementation remains uncertain.
*Our forecasts treat driver/restraint impacts as directional, not additive. The impact forecasts reflect baseline growth, mix effects, and variable interactions.
Geography Analysis
Asia-Pacific controlled 44.70% of the soybean market demand in 2025 on the strength of China’s import program that routinely exceeds 100 million metric tons. Government incentives under the Soybean Oilseed Capacity Improvement Project aim to lift domestic output, but structural land and climate constraints keep import reliance high. Japan remains the largest destination for Non-GMO (Genetically Modified Organism) food-grade soybeans, paying premiums that filter through the entire traceability chain. India’s dependence on imported soybean oil has deepened as domestic yields plateau, while Southeast Asian crushers expand meal output for regional livestock hubs.
Africa, though representing a small base, is the fastest-growing region with a 7.58% CAGR to 2031. Malawi began direct export lanes to China in 2024, and Nigeria’s Central Bank-backed anchor-borrower programs expand acreage. Opportunities stem from 445 million hectares of suitable but uncultivated land and improving port infrastructure under the African Continental Free Trade Area framework. Development agencies and private investors collaborate on integrated value chains that include local crushing to retain value and shorten feedstock logistics for domestic poultry and aquaculture sectors.
South America remains the production powerhouse. Brazil is projected to harvest 167.3 million metric tons in 2025 and account for nearly 60% of global exports. Strengthening rail links from Mato Grosso to northern ports reduces freight to Asian destinations and underpins competitive FOB (Free On Board) prices. Argentina stabilizes at roughly 49 million metric tons following tax-policy reforms that encourage meal exports over raw-bean sales. North America continues incremental gains, the United States anticipates a 4.3 billion-bushel crop in 2025 despite acreage shifts, supported by precision-ag adoption and robust domestic crush expansion.


Regulatory Landscape
Soybean trade and processing are increasingly shaped by sustainability and import-control regimes in the EU, China, and key producing states. In July 2026, the European Commission updated the product scope and support tools for the EU Deforestation Regulation (EUDR), including removing soybeans for sowing from scope and confirming application from December 30, 2026 for large and medium operators. This extends the practical need for geolocation-linked traceability for soy and soy-derived products entering the EU market.
China continues to be a key rule-setter for exporters via import licensing and facility registration. In June 2026, China implemented GACC Decree 280, replacing Decree 248 with a new overseas food-producer registration approach based on a dynamic, risk-based catalog. Enforcement actions have also created near-term disruption risk, including the March 2025 GACC suspension of soybean shipments from CHS Inc., Louis Dreyfus Grains Merchandising LLC, and EGT LLC for phytosanitary findings. In Brazil, political and legal friction around the 2006 Soy Moratorium continued, with Mato Grosso reinstating Lei 12.709/24 in January 2026, which affected access to certain tax incentives and public land concessions for signatories.
Value Chain Analysis
The soybean value chain runs from input supply (seed traits, crop protection, fertilizers, and farm services) to primary production concentrated in Brazil, the United States, and Argentina, which together form most of global output. After origination and storage, the crop routes into two main processing streams, crushing into soybean meal for animal feed and soybean oil for food and energy uses, alongside specialty streams such as identity-preserved, non-GM food-grade soy and soy ingredients (protein concentrates and lecithin). Global merchandising and processing are led by integrated players including Cargill, Bunge, ADM, Louis Dreyfus Company, and COFCO International, with flows influenced by China as the dominant importer and by the availability of efficient export corridors.
Logistics and compliance act as major cost and risk centers, particularly in Brazil where inland road links and river-port nodes (for example, Amazon corridor river transshipment hubs and southern export terminals such as Paranagua) can amplify exposure from infrastructure constraints and local actions. Downstream, the chain is tightening around verifiable sustainability and traceability standards to maintain market access and secure offtake into energy and food applications. COFCO International and Thanakorn Vegetable Oil Products, for instance, are working to expand certified, traceable soy trade under the COFCO International Responsible Agriculture Standard, while ADM and partners are scaling regenerative and sustainable farming programs with farmer-level data capture in India.
Market Opportunities and Future Outlook
Processing capacity additions and integration with energy and ingredients demand are creating room for growth across crushing, refining, and specialty soy derivatives. Investment announcements and completions in 2026 offer clear signals: COFCO International announced a USD 400 million expansion at Rondonopolis, Brazil to reach 10,000 tonnes per day, and Incobrasa Industries opened a USD 250 million expansion in Gilman, Illinois that doubled annual processing capacity to 100 million bushels. These moves connect with higher utilization of soybean oil and meal across fuel and feed channels, reinforced by the operational data point that U.S. processors crushed 218.5 million bushels in April 2026, 16 million above April 2025.
Export and handling infrastructure upgrades also support opportunity by lowering delivered costs and improving reliability for meal and whole-bean shipments, especially where domestic crush is expanding. The DeLong Company completed Phase II of the Agriculture Maritime Export Facility expansion at Port Milwaukee in April 2026, strengthening a Great Lakes outlet for U.S. soybeans and soybean meal. On-farm, programs and technologies that generate auditable sustainability and productivity gains are becoming more commercial, including ADM and TechnoServe targeting regenerative agriculture practices across 15,000 soybean farmers in Maharashtra, along with broader adoption of digital and precision agriculture tools that support input optimization and compliance-linked traceability for premium and regulated markets.
Recent Industry Developments
- July 2026: Bunge signed a five-year contract to supply certified soybean oil to Acelen Renovaveis for its Bahia biorefinery program focused on renewable fuels. The agreement formalizes long-term, certification-linked offtake that ties soybean oil demand to energy-sector requirements and traceability expectations.
- September 2025: Confluence Genetics partnered with Ag Partners Cooperative to expand commercial acres of ProVIA soybean varieties through an identity-preserved program for the 2026 growing season across Missouri, Kansas, and Iowa. The collaboration supports differentiated soybean streams tied to end-use performance outcomes, reinforcing premiums for controlled production and segregation.
- July 2024: Louis Dreyfus Company broke ground on an Ohio soybean processing plant designed to crush 175,000 bushels per day and refine 320,000 metric tons of oil annually. The project adds U.S. Midwest crushing and refining capacity, improving optionality between meal export channels and domestic soybean oil demand.


Research Methodology Framework and Report Scope
Market Definition and Coverage
For this methodology, the soybean market is defined as the traded and consumed value of soybean beans (including broken soybeans) across major producing and importing countries, converted into USD using observed price signals and trade values.
Scope exclusions: This sizing does not count downstream derivative markets like soybean oil or soybean meal as separate revenue pools, since they are treated as conversion uses of the same bean volume.
Segmentation Overview
- By Geography
- North America
- United States
- Canada
- Mexico
- Europe
- Russia
- Italy
- Ukraine
- Spain
- Asia-Pacific
- China
- India
- Japan
- Australia
- South America
- Brazil
- Argentina
- Paraguay
- Middle East
- Saudi Arabia
- United Arab Emirates
- Africa
- South Africa
- Egypt
- North America
Data Sources, Market Sizing, and Validation
Desk Research
Desk research was used to build the supply and trade backbone of the model, especially where soybean volumes are visible through official reporting. We referenced public sources such as FAOSTAT for crop production and yield trends, USDA PSD and WASDE style balance sheets for supply and demand direction, UN Comtrade for HS 1201 import and export values and volumes, and national agriculture ministries for acreage and harvest updates.
To convert the physical market into a consistent value series, we also reviewed exchange- and customs-linked price references, port and basis commentary available through reputable press, and listed company filings and investor decks for processing and origination context. A paid subscription covering company financials and news helped us standardize revenue context and event timelines, while a patent database was used selectively to sanity check technology direction, such as trait development. These desk sources are not exhaustive, and many additional public documents were used for data collection, validation, and clarification.
Primary Interviews and Surveys
Primary work focused on validating what the desk numbers could not explain cleanly, like how pricing is set in contracts, how quality and logistics constraints change realized values, and how trade policy shifts are handled in procurement. We spoke with participants across farming advisory, trading, crushing, feed procurement, and food ingredient buying, and then cross-checked points across APAC, EMEA, and the Americas so no single region dominated the final assumptions.
Distribution of primary research fieldwork respondents
| Company type | Respondent position | Region |
|---|---|---|
| Top tier: 31% | CXOs: 13% | APAC: 44% |
| Mid tier: 49% | Functional/Unit leaders: 39% | EMEA: 37% |
| Smaller Players: 20% | Managers: 48% | Americas: 19% |
Market-Sizing & Forecasting
The sizing model starts with a top-down reconstruction of the soybean demand pool using crop output, ending stocks movement, and HS 1201 trade flows, and then converts that into market value using region-linked price benchmarks and realized trade unit values. To keep the total aligned with reality, we corroborated the result with selective bottom-up approximations, such as sampled exporter and processor revenue signals, channel checks on typical spreads, and volume multiplied by observed average selling price ranges.
Key inputs used in the model include planted area and yield trends, crush demand direction from feed and aquaculture, exportable surplus by origin, import dependency in major consuming countries, and the price relationship between farmgate indications and FOB and CIF trade values. When a country has gaps in public reporting, estimates were bridged using nearby peer-country ratios, recent trade behavior, and interview-based checks on typical sourcing patterns.
For forecasting, scenario analysis was used so the outlook can flex with weather-driven supply swings, policy changes that affect trade, and expected feed demand growth. Assumptions were anchored to a short list of variables that interviewees could validate, and the model was run consistently year by year so the CAGR is an output rather than an input.
Data Validation & Update Cycle
Validation is done through several checks so the outputs stay consistent with real-world signals. Model totals are compared against independent markers like global production totals, net trade balance by region, and implied unit values, and any sharp year-on-year jumps are reviewed before sign-off.
If variances are driven by a specific event, such as a tariff change, a logistics disruption, or a major harvest shift, we re-check assumptions and, when needed, re-contact relevant respondents to confirm what changed. Reports are refreshed annually, with interim updates for material events, and a final pre-delivery pass is completed so clients receive the latest updated view.
Mordor Intelligence's Soybean Market Estimate Compared With Other Published Estimates
Published soybean market values often differ because the boundary of what is counted is not always the same, and because pricing and currency timing choices can shift the final USD number. Differences also show up when one estimate relies more on projected demand growth, while another sticks closer to observed trade values in the base year.
By tracking HS 1201 trade unit values, production balances, and regional price signals, Mordor Intelligence keeps the soybean market total tied to bean-level value rather than mixing in downstream derivative revenue or double-counting processing stages.
Benchmark comparison
| Source | Market Size | Gaps in Research Methodology |
|---|---|---|
| Mordor Intelligence | USD 169.90 B (2026) | |
| Global Consultancy A | USD 225.98 B (2025) | Uses a different base year and appears to include broader end-use layers and nature-based segmentation, which can expand the counted value beyond bean-level trade and farmgate pricing. |
| Industry Publisher B | USD 164.06 B (2025) | Starts from a 2025 base and applies a broader application and form framework, where price progression and currency timing choices can pull the USD total lower or higher versus a trade-value anchored approach. |
The spread in the table is mainly explained by year selection and what is treated as in-scope value at the bean level versus added downstream value. With clear links to volumes, trade values, and price assumptions that can be checked and repeated, the approach is meant to be easy to audit and steady to update when market conditions change.


Key Questions Answered in the Report
What is the projected value of the soybean market in 2031?
The soybean market is forecast to reach USD 229.4 billion by 2031.
Why is soybean oil gaining strategic importance?
Stronger biofuel mandates have transformed soybean oil into a preferred renewable-diesel feedstock.
Which region shows the highest growth potential for soybean market?
Africa posts the fastest 7.58% CAGR through 2031, supported by large tracts of unused arable land and growing export ties to Asia.
Which region command the highest share in the soybean market?
Asia-Pacific commanded the highest, 44.70% share of the soybean market in 2025.
Page last updated on:


