
Soy-based Food Market Size and Share
Market Overview
| Study Period | 2021 - 2031 |
|---|---|
| Market Size (2026) | USD 32.07 Billion |
| Market Size (2031) | USD 43.66 Billion |
| Growth Rate (2026 - 2031) | 6.36 % |
| Fastest Growing Market | Europe |
| Largest Market | Asia-Pacific |
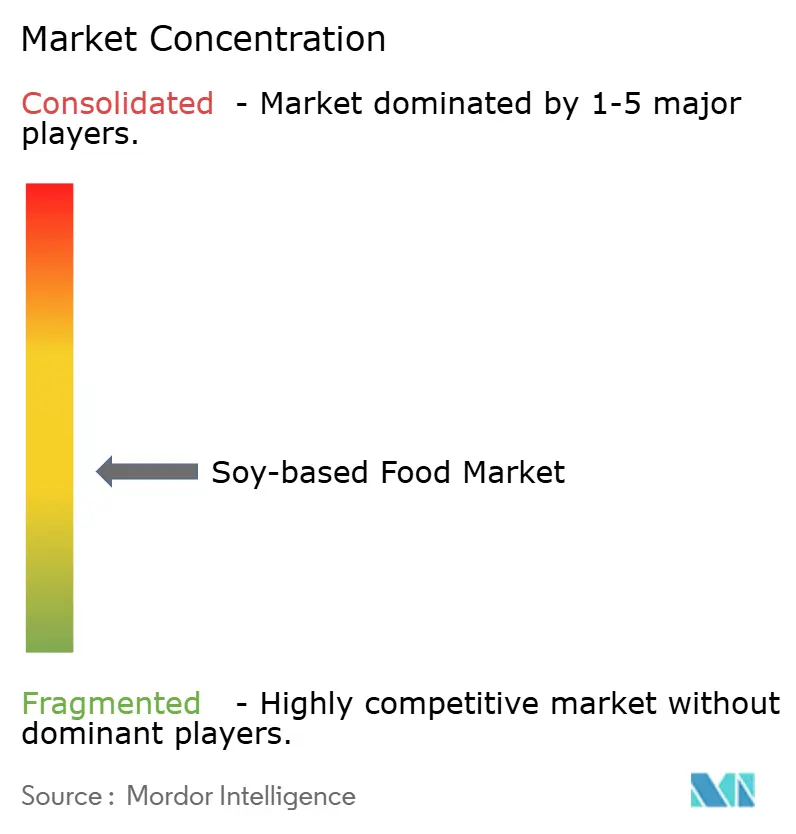
| Market Concentration | Medium |
Major Players *Disclaimer: Major Players sorted in no particular order Image © Mordor Intelligence. Reuse requires attribution under CC BY 4.0. | |
Soy-based Food Market Analysis by Mordor Intelligence
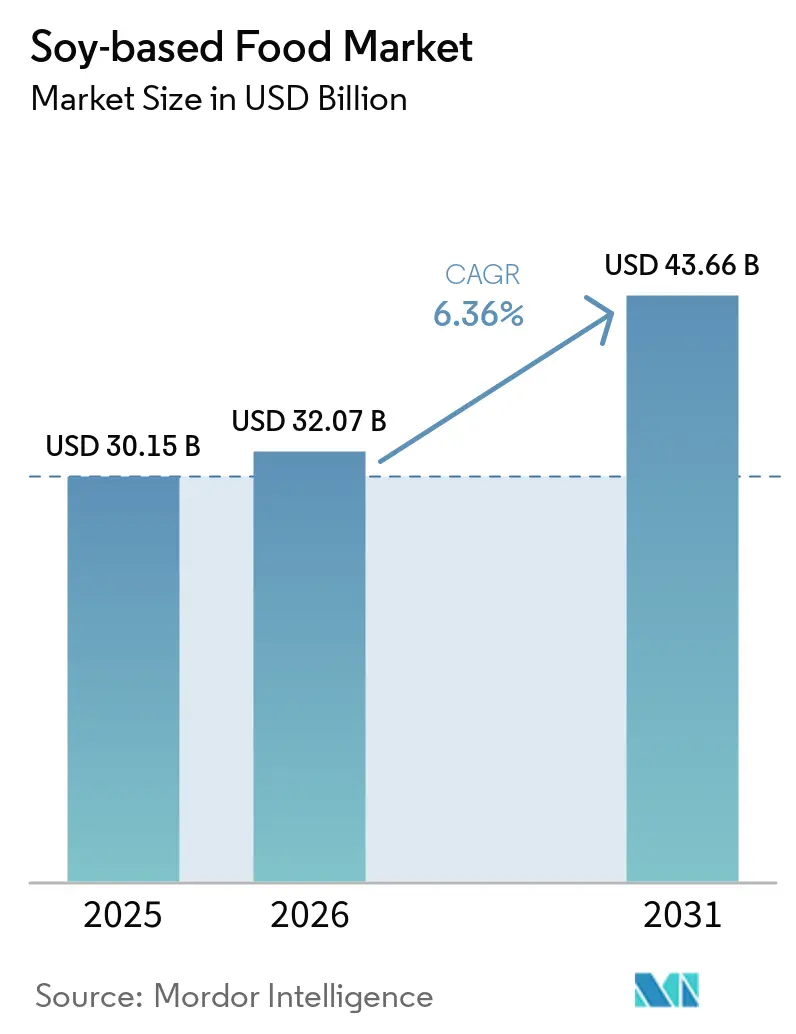
The soy-based food market size is expected to grow from USD 30.15 billion in 2025 to USD 32.07 billion in 2026 and is forecast to reach USD 43.66 billion by 2031 at 6.36% CAGR over 2026-2031. This growth is being driven by a shift toward plant-based proteins, the widespread prevalence of lactose intolerance globally, and advancements that improve flavor and texture. The increasing popularity of flexitarian diets, regulatory efforts to reduce carbon emissions in Europe, and cost benefits compared to newer pulse proteins are further supporting market expansion. However, challenges such as supply chain volatility and regulations surrounding genetically modified organisms (GMO) remain. Investments in non-GMO and organic supply chains are helping to address these issues. The competitive environment is moderately intense, with major ingredient companies expanding into downstream operations and startups utilizing direct-to-consumer channels to maintain pricing power in premium segments of the soy-based food market.
Key Report Takeaways
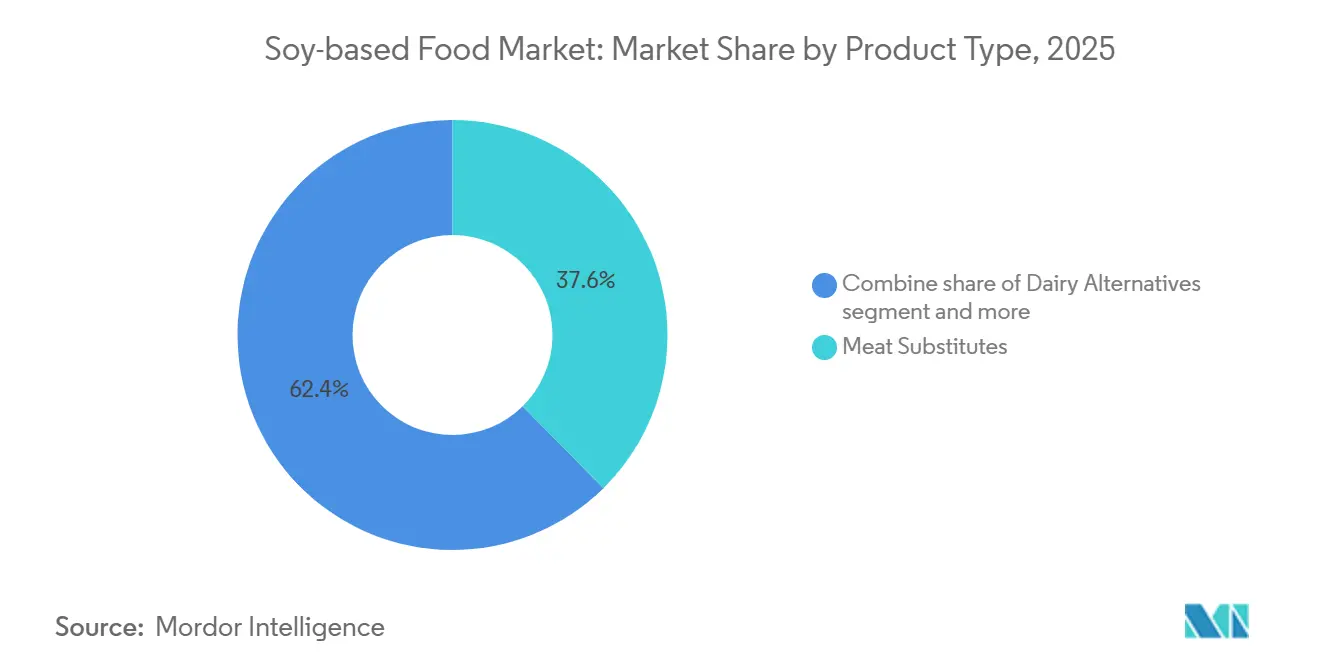
- By product type, meat substitutes accounted for 37.62% of the soy-based food market share in 2025, and dairy alternatives are expected to grow at a CAGR of 6.73% through 2031, making them the fastest-growing product sub-segment.
- By category, conventional products held 76.45% of the soy-based food market share in 2025, reflecting price sensitivity in emerging economies. Organic variants, however, are pacing ahead with a 6.86% CAGR through 2031 as certified supply chains mature.
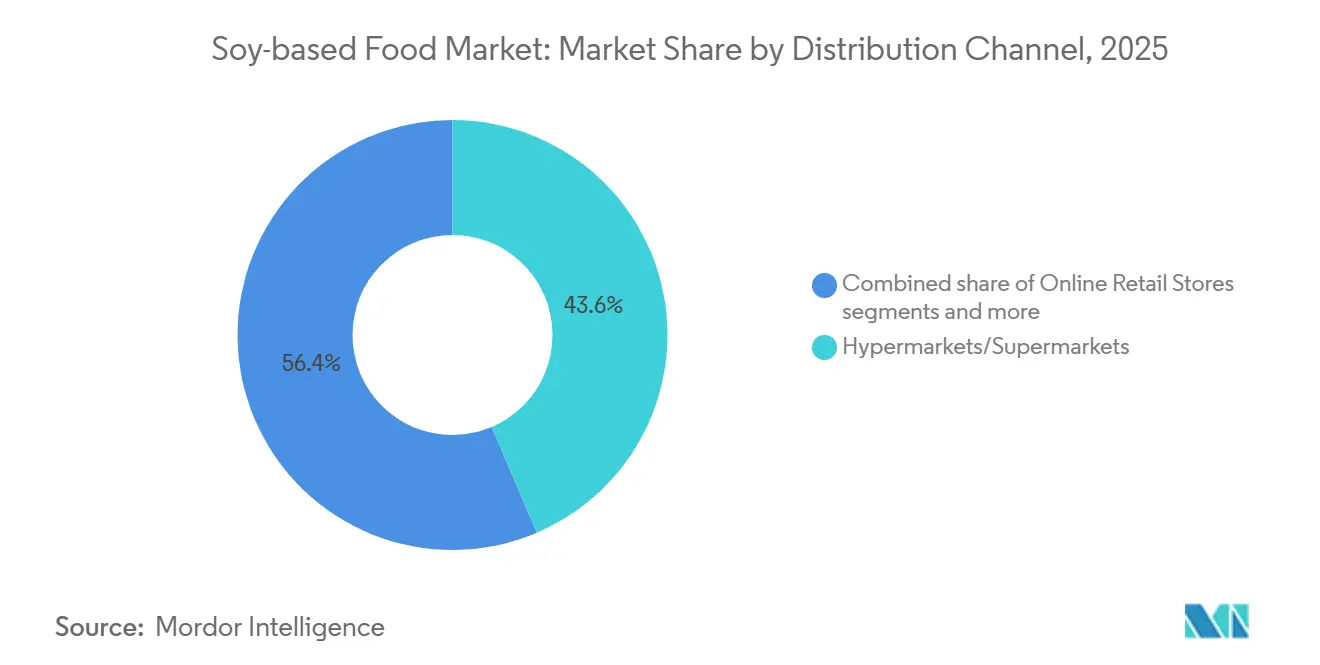
- By distribution channel, hypermarkets and supermarkets accounted for 43.58% of the soy-based food market size in 2025. Online retail is expected to deliver the fastest growth at a 6.66% CAGR through 2031, as direct-to-consumer models scale.
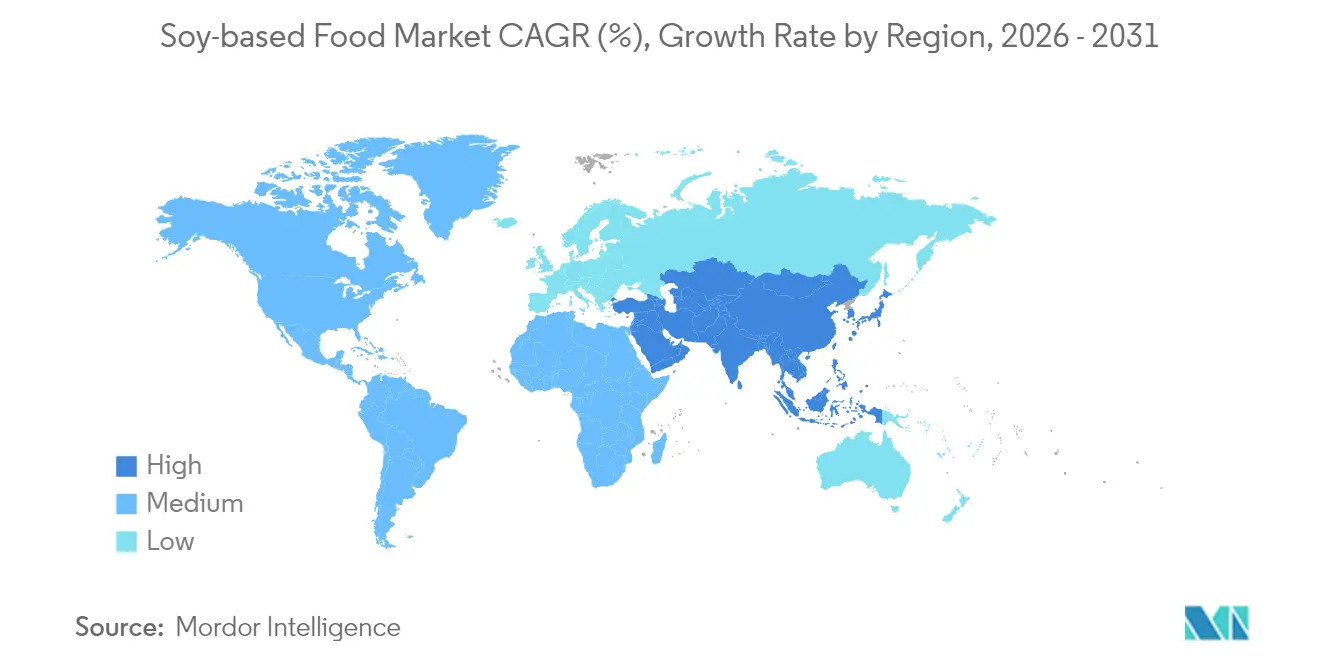
- By geography, Asia-Pacific captured 33.05% of revenue in 2025, while Europe is advancing at a 6.74% CAGR between 2026 and 2031.
Note: Market size and forecast figures in this report are generated using Mordor Intelligence’s proprietary estimation framework, updated with the latest available data and insights as of 2026.
Market Trends and Insights
Drivers Impact Analysis of Soy-based Food Market*
| Driver | (~)% Impact on CAGR Forecast | Geographic Relevance | Impact Timeline |
|---|---|---|---|
| Rising adoption of vegan, vegetarian, and flexitarian diets | +1.2% | Global, with concentration in North America and Europe | Medium term (2-4 years) |
| Growing prevalence of lactose intolerance and dairy allergies | +1.5% | Asia-Pacific core, spill-over to MEA and Latin America | Long term (≥ 4 years) |
| Increasing demand for functional and fortified foods | +0.9% | North America, Europe, urban Asia-Pacific | Medium term (2-4 years) |
| Growth of specialty and free-from categories | +0.7% | North America and Europe | Short term (≤ 2 years) |
| Advances in food processing that reduce beany flavors and enhance mouthfeel | +1.3% | Global | Short term (≤ 2 years) |
| Marketing campaigns from NGOs and health bodies promoting plant-forward diets | +0.6% | Global, strongest in Europe and North America | Long term (≥ 4 years) |
| Source: Mordor Intelligence | |||
Rising Adoption of Vegan, Vegetarian, and Flexitarian Diets
Flexitarian positioning, which refers to consumers reducing but not completely eliminating animal products, is a significant driver of global plant-based purchase intent. However, there remains a considerable gap between consumer intent and actual behavior, as a smaller proportion of households incorporate plant-based meals into their weekly routines. To address this gap, ingredient suppliers are leveraging advancements such as taste-masking technologies and hybrid formulations that combine soy with proteins derived from peas or chickpeas. The primary obstacle for consumers continues to be price, followed by concerns about taste and the challenge of breaking established dietary habits. This underscores the importance of achieving both cost parity and sensory equivalence to encourage broader adoption [1]. Soy-based formats hold a competitive edge due to their well-established supply chains and lower landed costs compared to newer pulse-based alternatives, offering a notable price advantage in value-focused segments that dominate emerging markets. While regulatory influence in this area remains limited, as dietary choices are largely driven by consumer preferences rather than government mandates, voluntary front-of-pack labeling initiatives in countries such as France and Chile are helping to guide shoppers toward plant-forward options.
Growing Prevalence of Lactose Intolerance and Dairy Allergies
Lactose malabsorption impacts a significant portion of the global adult population, with particularly high prevalence in regions such as East Asia, Sub-Saharan Africa, and Latin America. This condition creates a substantial market of individuals who experience gastrointestinal discomfort when consuming dairy products. The challenge is further intensified by the growing number of children diagnosed with dairy allergies, which has been steadily increasing in regions like the United States and the European Union. In response, healthcare professionals, including pediatricians, are recommending soy-based infant formulas and toddler beverages as the preferred alternatives to dairy-based options[2]. Soy protein isolates, which provide a high protein content along with a complete amino acid profile, are recognized as nutritionally equivalent to whey and casein proteins while avoiding the allergenic components found in cow's milk. Regulatory frameworks, such as the United States Food and Drug Administration's Generally Recognized as Safe designation for soy protein and the European Food Safety Authority's approvals for health claims related to soy and cholesterol reduction, offer structured compliance pathways. These regulations play a critical role in expediting product introductions to the market and fostering consumer trust in soy-based alternatives.
Increasing Demand for Functional and Fortified Foods
Functional fortification is reshaping commodity soy beverages into wellness-oriented products. For example, Yeo's introduced an immunity-focused soy milk in Singapore in the year 2024, enriched with zinc, selenium, and vitamin C. This product quickly gained a significant share of the market within a short period by positioning itself as a daily immune-support beverage rather than merely a dairy substitute. Similarly, Nestlé's Milk Plus Soy in the Philippines addresses micronutrient deficiencies among lower-income groups by incorporating iron, folic acid, and vitamin B12. This product has achieved widespread availability in thousands of sari-sari stores and has successfully fostered strong consumer loyalty with high repeat purchase rates. In North American and European markets, omega-3 fortification using microencapsulated algal oil is becoming increasingly popular, as a substantial proportion of consumers prefer plant-based sources of EPA and DHA over fish-derived supplements. Furthermore, protein content claims—ranging from seven to ten grams per 240-milliliter serving—are resonating with fitness-focused consumers. This trend is driving premiumization, allowing brands to charge significantly higher prices compared to conventional soy milk.
Growth of Specialty and Free-From Categories
The free-from category, which includes gluten-free, allergen-free, and non-GMO certifications, witnessed significant growth in North America and Europe during 2024. This growth rate was notably higher than that of conventional packaged foods, driven by consumer perceptions that clean-label products are safer and offer greater transparency. Within the allergen-free dairy segment, soy-based products hold a dominant position, capturing a substantial share of the market. Alternatives such as oat and almond-based products account for the remaining share. However, soy stands out due to its higher protein density and considerably lower water footprint, as it requires significantly less irrigation compared to almonds. This makes soy a preferred choice among environmentally conscious consumers. In the same year, a notable proportion of the United States. soy-based brands achieved Non-GMO Project verification, addressing consumer concerns regarding genetic modification. This certification enables brands to charge a premium on shelf prices, although it restricts sourcing to identity-preserved supply chains, which represent a limited portion of North American soybean acreage.
Restraints Impact Analysis of Soy-based Food Market*
| Restraint | (~)% Impact on CAGR Forecast | Geographic Relevance | Impact Timeline |
|---|---|---|---|
| Regulatory restrictions and bans on GM soy cultivation or imports in certain countries | -0.8% | Europe, parts of Asia (Japan, South Korea) | Long term (≥ 4 years) |
| Volatility in soybean supply availability | -0.6% | Global, acute in South America | Short term (≤ 2 years) |
| Consumer preference shifting toward soy-free claims in some regions due to allergy | -0.4% | North America, Europe | Medium term (2-4 years) |
| Retail shelf-space competition within plant-based sets | -0.3% | Global, most intense in North America and Europe | Short term (≤ 2 years) |
| Source: Mordor Intelligence | |||
Regulatory Restrictions and Bans on GM Soy Cultivation or Imports in Certain Countries
The European Union's precautionary approach to genetically modified organisms requires a significantly longer approval process for new genetically modified soy events compared to the United States. This extended timeline delays the introduction of herbicide-tolerant and insect-resistant varieties, which are designed to lower input costs for producers [3]. Meanwhile, countries like Japan and South Korea enforce strict segregation and labeling requirements for genetically modified soy, which adds substantial traceability costs and puts pressure on processor margins. These costs are particularly challenging in markets where consumer price sensitivity limits the ability to pass on additional expenses. Furthermore, the Appraisal Committee has not approved any genetically modified soy variety for over two decades, restricting yield improvements to conventional breeding methods. These methods achieve lower annual productivity gains compared to genetically modified counterparts, which has led to a reliance on imports to meet domestic demand. Overall, these regulatory differences increase compliance costs, disrupt supply chain efficiency, and slow the adoption of innovations, especially those aimed at improving protein content or reducing anti-nutritional factors.
Volatility in Soybean Supply Availability
Soybean spot prices fluctuated between USD 12.50 and USD 15.20 per bushel during 2024, influenced by a La Niña-induced drought in Brazil's Mato Grosso and Rio Grande do Sul states. This drought reduced the 2024 harvest by 8 percent to 147 million metric tons, tightening global exportable supplies and increasing crush margins for processors. Argentina's export infrastructure, primarily located in the Rosario port complex, faced 22-day delays in the first quarter of 2024 due to low water levels in the Paraná River. These delays raised freight costs by USD 18 to USD 25 per metric ton, compressing margins for European and Asian importers. The United States Department of Agriculture projects global soybean ending stocks at 118 million metric tons for the 2024-2025 marketing year, resulting in a stocks-to-use ratio of 29 percent. This figure is below the 32 percent threshold historically associated with price stability, indicating continued volatility through 2026.
*Our forecasts treat driver/restraint impacts as directional, not additive. The impact forecasts reflect baseline growth, mix effects, and variable interactions.
Soy-based Food Market Segment Analysis
By Product Type:
Fermentation Unlocks Dairy ParityThe dairy alternatives market is anticipated to grow at a steady rate of 6.73% through 2031, outpacing the growth of meat substitutes, which are forecasted to hold a significant 37.62% market share in 2025. Innovations such as precision fermentation and microbial transglutaminase have revolutionized the production of soy-based cheese, enabling it to closely mimic the melting, stretching, and browning characteristics of mozzarella. These advancements have been validated through blind consumer panels, highlighting their effectiveness. Additionally, textured vegetable protein, the largest segment of meat substitutes, has benefited from twin-screw extrusion technology. This process aligns fibers anisotropically, achieving a bite resistance of 25 to 30 Newtons, which is comparable to that of chicken breast. This technological improvement has expanded its applications to include nuggets, patties, and ground formats, which collectively account for 60% to 65% of the plant-based meat category.
Tofu, a traditional staple in Asia-Pacific markets, is undergoing a transformation through premiumization efforts. These include obtaining organic certifications and introducing a variety of flavored options, such as smoked, herb-infused, and marinated. These new offerings are specifically designed to appeal to Western consumers who may be less familiar with traditional tofu preparation methods. As a result, tofu has experienced robust growth, achieving an annual increase of 18% to 22% in United States natural food channels. This growth reflects the increasing demand for innovative and high-quality plant-based protein options in the market.

By Category:
Organic Premiumization Gains MomentumOrganic soy products are expected to grow at a steady rate of 6.86% through 2031, gradually closing the gap with conventional soy products, which held a significant 76.45% market share in 2025. Achieving compliance with the United States Department of Agriculture (USDA) National Organic Program certification and the European Union (EU) Regulation 2018/848 has become a fundamental requirement for securing premium retail placement. These certifications ensure that organic soy products meet stringent quality and sustainability standards, which are increasingly valued by consumers and retailers alike. Identity-preserved supply chains, designed to segregate organic soybeans from the field to the processor, add an additional cost of USD 80-120 per metric ton for traceability and certification. However, these systems enable brands to command price premiums of 25% to 35%, which more than offset the incremental costs, making them a viable strategy for businesses aiming to differentiate their products in the market.
In the United States, organic soybean acreage expanded by 9% in 2024, reaching a total of 1.8 million acres. Despite this growth, the expansion of organic supply remains constrained by the mandatory three-year transition period required for organic certification. During this period, farmers are required to use organic inputs but are unable to sell their produce at organic price premiums, creating a financial burden that can deter many from transitioning. This capital-intensive process poses a significant barrier to supply growth, as farmers must absorb higher input costs without immediate financial returns. Addressing these challenges will be critical to ensuring a sustainable increase in organic soybean production to meet the growing demand.
By Distribution Channel:
Direct-to-Consumer Bypasses GatekeepersOnline retail channels are expected to grow at 6.66% through 2031, gradually reducing the 43.58% market share currently held by hypermarkets and supermarkets in 2025. This trend is largely attributed to the rise of direct-to-consumer models, which empower niche brands to bypass significant slotting fees, ranging from USD 50,000 to USD 150,000 per stock-keeping unit (SKU), and avoid the influence of category-captain dynamics that often favor well-established players. Convenience stores, which contribute to 18% to 20% of product distribution, primarily serve impulse purchases and cater to urban commuters. However, their limited shelf space, typically 4 to 6 linear feet allocated for plant-based product categories, restricts their ability to offer a diverse assortment, often excluding emerging brands and specialty product formats.
Hypermarkets and supermarkets continue to dominate in emerging markets where e-commerce infrastructure is still developing. In these regions, consumers often prefer to physically evaluate products before making a purchase, such as checking expiration dates and ensuring packaging integrity. These purchasing behaviors are particularly significant, accounting for 70% to 75% of soy-based food transactions in countries like India, Brazil, and South Africa.
Geography Analysis
APAC Soy-based Food Market
Asia-Pacific, which held 33.05% of the market value in 2025, is another significant region in the plant-based market. The region's growth is anchored by traditional soy consumption in countries such as China, Japan, and South Korea, where products like tofu, soy milk, and fermented soy have been dietary staples for centuries. This cultural familiarity reduces barriers to trial and adoption. In China, the plant-based market expanded by 18% in 2024, driven by urbanization, with 60% of the population now residing in cities, and rising disposable incomes that have enabled a shift toward premium organic and fortified product variants.
Europe Soy-based Food Market
Europe is the fastest-growing segment, with a projected growth rate of 6.74% through 2031. This rapid expansion is largely attributed to the European Commission's Farm to Fork strategy, which aims to reduce agricultural greenhouse gas emissions by 50% by 2030. The strategy also includes a significant investment of EUR 10 billion in protein diversification research and farmer incentives. Germany and the Netherlands are at the forefront of this growth, with plant-based products expected to account for 14% to 16% of total protein sales in 2024. Retail mandates dedicating 12 to 15 linear feet of shelf space to plant-based products and public procurement policies requiring 30% plant-based meals in schools and hospitals further support this growth.
North America Soy-based Food Market
North America, which includes the United States, Canada, and Mexico, remains a leading segment in the global plant-based market, contributing 28% to 30% of global revenue in 2025. However, growth in this region has slowed to 5% to 6% as the market matures and faces increasing competition from alternative protein sources such as pea, chickpea, and oat. In the United States alone, 480 plant-based food products were launched in 2024, but 35% of these were discontinued within a year due to insufficient sales momentum. This highlights the ongoing challenge of converting consumer trials into consistent, habitual consumption patterns.
Regulatory Landscape
Soy-based foods are subject to allergen and labeling frameworks in major consuming markets, which affects both formulation and how products can be marketed. In the United States, soy is designated as a major food allergen under the Federal Food, Drug, and Cosmetic Act and the Food Allergen Labeling and Consumer Protection Act (FALCPA), requiring clear declarations on packaged foods, including dairy-alternative, ready-to-drink, and ingredient-led soy formats.
In Europe, GMO approval and traceability remain a central compliance pathway for soy supply chains under Regulation (EC) No 1829/2003, with mandatory European Food Safety Authority (EFSA) safety assessment preceding European Commission authorization. During 2026, the European Commission authorized additional GMO soybean events for food and feed use via implementing decisions (including DBN-09004-6 and MON 94637), while also introducing trade protection via a provisional anti-dumping duty on pea protein imports from China (Implementing Regulation (EU) 2026/916). The Commission also published a Protein Action Plan in 2026 (COM(2026) 355 final), which reinforces policy attention on protein-crop cultivation and import diversification and feeds into sourcing strategies and certification demand across soy-based food value chains.
Competitive Landscape
The soy-based food market demonstrates moderate fragmentation, with a concentration score of 4 out of 10. Large multinational ingredient suppliers, including Archer Daniels Midland (ADM), Cargill, Bunge, and Wilmar International, dominate the upstream processes of soy processing and protein isolation. On the other hand, downstream consumer brands such as Danone, Nestlé, Unilever, and Conagra focus on competing through product formulation, branding, and distribution strategies. Additionally, innovative entrants like Impossible Foods, Beyond Meat, and Good Catch Foods are leveraging advanced technologies such as precision fermentation and extrusion to develop unique textures and flavors. These innovations enable them to position their products at a premium level in the market.
ADM has established a significant competitive advantage through its extensive patent portfolio, which includes 47 filings related to soy protein texturization and flavor masking. These patents provide ADM with process efficiencies that reduce production costs by 8 to 12 percent compared to competitors without integrated operations. Vertical integration strategies are becoming increasingly important in the market. For example, Danone acquired WhiteWave Foods for USD 12.5 billion in 2017, gaining ownership of the Silk and Alpro brands. Together, these brands hold a combined market share of 22 to 25 percent in the soy milk categories across North America and Europe. This acquisition allows Danone to capture margins across the entire value chain, from sourcing soybeans to distributing products at retail outlets.
There are still opportunities for growth in hybrid product formats, such as combining soy with pea or chickpea protein to improve amino acid profiles and address allergen concerns. Additionally, functional applications like sports nutrition, medical nutrition, and infant formula present significant potential. However, these segments are characterized by high regulatory barriers and the need for clinical validation, which creates challenges for new entrants. Established players with research and development budgets exceeding USD 50 million annually are better positioned to navigate these complexities. Emerging companies are also exploring direct-to-consumer e-commerce channels to bypass traditional retail barriers. For instance, startups such as Plantible Foods and Meati Foods raised USD 30 million and USD 50 million, respectively, in 2024.
Soy-based Food Industry Leaders
-
Danone S.A.
-
Vitasoy International Holdings
-
Nestlé S.A.
-
Unilever PLC
-
Conagra Brands Inc.
- *Disclaimer: Major Players sorted in no particular order
Soy-based Food Market Companies Covered in this Report
- Danone S.A.
- Vitasoy International Holdings
- Nestlé S.A.
- Unilever PLC
- Conagra Brands Inc.
- Hain Celestial Group
- Monde Nissin Corporation
- Archer Daniels Midland Co.
- Wilmar International Ltd.
- Bunge Ltd.
- Cargill Inc.
- Impossible Foods Inc.
- Beyond Meat Inc.
- Fuji Oil Holdings
- CHS Inc.
- Sonic Biochem Pvt Ltd
- Sudzucker (Beneo)
- ADM
- Amy’s Kitchen
- Good Catch Foods
Market Opportunities and Future Outlook
Investments in processing and downstream capacity are widening the addressable space for soy-based meat substitutes and dairy alternatives by expanding availability of food-grade soy protein concentrates and textured formats. In May 2026, Bunge opened a USD 550 million soy protein concentrate and textured soy protein concentrate facility in Morristown, Indiana, with planned processing of about 4.5 million bushels of soybeans annually. This supports more consistent supply for manufacturers producing structured applications such as nuggets and patties.
On the branded and prepared-food side, tofu capacity additions are also aimed at broader distribution and faster response to retailer and foodservice demand. In March 2026, Nasoya announced an expansion of its Ayer, Massachusetts tofu facility, adding 65,000 square feet to reach nearly 200,000 square feet total and lifting daily capacity to 400,000 pounds of tofu. In Europe, added regional supply is creating additional capacity for textured soy proteins used in private label and B2B formulations, including Bankom's Serbia expansion in July 2026, which added a textured soy protein plant (20,000 tonnes per year) alongside upgraded crushing capacity (140,000 tonnes per year), helping reduce lead times and support more localized sourcing.
Recent Industry Developments in Soy-based Food Market
- July 2026: Danone launched Silk Protein Yogurt and Silk Protein Shakes in the United States, extending Silk into higher-protein formats that use soy-derived complete protein. The company is targeting consumers looking for satiety and functional nutrition within plant-based dairy alternatives, increasing competitive pressure on incumbent soy beverage and cultured-alternative brands.
- October 2025: Blue Tribe launched Korean Soya Chaap and a Spicy Kebab line in India, positioning the products as high-protein, clean-label offerings aimed at younger consumers and convenience-led households. Distribution across premium stores and quick-commerce platforms expands soy-based meat substitute availability beyond niche channels and supports faster trial through on-demand delivery.
- October 2024: Cargill deepened its partnership with ENOUGH by investing in its Series C round and signing a commercial agreement tied to ENOUGH's ABUNDA mycoprotein. The collaboration expands Cargill's alternative-protein formulation toolkit and increases competitive intensity for soy-based ingredients in blended and multi-protein product development.
Soy-based Food Market Report Scope and Research Methodology
Market Definition and Coverage
This market covers packaged foods and beverages where soy is the primary base ingredient and the item is sold for human consumption through retail and foodservice channels, and then sized in value terms at the point of sale.
Scope exclusions: We exclude soy used mainly as an ingredient for animal feed, industrial uses, and pharmaceuticals, and we also do not count raw soybean trading as a finished food market.
Segments Covered in This Report
- By Product Type
- Meat Substitutes
- Textured Vegetable Protein
- Tofu
- Tempeh
- Dairy Alternatives
- Ice Cream
- Cheese
- Yogurt
- Spread
- Others
- Meat Substitutes
- By Category
- Conventional
- Organic
- By Distribution Channel
- Hypermarkets/Supermarkets
- Convenience Stores
- Online Retail Stores
- Other Distribution Channel
- By Geography
- North America
- United States
- Canada
- Mexico
- Rest of North America
- Europe
- Germany
- United Kingdom
- Italy
- France
- Spain
- Netherlands
- Poland
- Rest of Europe
- Asia-Pacific
- China
- India
- Japan
- Australia
- Rest of Asia-Pacific
- South America
- Brazil
- Argentina
- Colombia
- Rest of South America
- Middle East and Africa
- South Africa
- Saudi Arabia
- United Arab Emirates
- Rest of Middle East and Africa
- North America
Data Sources, Market Sizing, and Validation
Desk Research
Desk research helped us set clear product boundaries and build the first demand map by region and channel. We reviewed public sources such as FAOSTAT for soy supply signals, USDA oilseeds and food consumption updates, UN Comtrade trade flows for soy derived food categories, and Codex Alimentarius plus national food labeling rules that influence what can be sold as soy-based. Where it links to dietary shifts and intolerance trends, we also checked guidance from the World Health Organization and similar public health bodies.
To convert those signals into market inputs, we also used sources such as company annual reports, investor presentations, and earnings transcripts to understand category mix and pricing direction. We then followed reputable press and association websites to track launches and distribution moves. In a few cases, paid access to company financials and to patent and innovation tracking tools was used to cross-check timelines for product improvement and capacity additions. The sources listed here are illustrative only, and additional public references were used to collect data, check ranges, and clarify unclear points.
Primary Interviews and Surveys
Primary work focused on validating what counts as soy-based foods in real sales reporting, and then testing price and volume assumptions by product group and route to market. We spoke with a mix of manufacturers, ingredient suppliers, distributors, and retail or foodservice facing managers across major consuming regions, which helped close gaps that desk research typically cannot settle, including private-label share, promo intensity, and online mix.
Distribution of primary research fieldwork respondents
| Company type | Respondent position | Region |
|---|---|---|
| Top tier: 32% | CXOs: 17% | APAC: 44% |
| Mid tier: 49% | Functional/Unit leaders: 24% | EMEA: 30% |
| Smaller Players: 19% | Managers: 59% | Americas: 26% |
Market-Sizing & Forecasting
Sizing started with a top-down build where food-category consumption and trade series were used to reconstruct the demand pool for soy-based foods by region, followed by channel splits that reflect modern retail, convenience, and online penetration. We then checked those totals with selective bottom-up approximations, mainly sampling price per kilogram or per liter multiplied by observed category volumes, plus supplier and distributor roll-ups where public financial lines were available.
Key inputs that shaped the model included soy food and beverage consumption trends, the pace of dairy-alternative adoption, average selling price movement driven by soy raw material costs and promotions, the share shift toward online retail, and organic versus conventional mix where labeling and certifications change pricing. Where a subcategory lacked a clean public series, we used proxy indicators (such as import codes, retail assortment expansion, and capacity announcements) and then adjusted shares based on what interviews suggested was realistic. Forecasting relied on scenario analysis supported by expert views on price elasticity, input-cost cycles, and the expected rate of plant-based switching, after which growth paths were smoothed to avoid one-time shocks becoming long-run trends.
Data Validation & Update Cycle
Outputs were validated through multiple checks so the final series stays consistent with observed market behavior. We compared modeled values against independent signals such as category revenue disclosures, trade and production directionality, and known pricing ranges, then investigated any sharp jumps before sign-off.
A second analyst review was used to test assumptions and ensure the math holds across regions, channels, and product groups. The report is refreshed annually, and interim updates are triggered when material events occur, including major regulation changes, supply disruptions, or meaningful pricing shifts. Before delivery, a final pass is completed so clients receive the latest aligned view.
Mordor Intelligence's Soy Based Food Market Size Measured Against Other Published Estimates
Published market sizes for soy-based foods can vary a lot, even when the topic looks similar, because the counted product set and the pricing point in the value chain are not always the same. Differences also show up when one estimate leans more on broader soybean food categories while another stays closer to consumer-facing soy foods.
The largest gaps usually come from scope and counting rules, for example whether soybean oil, soy ingredients, or animal-feed uses get mixed into the total, and whether values are measured at retail selling price versus manufacturer revenues. Currency timing and inflation handling can also shift results, especially when soy input costs move quickly, and some publishers do not re-check assumptions when channel mix changes at speed. Keeping soy-derived meat substitutes and dairy alternatives within a consistent retail-value logic, and re-validating price and volume ranges with channel-side interviews in each update cycle, supports the tighter and more traceable estimate used near the end by Mordor Intelligence.
Benchmark comparison
| Source | Market Size | Gaps in Research Methodology |
|---|---|---|
| Mordor Intelligence | USD 32.07 B (2026) | |
| Trade Journal A | USD 63.58 B (2024) | This figure appears to use a wider soybean food and beverage umbrella, which can pull in adjacent soy categories beyond finished soy-based foods, and it is anchored to an earlier base year with a different inflation and currency timing. |
| Global Consultancy B | USD 44.41 B (2025) | This estimate likely combines a broader set of soy foods under a single total and may rely more on supply-side value chain assumptions, which can differ from a retail-value approach when private label, promotions, and online mix change quickly. |
The spread across published numbers is mainly explained by what gets counted as a soy-based food, and where the value is captured along the chain. By keeping the scope tied to consumer-facing soy foods and testing prices and channel shares with real market participants, the final number remains easier to replicate and update over time.
Key Questions Answered in the Report
What is the projected value of the soy-based food market by 2031?
The soy-based food market is forecast to reach USD 43.66 billion by 2031.
Which product category is growing fastest within soy foods?
Dairy alternatives are expanding at a 6.73% CAGR through 2031, outpacing meat substitutes.
How significant is Asia-Pacific to global soy demand?
Asia-Pacific generated 33.05% of global revenue in 2025, making it the largest regional contributor.
Why are organic soy products gaining traction?
Certified organic lines command 25–35% price premiums and post a 6.86% CAGR as health-conscious consumers seek traceable, pesticide-free options.
What technologies are improving soy taste and texture?
Cold-plasma treatment, ultrasound-assisted extraction, and twin-screw extrusion remove off-flavors and create meat-like fibrous structures that boost consumer acceptance.