
Market Overview
| Study Period | 2021 - 2031 |
|---|---|
| Forecast Data Period | 2026 - 2031 |
| Base Year Market Size (2025) | 125.10 gigawatt |
| Market Volume (2026) | 142.01 gigawatt |
| Market Volume (2031) | 267.84 gigawatt |
| Growth Rate (2026 - 2031) | 13.52 % |
| Market Concentration | Medium |
Major Players *Disclaimer: Major Players sorted in no particular order Image © Mordor Intelligence. Reuse requires attribution under CC BY 4.0. | |
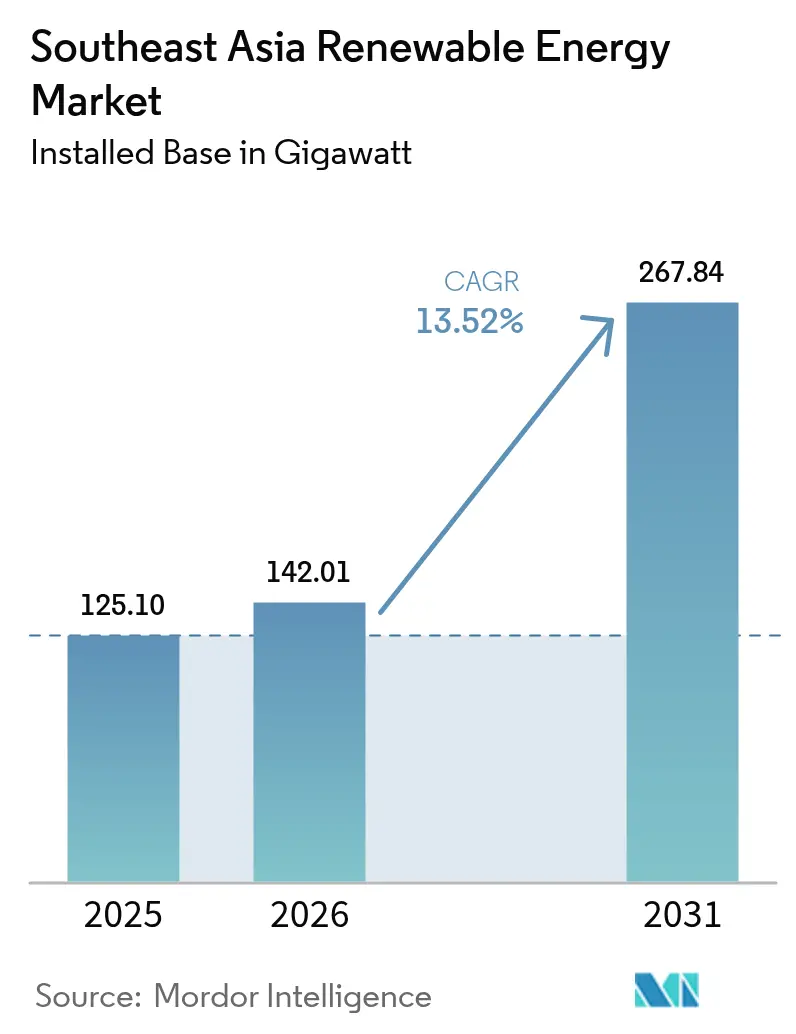
Southeast Asia Renewable Energy Market Analysis by Mordor Intelligence
The Southeast Asia Renewable Energy Market size was valued at 125.10 gigawatt in 2025 and estimated to grow from 142.01 gigawatt in 2026 to reach 267.84 gigawatt by 2031, at a CAGR of 13.52% during the forecast period (2026-2031).
Rapid policy alignment with net-zero targets across eight ASEAN states has accelerated investment, while persistent LNG price volatility has improved the cost-competitiveness of solar-plus-storage solutions compared to gas-fired power.[1] Solar retains the largest slice of capacity, aided by declining module costs and mature supply chains, while wind energy is the fastest growing, following large offshore concessions in the Philippines and onshore pipeline expansion in Vietnam. Corporate RE100 programs in export-oriented sectors are spurring commercial and industrial (C&I) demand, especially in Thailand’s automotive clusters and Vietnam’s electronics parks. The region’s competitive landscape remains moderately fragmented, with local developers such as ACEN and Gulf Energy competing against global players like Ørsted and Vena Energy for gigawatt-scale auctions.
Key Report Takeaways
- By type, hydropower led with 51.35% of the Southeast Asia renewable energy market share in 2025; ocean energy is forecast to expand at a 134.85% CAGR to 2031.
- By end-use sector, the utility segment accounted for 70.15% of the Southeast Asia renewable energy market size in 2025, while commercial and industrial PPAs are projected to advance at a 16.14% CAGR through 2031.
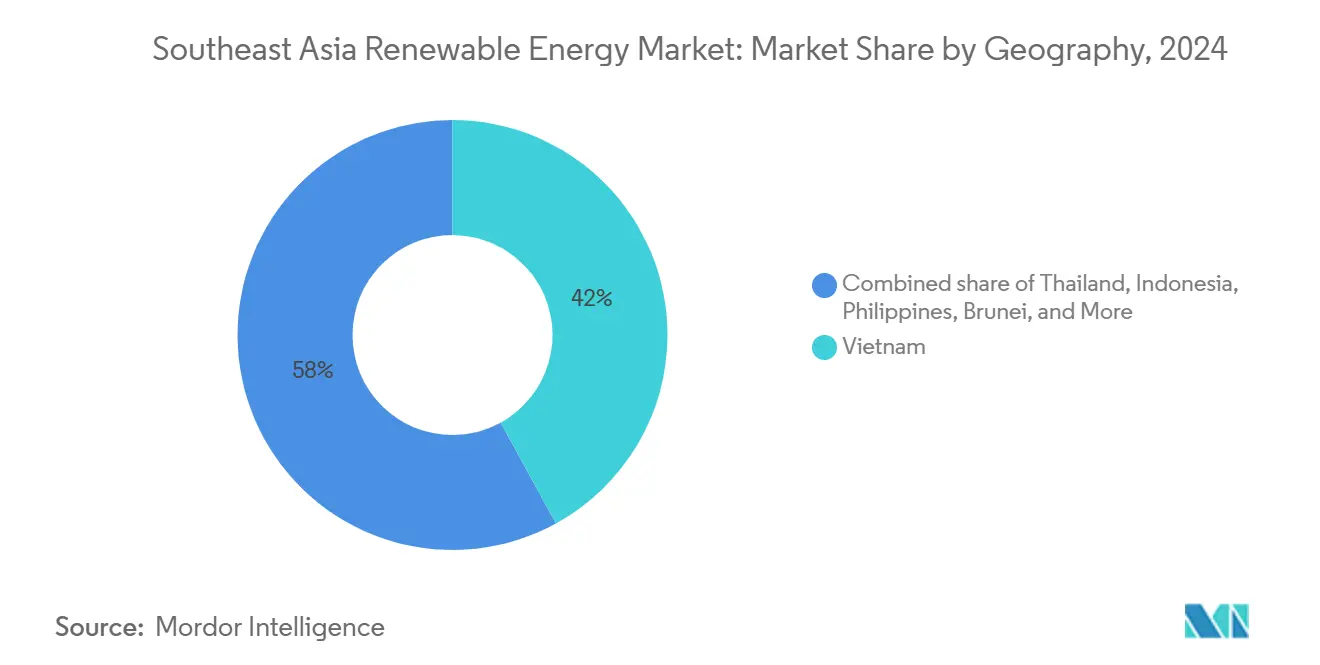
- By geography, Vietnam commanded 41.55% capacity share in 2025, yet Brunei is poised for a 101.32% CAGR between 2026-2031.
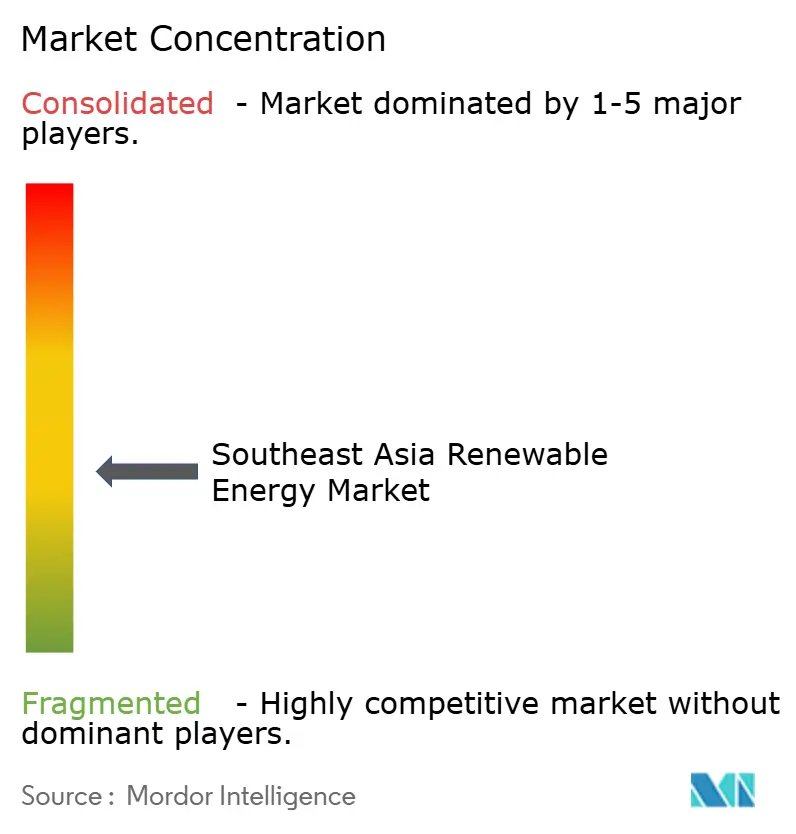
- ACEN, B.Grimm Power, and Gulf Energy, together, controlled less than 10% of regional capacity in 2025, underscoring a fragmented competitive field.
Note: Market size and forecast figures in this report are generated using Mordor Intelligence’s proprietary estimation framework, updated with the latest available data and insights as of 2026.
Southeast Asia Renewable Energy Market Trends and Insights
Drivers Impact Analysis*
| Driver | (~) % Impact on CAGR Forecast | Geographic Relevance | Impact Timeline |
|---|---|---|---|
| ASEAN Green-Energy Financing Booms | +2.80% | Regional (SG, VN, ID, PH) | Medium term (2-4 yrs) |
| Rapid Corporate RE100 Procurement | +2.30% | VN, TH, MY | Short term (≤ 2 yrs) |
| LNG Price Volatility Favoring Solar-Storage | +2.10% | ID, TH, PH | Medium term (2-4 yrs) |
| Cross-Border Power-Trade Initiatives | +1.90% | LA, TH, MY, SG | Long term (≥ 4 yrs) |
| Net-Zero-Driven Gigawatt Auctions | +2.50% | ID, PH | Medium term (2-4 yrs) |
| Grid-Connected Floating Solar Pilots | +1.20% | ID, TH, PH | Long term (≥ 4 yrs) |
| Source: Mordor Intelligence | |||
Green-energy financing booms led by Singapore-based funds
Singapore’s Green Bond Framework aims to target SGD 35 billion of sustainable issuance by 2030, catalyzing cross-border capital flows into renewable projects across ASEAN.[2] Sovereign investment vehicles, such as Temasek, partnering with BlackRock’s USD 1.4 billion climate fund, are steering private capital toward distributed solar developers, unlocking commercial and industrial (C&I) rooftops that were previously underserved. The Norwegian Climate Investment Fund’s USD 55 million equity investment in Indonesia’s Xurya demonstrates that foreign investors favor smaller, scalable arrays that match industrial electricity profiles. Local banks follow suit, DBS’s RE100 pledge signals that financiers are embedding green-sourcing clauses in corporate loans, creating an ecosystem where renewable procurement becomes a baseline requirement.
Rapid corporate RE100 procurement across export-led industries in Vietnam & Thailand
Vietnam has lifted its 2030 solar target to 73 GW after multinationals relocating from China indicated demand that outstrips earlier forecasts. Thailand mirrors this push: its 5 GW feed-in-tariff round explicitly earmarks industrial zones where auto and electronics producers need verified clean electricity. The Asian Development Bank’s USD 820 million loan for 12 Thai solar-plus-storage projects underscores storage moving from pilot to prerequisite for round-the-clock supply. Long-term corporate PPAs, often spanning 15 to 20 years, now price below volatile LNG-indexed tariffs, providing exporters with both cost certainty and compliance with supplier codes of conduct.
Accelerating LNG price volatility improving LCOE competitiveness of solar-plus-storage
Spot LNG prices averaged more than double their 10-year mean throughout 2024, lifting the levelized cost of gas generation above that of comparable solar-plus-storage projects in Indonesia and Thailand. Indonesia's PLN absorbed USD 8 billion in subsidies to shield retail tariffs, sharpening the government's resolve to cut fossil exposure. Industrial buyers respond by locking in renewables to hedge energy price risk; this has made solar paired with four-hour batteries bankable, as project finance models can tap grid-service revenues and energy sales. In Thailand, energy-intensive exporters prioritize renewables for budget stability, thereby pushing commercial and industrial (C&I) demand beyond the earlier utility-scale bias.
Cross-border power-trade initiatives (Lao-PDR-Thailand-Malaysia-Singapore) scaling regional demand
The LTMS-PIP’s 300 MW pilot validated the technical feasibility of a multi-country, asynchronous grid trade.[3] Singapore, a land-constrained yet affluent nation, has committed to importing 4 GW of renewables by 2035, effectively underwriting large hydro and solar projects in neighboring economies. Sarawak Energy is positioning Malaysia’s hydro-rich state as a clean-power exporter, while Laos intends to monetize surplus hydro by sending electrons south. Harmonized wheeling rules under the broader ASEAN Power Grid initiative reduce investor risk, letting developers size projects to a multi-market offtake instead of a single national demand curve.
Restraints Impact Analysis*
| Restraint | (~) % Impact on CAGR Forecast | Geographic Relevance | Impact Timeline |
|---|---|---|---|
| Grid Congestion & Curtailment in Southern VN | −1.8% | VN (Ninh Thuan, Binh Thuan) | Short term (≤ 2 yrs) |
| Auction Transition Uncertainty in Indonesia | −1.5% | ID | Medium term (2-4 yrs) |
| Land-Banking & Right-of-Way Issues in PH | −1.2% | PH | Medium term (2-4 yrs) |
| Limited Wind-Turbine Manufacturing Base | −1.0% | Regional (VN, PH, TH) | Long term (≥ 4 yrs) |
| Source: Mordor Intelligence | |||
Grid congestion & curtailment risks in Vietnam’s southern corridor
Vietnam’s renewable energy rollout has outpaced its 500 kV backbone, forcing solar farms in Ninh Thuan and Binh Thuan to curtail output as demand lies hundreds of kilometers to the north. The eighth Power Development Plan acknowledges this bottleneck, but timelines for new lines remain vague. Developers are incorporating 5 to 10% curtailment assumptions into their cash flows, which increases the required tariffs or returns. The government has floated direct-wire PPAs to local industry as an interim relief, yet that would shift rather than solve congestion. Until transmission catches up, financiers may favor regions with excess evacuation capacity.
Land-banking & right-of-way challenges for utility-scale projects in the Philippines
Complex land titles and smallholder plots delay site aggregation, raising soft costs and elongating financial close timelines. Aboitiz Power lists land issues alongside grid access as its top development risks; more than 1,000 awarded service contracts remain inactive, illustrating the gridlock. To reach the 50% solar capacity generation goal by 2040, 46,140 ha would be required, intensifying competition with agriculture. Green Lanes streamline paperwork but cannot resolve overlapping tenure; deeper cadastral reforms are required.
*Our forecasts treat driver/restraint impacts as directional, not additive. The impact forecasts reflect baseline growth, mix effects, and variable interactions.
Segment Analysis
By Type: Hydropower Anchors Capacity, Ocean Energy Surges from Near-Zero Base
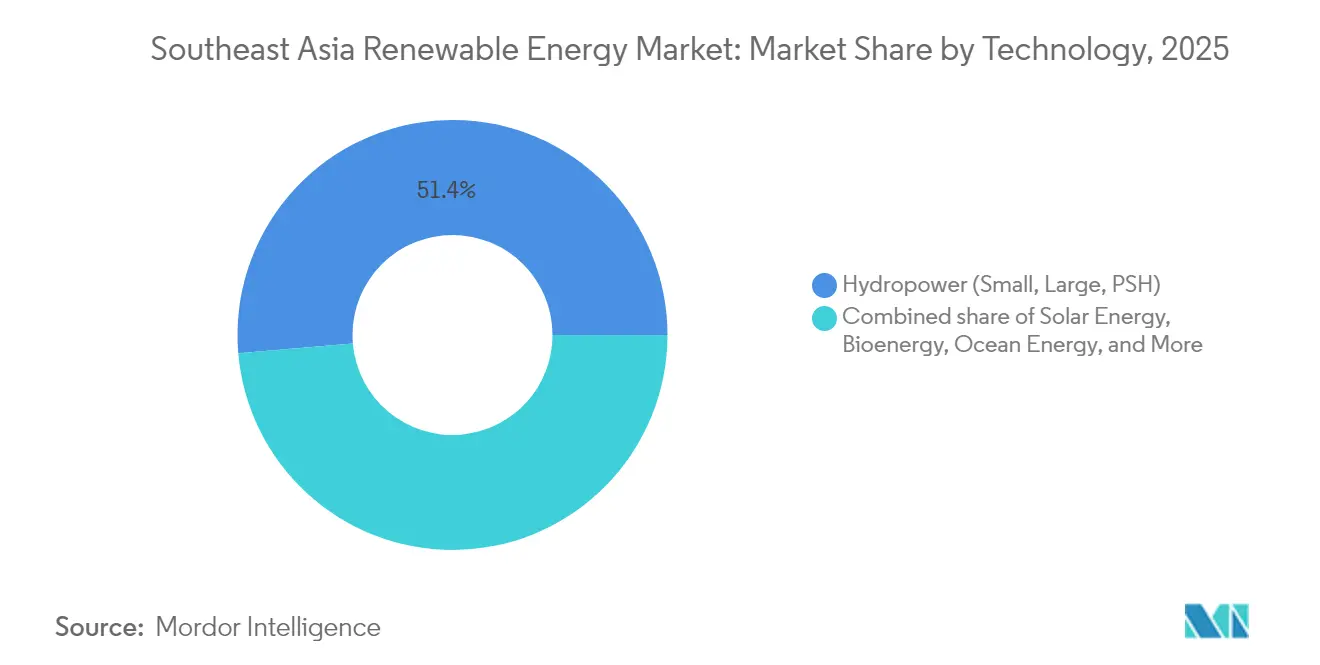
Hydropower accounted for 51.35% of installed capacity in 2025, underpinned by large dams in Laos and Malaysia’s Sarawak region that export surplus electricity to neighbors. Solar photovoltaics supplied roughly 35% of Vietnam’s energy after its 2019-2020 boom, benefiting from a module oversupply that pushed prices below USD 0.15 per watt. Onshore wind contributed 8-10%, concentrated in Vietnam’s central highlands, while offshore wind remained in pre-construction despite multi-gigawatt concessions. Ocean energy is poised for significant growth, with a projected 134.85% CAGR through 2031 for tidal and wave pilots in the Philippines and Indonesia.
Ocean technologies currently total less than 10 MW, so even modest additions will result in triple-digit growth. Capital expenditure per megawatt remains 3-4 times that of offshore wind, and regional supply chains for subsea cables are lacking, which temper near-term commercialization. Bioenergy supplied 4-5%, mainly from palm oil mill effluent in Indonesia and rice husk combustion in Thailand, whereas geothermal, classified under “Other”, delivered roughly 2 GW, mostly in Indonesia and the Philippines.

By End-Use Sector: Utilities Dominate, Corporate PPAs Reshape Procurement
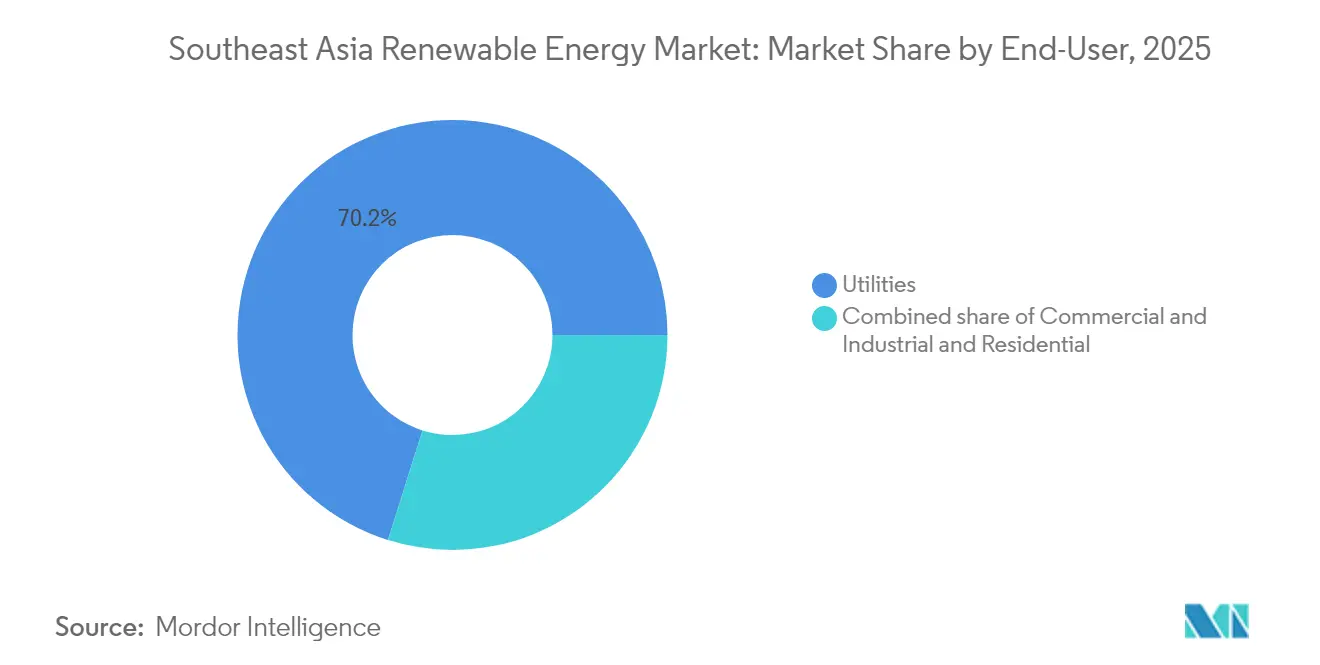
Utilities owned 70.15% of capacity in 2025 and are forecast to grow at a 15.92% CAGR on the back of gigawatt-scale auctions in Indonesia and the Philippines. Competitive bidding compressed tariffs by 20-30% relative to legacy incentives, driving developers to streamline engineering, procurement, and construction costs. Commercial and industrial rooftop solar captured 20-25% of the market, powered by Vietnam’s Decree 80/2024 and Thailand’s Direct PPA rules, which allow export manufacturers to lock in 10-15-year contracts at fixed prices.
Residential rooftop systems remain marginal at 5-8% because Philippine and Thai caps restrict system size, and bank financing for small owners is scarce. Singapore differs: more than 1,500 HDB blocks host panels under mandated solar-ready roofs, illustrating the policy’s role in demand creation.
Geography Analysis
Vietnam’s 41.55% share of the Southeast Asia renewable energy market in 2025 stemmed from a 16 GW solar surge during 2019-2020; however, 30-40% midday curtailment now stifles returns. EVN’s USD 3 billion grid upgrade, due in 2027, should alleviate congestion, while Decree 80/2024 opens up 1 GW of corporate PPA demand, partly offsetting auction delays. Offshore wind, including La Gan’s 3.5 GW, could diversify generation post-2027, although typhoon-proof turbines raise capital expenditures by 15-20% over European benchmarks.
Indonesia and the Philippines rely on auctions to fulfill net-zero pledges. Indonesia’s USD 20 billion Just Energy Transition Partnership is experiencing slow disbursement, and PPA negotiations typically last 9-12 months. The Philippines’ 3.6 GW 2024 auction faces land-banking bottlenecks, yet low solar and wind tariffs signal improving competitiveness. Indonesia’s 145 MW Cirata floating solar project reveals reservoir potential, offering 30-40% interconnection savings compared to ground-mount projects. Thailand and Malaysia present mature regulatory landscapes. Thailand’s Direct PPA law and Malaysia’s Corporate Renewable Energy Supply Scheme attract multinational manufacturers seeking green power hedges. Thailand is also studying pumped storage to buffer variable renewable energy sources, while Malaysia’s Sarawak exports hydroelectric surpluses to the Peninsular grids. Singapore compensates for land scarcity with a 4 GW import target and mandatory rooftop solar on public housing, whereas Brunei, from near-zero renewables in 2024, expects a 101.32% CAGR through 2031, anchored by its first 54 MW solar plant.
Regulatory Landscape
Policy frameworks across Southeast Asia are increasingly structured around auctions, direct power purchase agreements (DPPAs), and cross-border trade alignment under ASEAN cooperation. At the regional level, the ASEAN Plan of Action for Energy Cooperation (APAEC) 2026-2030 has been endorsed, reinforcing coordinated implementation of the ASEAN Power Grid and related work on harmonizing rules for multi-country wheeling and renewable electricity trade.
At the national level, governments and regulators are continuing to formalize enabling rules for renewables deployment and procurement. Vietnam issued Decree 58/2025/ND-CP (effective March 2025) as a guiding framework for renewable and new-energy power development under the Law on Electricity, supporting structured investment pathways including corporate offtake mechanisms. In Malaysia, the Energy Commission (ST) rolled out Solar Accelerated Transition Action Programme (Solar ATAP) guidelines effective 1 January 2026 to expand consumer-based solar with grid export options, while it also updated the Green Electricity Tariff (GET) guidelines (14 July 2025) to integrate the Malaysia Renewable Energy Certificate (mREC); at the subnational level, Sabah has operated dedicated feed-in approval and tariff eligibility rules since 3 January 2024.
Competitive Landscape
Competition in the Southeast Asia renewable energy market is moderate and intensifying, with no single developer exceeding 10% of installed capacity. Regional champions, such as ACEN in the Philippines, Gulf Energy in Thailand, and B.Grimm in Thailand, leverage their domestic relationships to secure land and permits quickly. International majors such as Ørsted and Vena Energy bring project finance expertise and offshore wind experience, often teaming with local partners to navigate licensing. Technology focus is a key differentiator: Sunseap concentrates on commercial and industrial (C&I) solar rooftops, Nexif Energy on multi-country wind, and Masdar on floating solar, as evidenced by its PLN joint projects.
Joint ventures are becoming the norm. BuhaWind Energy, a joint venture between Copenhagen Energy and PetroGreen, invests PHP 330 billion in Ilocos Norte’s first 1 GW offshore wind farm, illustrating how risk sharing unlocks large-scale projects. Supply-chain localization provides a cost edge: CS Wind’s tower factory in Vietnam and potential nacelle assembly lines in Indonesia reduce lead times and import duties. However, turbine shortages persist region-wide, exposing projects to price spikes and schedule risks until local manufacturing scales.
Southeast Asia Renewable Energy Industry Leaders
-
B.Grimm Power PCL
-
Gulf Energy Development PCL
-
ACEN Corp (Ayala Group)
-
Vena Energy
-
BCPG PCL
- *Disclaimer: Major Players sorted in no particular order
Market Opportunities and Future Outlook
Utility-scale solar paired with storage remains a key whitespace across multiple ASEAN power systems, particularly where variable renewables and congestion management affect project bankability. In the Philippines, Meralco PowerGen Corporation (MGEN) inaugurated Phase 1 of MTerra Solar in Nueva Ecija in July 2026, combining 1,373 MW of solar PV with 825 MW (3,300 MWh) of battery storage, which shows how grid-scale hybrid configurations with storage are moving from concept to execution.
Corporate and cross-border offtake frameworks also broaden the investable pipeline, especially for export-driven industrial loads seeking traceable clean electricity. Vietnam refined the DPPA mechanism via Decree 243/2026/ND-CP (issued 26 June 2026), amending earlier 2025 decrees to sharpen implementation pathways for renewable producers contracting with large consumers. On the regional interconnection front, the Monsoon Wind Power Project in Lao PDR reached commercial operation in August 2025 as a 600 MW cross-border renewable supply arrangement to Vietnam, reinforcing the investability of projects structured around ASEAN Power Grid-linked demand rather than single-country offtake alone. KN Holdings started construction of a 304 MW floating solar project in Dak Lak in June 2026, with integrated battery energy storage and associated substation works.
Recent Industry Developments
- July 2026: Meralco PowerGen Corporation (MGEN) inaugurated Phase 1 of MTerra Solar in Nueva Ecija, Philippines, deploying 1,373 MW of solar PV with 825 MW of battery energy storage. The project establishes a utility-scale hybrid configuration with storage as a core grid integration tool.
- May 2026: Gulf Energy Development PCL secured THB 60 billion in loan facilities to invest in 27 renewable energy projects with a total contracted generation capacity of 939 MW. The portfolio includes 843 MW of solar and solar-plus-BESS and 96 MW of waste-to-energy.
- May 2025: ACEN and Copenhagen Infrastructure Partners (CIP) partnered to develop the Philippines first large-scale offshore wind project. The structure combines ACENs local development platform with CIP-linked offshore wind expertise and capital to advance concession-led project structuring.
Research Methodology Framework and Report Scope
Market Definition and Coverage
This market is defined as renewable power installed capacity added and operating across Southeast Asia, measured in gigawatts, and covering solar, wind, hydropower, bioenergy, geothermal, and ocean energy projects.
Scope exclusions: We exclude conventional thermal power capacity and purely planned projects that have not reached commissioning.
Segmentation Overview
- By Technology
- Solar Energy (PV and CSP)
- Wind Energy (Onshore and Offshore)
- Hydropower (Small, Large, PSH)
- Bioenergy
- Geothermal
- Ocean Energy (Tidal and Wave)
- By End-User
- Utilities
- Commercial and Industrial
- Residential
- By Geography
- Vietnam
- Indonesia
- Philippines
- Thailand
- Malaysia
- Singapore
- Rest of Southeast Asia
Data Sources, Market Sizing, and Validation
Desk Research
Desk work starts by mapping the renewable capacity that exists today, how fast it has been growing, and which technologies are driving that change. We use public power statistics and policy releases that stay consistent over time, including IEA country and regional energy data, IRENA renewable capacity datasets, ASEAN energy publications, and national regulator and ministry sources such as energy departments and grid operators.
We then cross-check project direction and build-out feasibility using sources like utility and developer announcements, tender and auction notices, EPC and OEM press releases, and annual reports and investor decks. When a specific plant or program is difficult to track in public records, we use a paid subscription for company financials and a separate patent database to confirm timelines, technology focus, and plausible build rates. These desk sources are illustrative, and we also used many other public references during data collection, clarification, and validation.
Primary Interviews and Surveys
Primary work was used to pressure-test the capacity pipeline and to understand what is likely to be built versus what is only announced. We spoke with a mix of developers, utilities, EPC firms, equipment suppliers, lenders, and sector advisors across the region, so country-level differences in permitting, grid constraints, and tariff design were captured.
Distribution of primary research fieldwork respondents
| Company type | Respondent position |
|---|---|
| Top tier: 32% | CXOs: 12% |
| Mid tier: 52% | Functional/Unit leaders: 38% |
| Smaller Players: 16% | Managers: 50% |
Market-Sizing & Forecasting
Sizing is built from the top down by reconstructing installed renewable capacity using country power statistics and technology-level renewable capacity series, and then aligning the results to the report scope and time period. After total capacity is formed, we corroborate it with selective bottom-up checks, mainly sampled project commissioning lists, tender award volumes, and a light roll-up of publicly disclosed project pipelines to confirm whether the implied additions look realistic.
Several practical inputs shape the model, including annual renewable commissioning rates by technology, grid connection readiness, auction and feed-in tariff schedules, typical construction lead times, and expected repowering or life-extension behavior for older assets. For hydropower, the split between small and large projects matters because delivery risk and permitting cycles are typically different. When country data series are missing for a year, we fill gaps using interpolation tied to nearby years and confirmed project milestones, and then re-check the output with expert feedback.
Forecasting uses scenario analysis supported by simple trend fitting on historical additions. The scenarios mainly reflect policy continuity, grid build-out speed, and financing conditions. The final forecast is kept explainable, so each year can be traced back to capacity additions by technology and country, and it is validated against what local experts consider buildable.
Data Validation & Update Cycle
Validation is done through a set of cross-checks, where modeled capacity trends are compared with independent signals such as national generation mix updates, auction calendars, and grid interconnection progress. Outliers are reviewed country by country, and if a jump cannot be explained by a clear commissioning event or policy change, the assumption is revisited and the related input series is corrected.
Before sign-off, the model and write-up go through multi-step internal reviews, so definitions, units, and time periods stay consistent across technologies and countries. Reports are refreshed annually, and interim updates are triggered when material events happen, such as major tender cancellations, sharp policy resets, or large commissioning delays. Right before delivery, an analyst performs a fresh pass on key datasets and relevant news, so clients receive the most current view available.
Mordor Intelligence's Southeast Asia Renewable Energy Market Size Compared Against Other Published Estimates
Published market sizes for Southeast Asia renewables can differ because some sources size the market in money terms, while others track installed capacity. The results also depend on what each publisher counts as in-scope. Differences can come from how mixed projects are treated, how commissioning timing is handled, and whether announced pipelines are blended into the current base.
In this study, the main spread typically comes from whether pumped storage hydropower and ocean energy are included alongside mainstream solar, wind, hydro, bioenergy, and geothermal, and whether capacity is counted only after commissioning rather than at financial close, a rule applied by Mordor Intelligence.
Benchmark comparison
| Source | Market Size | Gaps in Research Methodology |
|---|---|---|
| Mordor Intelligence | USD 125.10 B (2025) | |
| Industry Association A | USD 118.00 B (2025) | Often limited to solar, wind, hydro, and geothermal, and may exclude pumped storage and early-stage ocean energy, which reduces the counted capacity pool for the same year. |
| Global Consultancy B | USD 150.00 B (2025) | May blend planned and under-construction projects into the base and convert capacity to value using higher assumed capex per MW, which can inflate the size versus commissioning-only accounting. |
The comparison points to two repeatable drivers, which are scope choices around less common technologies and the timing rule for when a project is counted. By anchoring the model to installed capacity that is already commissioned and then validating implied annual additions against policy and grid signals, we end up with a number that can be explained and re-created with the same inputs next year.
Key Questions Answered in the Report
What is the projected capacity of renewables in Southeast Asia by 2031?
The Southeast Asia Renewable Energy Market is forecast to reach 267.84 GW by 2031, growing at a 13.52% CAGR.
Which country currently leads Southeast Asia in installed renewable capacity?
Vietnam held 41.55% of regional capacity in 2025, largely due to its 2019-2020 solar boom.
Why are corporate PPAs gaining popularity in Southeast Asia?
Decree 80/2024 in Vietnam and similar rules in Thailand allow export manufacturers to secure long-term renewable supply, helping them avoid future EU carbon border taxes.
How does floating solar benefit Indonesia’s grid expansion plans?
Projects like the 145 MW Cirata plant leverage existing hydropower reservoirs, cutting interconnection costs by up to 40% and avoiding costly land acquisition.
What are the main bottlenecks facing offshore wind in the region?
Limited local turbine manufacturing, localization mandates, and typhoon-resistant design requirements raise cap-ex and extend procurement timelines.