
Market Overview
| Study Period | 2020 - 2031 |
|---|---|
| Forecast Data Period | 2026 - 2031 |
| Base Year Market Size (2025) | USD 4.96 Billion |
| Market Size (2026) | USD 5.73 Billion |
| Market Size (2031) | USD 11.8 Billion |
| Growth Rate (2026 - 2031) | 15.55 % |
| Market Concentration | Medium |
Major Players *Disclaimer: Major Players sorted in no particular order Image © Mordor Intelligence. Reuse requires attribution under CC BY 4.0. | |
Southeast Asia POS Terminal Market Analysis by Mordor Intelligence
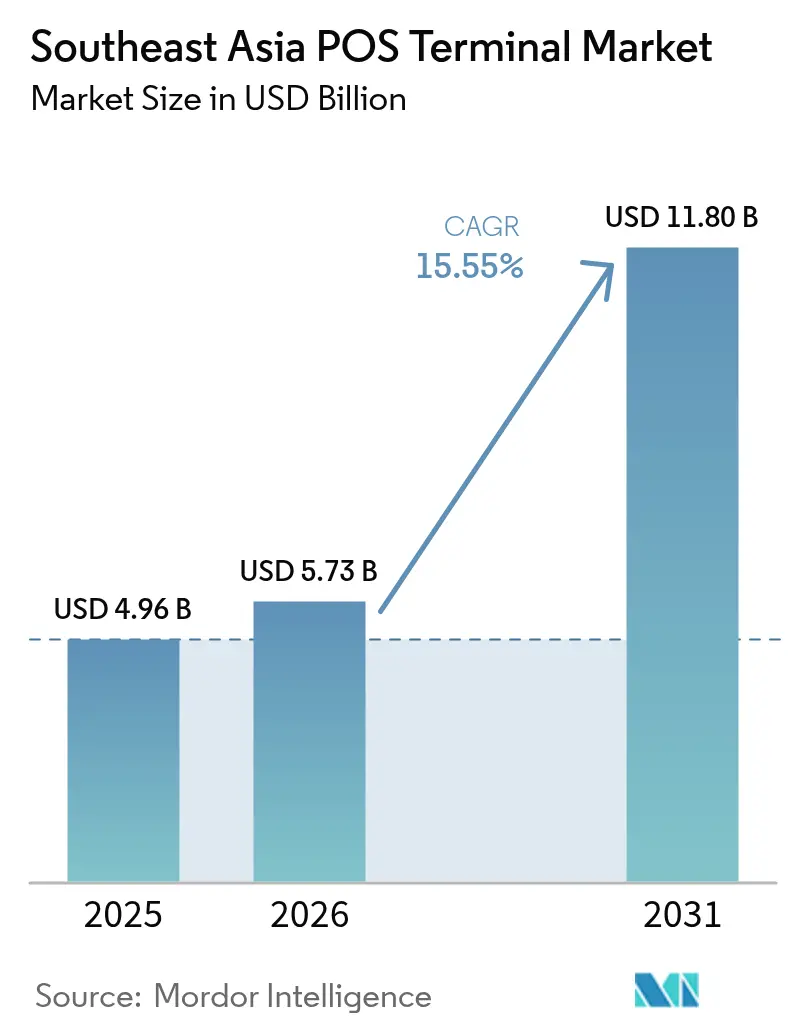
The Southeast Asia POS Terminal Market size was valued at USD 4.96 billion in 2025 and estimated to grow from USD 5.73 billion in 2026 to reach USD 11.8 billion by 2031, at a CAGR of 15.55% during the forecast period (2026-2031). Strong consumer migration to mobile wallets, rising ubiquity of QR codes, and government mandates that compel digital payment acceptance are keeping the Southeast Asia POS Terminal market on a steep growth trajectory. Merchants are shifting capital toward software-defined or hybrid devices that consolidate QR, NFC, and card functions, trimming counter clutter while future-proofing acceptance needs. Competitive focus has moved from hardware specifications to software ecosystems, favoring vendors that bundle inventory, CRM, and financing tools into cloud dashboards. Cross-border payment initiatives under the ASEAN Regional Payment Connectivity program promise faster certification cycles, a factor set to unlock incremental demand for the Southeast Asia POS Terminal market through 2030.[1]
Key Report Takeaways
- By mode of payment acceptance, contactless payments captured 56.97% revenue share in 2025 and is advancing at a 17.05% CAGR through 2031.
- By POS type, mobile and portable systems held 46.25% share of the Southeast Asia POS Terminal market size in 2025 and are poised for a 16.7% CAGR to 2031.
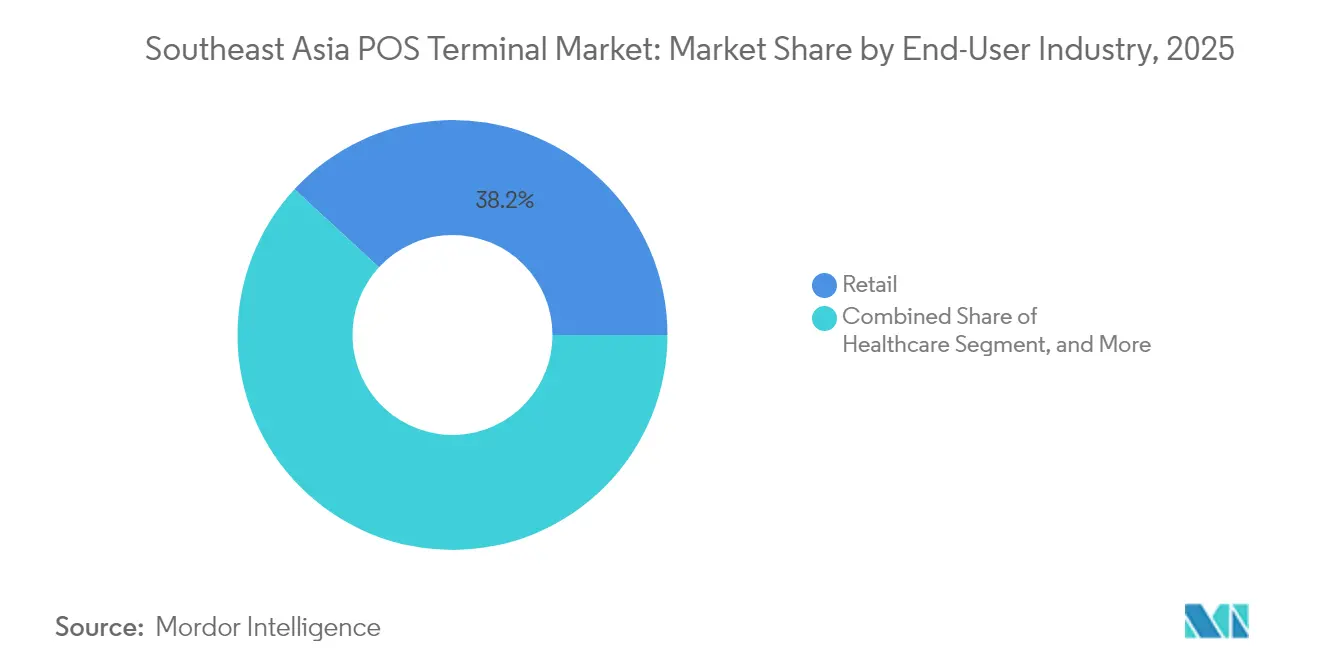
- By end-user industry, retail accounted for 38.15% share in 2025, while healthcare is forecast to expand at a 16.25% CAGR through 2031.
- By country, Indonesia captured 29.55% of the Southeast Asia POS Terminal market share in 2025 and is projected to post a 16.05% CAGR to 2031
Note: Market size and forecast figures in this report are generated using Mordor Intelligence’s proprietary estimation framework, updated with the latest available data and insights as of 2026.
Market Trends and Insights
Drivers Impact Analysis of Southeast Asia POS Terminal Market*
| Driver | (~) % Impact on CAGR Forecast | Geographic Relevance | Impact Timeline |
|---|---|---|---|
| Rapid expansion of digital payments across Southeast Asia | +4.2% | Indonesia, Thailand, Philippines with spillover to Vietnam | Medium term (2-4 years) |
| Government cash-less initiatives and e-payment regulations | +3.8% | Singapore, Malaysia leading, Indonesia and Thailand following | Short term (≤ 2 years) |
| Rising adoption of mPOS among SMEs and micro-merchants | +3.1% | Indonesia, Philippines, Vietnam rural markets | Medium term (2-4 years) |
| Integration of BNPL capabilities into POS hardware | +2.3% | Singapore, Malaysia urban centers expanding regionally | Long term (≥ 4 years) |
| Tourism-driven omnichannel retail recovery post-COVID | +1.8% | Thailand, Singapore, Malaysia tourism corridors | Short term (≤ 2 years) |
| Migration to Android-based open-OS terminals and app stores | +1.5% | Global with early adoption in Indonesia, Thailand | Long term (≥ 4 years) |
| Source: Mordor Intelligence | |||
Rapid Expansion of Digital Payments Across Southeast Asia
Mobile wallets processed more transactions than traditional card networks in Indonesia, Thailand, and the Philippines during 2024, a shift that has amplified replacement cycles for multi-modal devices across the Southeast Asia POS Terminal market. QRIS in Indonesia alone logged more than 16 billion transactions, forcing merchants to ditch single-function card readers in favor of integrated QR/NFC units. Device makers now design terminals with omnichannel APIs, enabling unified reconciliation across storefront and delivery channels. Payment processors, in turn, preload value-added apps loyalty, inventory, BNPL to keep devices sticky over a five-year lifespan. The net effect is sustained double-digit hardware refresh demand, particularly from micro-merchants upgrading from paper or cash registers.
Government Cash-less Initiatives and E-payment Regulations
Malaysia’s e-Tunai Rakyat, Thailand’s PromptPay, and Indonesia’s SME subsidy schemes collectively inject thousands of subsidized terminals into the Southeast Asia POS Terminal market every quarter. Compliance clauses require certified NFC and EMV functionality, accelerating orders for mid-range Android models able to pass local security audits. Because subsidies often cover up-front hardware costs, vendors increasingly pivot to SaaS-based licensing that drives recurring revenue even after grants expire. Rural onboarding programs extend demand into second-tier cities, helping distributors expand beyond capital regions much faster than organic merchant acquisition would allow.
Rising Adoption of mPOS Among SMEs and Micro-merchants
Indonesia-based providers DealPOS and Qasir now serve a combined 500,000 merchants, proving portable readers can scale quickly within the Southeast Asia POS Terminal market ecosystem. Low monthly fees, bundled inventory modules, and simplified KYC have turned tablets into de-facto cash registers for kiosks, food trucks, and pop-up stalls. Hardware durability is less critical than battery life and LTE connectivity, leading suppliers to innovate around hot-swap batteries and rugged casings. Payment aggregators leverage this installed base to up-sell micro-loans, creating a virtuous circle where software-centric vendors outpace legacy hardware incumbents in customer stickiness.
Integration of BNPL Capabilities into POS Hardware
Visa’s Installment Solutions now resides inside several Android terminals sold across Singapore and Malaysia, enabling in-store installment offers without external middleware.[2] Larger ticket retailers such as consumer electronics chains notice 15-20% upticks in average basket size, fueling merchant willingness to refresh to BNPL-ready units early in the lifecycle. Vendors differentiate by embedding instant credit scoring, often via API calls to fintech lenders, allowing approvals within seconds. The inclusion of BNPL workflows cements software as the chief battleground for feature updates, reinforcing a platform mindset throughout the Southeast Asia POS Terminal market.
Restraints Impact Analysis of Southeast Asia POS Terminal Market*
| Restraint | (~) % Impact on CAGR Forecast | Geographic Relevance | Impact Timeline |
|---|---|---|---|
| Cyber-security and data-privacy vulnerabilities | -2.8% | Singapore, Malaysia leading security concerns, Indonesia following | Short term (≤ 2 years) |
| High total cost of ownership for modern POS devices | -2.1% | Philippines, Vietnam price-sensitive markets, Indonesia SME segment | Medium term (2-4 years) |
| Fragmented certification rules across SEA nations | -1.6% | Global impact with highest complexity in Malaysia, Thailand, Indonesia | Medium term (2-4 years) |
| Weak device-servicing networks beyond tier-1 cities | -1.3% | Indonesia, Philippines, Vietnam rural markets, Thailand secondary cities | Long term (≥ 4 years) |
| Source: Mordor Intelligence | |||
Cyber-security and Data-privacy Vulnerabilities
Bank Indonesia recorded a 45% jump in POS-linked fraud attempts during 2024, highlighting real-time threats that could stall new deployments if unaddressed. Malware that exploits outdated firmware spreads quickly once a single device is breached, prompting regulators to mandate over-the-air patch cycles. Smaller retailers, lacking IT staff, depend on vendors for security orchestration; when updates lag, risk-averse merchants defer purchases. Consequently, suppliers must bundle managed security services to keep the Southeast Asia POS Terminal market growth momentum intact.
High Total Cost of Ownership for Modern POS Devices
Modern contactless-enabled terminals often cost USD 1,500–3,000 upfront, plus USD 500–1,000 in yearly fees, a barrier for micro-merchants with thin margins. In the Philippines and Vietnam, traders prolong the life of mag-stripe readers until compelled by regulation to upgrade. Financing models such as hardware-as-a-service and revenue-share bundles are gaining traction, yet many small outlets still hesitate. Unless unit economics improve, price sensitivity could shave two full percentage points off the Southeast Asia POS Terminal market CAGR projection.
*Our forecasts treat driver/restraint impacts as directional, not additive. The impact forecasts reflect baseline growth, mix effects, and variable interactions.
Southeast Asia POS Terminal Market Segment Analysis
By Mode of Payment Acceptance:
Contactless Dominance Reshapes Terminal ArchitectureContactless payments controlled 56.97% revenue share within the Southeast Asia POS Terminal market in 2025, and the segment is forecast to widen at a 17.05% CAGR through 2031. That dominance positions tap-to-pay as the baseline capability for every new device SKU. Vendors now engineer antenna placement and screen prompts to accelerate sub-two-second checkouts, an attribute that merchants equate with higher throughput. QR fallback remains essential for low-value micro-merchant use cases, ensuring no consumer gets blocked by wallet preference.
Terminal makers are stripping mechanical card slots from entry-level units, dropping component costs while promoting SoftPOS for PIN-on-glass transactions. This evolution underlines how the Southeast Asia POS Terminal market size tied to contactless solutions will eclipse card-only hardware retirements by mid-decade. The push also drives telcos to bundle higher LTE data caps with mPOS subscriptions, reflecting traffic spikes from always-connected firmware updates and analytics pings.


By POS Type:
Mobile Solutions Drive Market TransformationMobile and portable readers owned 46.25% of the Southeast Asia POS Terminal market in 2025 and are on track for a 16.7% CAGR through 2031. Street vendors, ride-hail drivers, and delivery couriers prefer belt-clip or smartphone-based units, which let them accept payment at customer doorsteps. Battery density improvements extend operating time to a full shift, eliminating power-bank dependence.
The Southeast Asia POS Terminal industry further amplifies mobility’s appeal by integrating barcode inventory apps and rider tracking dashboards on the same device, streamlining reconciliations. SUNMI’s decision to open repair hubs in Bangkok trims device downtime from weeks to days, a critical factor for cash-flow-sensitive SMEs. As more cloud POS platforms secure EMV Level 3 certification, fixed countertop hardware risks marginalization except in hyper-volume supermarkets.
By End-User Industry:
Healthcare Emerges as Growth EngineRetail accounted for 38.15% of the Southeast Asia POS Terminal market in 2025, but healthcare is projected to clock a 16.25% CAGR to 2031. Clinics and telemedicine platforms now demand terminals able to tokenize patient data while routing split payments among insurers, doctors, and labs. Such niche workflows push vendors into HIPAA-equivalent compliance builds, creating a specialized SKU tier.
This healthcare tilt also increases average selling prices, lifting overall Southeast Asia POS Terminal market size for clinical environments compared with standard retail. Further, pharmacies running consultation booths shell out for BCODE scanning to verify e-prescriptions, expanding attach rates for ancillary modules like label printers and biometric sensors.
Geography Analysis
Indonesia POS Terminal Market
Indonesia’s 29.55% revenue share anchors the Southeast Asia POS Terminal market, with a forecast 16.05% CAGR keeping it the region’s growth locomotive. Mandatory QRIS compliance triggers rapid swap-outs of legacy standalone card readers for code-scanning hybrids. Local certification norms favor vendors, with Jakarta labs able to test firmware against Bank Indonesia’s security checklists, leading global brands to seek domestic channel partners.
APAC POS Terminal Market
Secondary markets such as Thailand and Malaysia exhibit advanced feature adoption, think SoftPOS PIN entry and BNPL APIs, despite smaller absolute volumes. Singapore maintains record terminal density per capita, yet its mature status means replacement, not expansion, drives orders. The Philippines and Vietnam, home to vast unbanked populations, represent white-space opportunities where low-cost mobile form factors resonate.
Java, Bali, Sumatra and Kalimantan POS Terminal Market
Indonesia continues to set installation records, fueled by state subsidies that slash merchant onboarding fees and by telecom operators bundling SIM data plans with terminal leases. Java and Bali now near saturation, prompting distributors to push deeper into Sumatra and Kalimantan.
Thailand and Malaysia POS Terminal Market
Thailand’s tourist-centric corridors witness accelerated upgrades to multilingual user interfaces, aligning with duty-free operators’ push to accept Chinese and European wallet schemes. Malaysia’s interoperable DuitNow QR ecosystem drives cross-industry pilots where the same terminal toggles between food-delivery settlements and utility bill collections.
ASEAN POS Terminal Market
Vietnam and the Philippines trail on per-capita device count but leapfrog in SoftPOS pilots, aided by cloud KYC flows that approve merchants in minutes. Urban migration patterns in Ho Chi Minh City and Manila heighten card-not-present fraud concerns, convincing regulators to expedite tokenized contactless rollouts. Cambodia, Laos, and Myanmar remain nascent yet poised to benefit once ASEAN connectivity cuts certification duplication costs.
Regulatory Landscape
Payment acceptance in Southeast Asia is being shaped by central-bank rules that push interoperability, stronger security controls, and clearer governance for payment service providers. In Indonesia, Bank Indonesia is anchoring interoperability through the National Open API Payment Standard (SNAP). In March 2026, it moved to a refreshed payment-system framework via Regulation 10/2025 and PADG 32/2025, lifting the compliance bar for terminal-linked acquiring and API-led integrations.
Across the region, policy momentum is tilting toward standardization and cross-border alignment. In May 2026, ASEAN Senior Economic Officials concluded negotiations on the ASEAN Digital Economy Framework Agreement (DEFA), which includes provisions relevant to electronic payments and digital trade. Malaysia added an interoperability milestone in June 2026 when Bank Negara Malaysia issued the Interoperable Fund Transfer Framework (IFTF), including a timeline to phase out proprietary QR payment networks by 30 June 2028. This change affects terminal software stacks, certification approaches, and merchant migration plans.
Value Chain Analysis
The value chain starts with component suppliers, including secure elements, cryptographic processors, connectivity modules, displays, and batteries. OEMs then design and certify devices for EMV/NFC and security requirements (PCI-related device security plus country-specific audits). Assembly and final device manufacturing are concentrated in East Asian electronics clusters, while Southeast Asian distributors, acquirers, and payment facilitators handle country-level certification, merchant onboarding, deployment, and field maintenance, which is especially important given device-servicing gaps outside tier-1 cities.
Downstream, the market has shifted from selling terminals as hardware to running managed fleets and software-led acceptance stacks. ISVs and fintech-led platforms bundle payments with inventory, CRM, analytics, and lending hooks, which favors Android-based terminals and SoftPOS models that can be updated over-the-air to keep pace with new rails and security mandates. Merchant acquirers, wallet operators, and domestic QR schemes (for example QRIS, PromptPay, and DuitNow QR) sit at the acceptance layer, while ASEAN Regional Payment Connectivity programs add cross-border testing and scheme alignment that can influence device certification and feature roadmaps.
Competitive Landscape
Global incumbents Worldline, Verifone, and PAX Technology still hold the lion’s share, propelled by deep distributor footprints and full EMV certification catalogs. Yet the Southeast Asia POS Terminal market now prizes software richness over hardware revision cadence. Fintech entrants like HitPay, NETS, and Qasir overlay cloud dashboards that merge payments, inventory, and micro-lending into one login, eroding hardware-only players’ pricing power
SoftPOS crystallizes this pivot. NETS’ January 2025 launch turned ordinary Android handsets into contactless readers for food-delivery riders and home-service technicians.[3] Once PCI CPoC standards mature locally, analysts expect sub-USD 100 smartphones to cannibalize low-end countertop sales, compressing gross margins but enlarging total acceptance points.
Despite rising competition, barriers persist. EMV Level 3 and PCI DSS certifications still require lab fees and audits that deter under-capitalized startups. Meanwhile, the ASEAN Payment Connectivity roadmap could homogenize specs, yet cybersecurity add-ons, AI-driven fraud scoring, and real-time key rotation become key differentiators, painting a picture of a Southeast Asia POS Terminal market where platform alliances outweigh isolated hardware upgrades.
Southeast Asia POS Terminal Industry Leaders
-
Verifone Systems LLC
-
PAX Technology Ltd.
-
NCR Corporation
-
Toshiba TEC Corporation
-
Newland Payment Technology Co., Ltd.
- *Disclaimer: Major Players sorted in no particular order

Southeast Asia POS Terminal Market Companies Covered in this Report
- Worldline SA (Ingenico)
- Verifone Systems LLC
- PAX Technology Ltd.
- NCR Corporation
- Toshiba TEC Corporation
- Newland Payment Technology Co., Ltd.
- HP Inc.
- Samsung Electronics Co., Ltd.
- Fujian Newland Computer Co., Ltd. (Urovo)
- SUNMI Technology Co., Ltd.
- SZZT Electronics Co., Ltd.
- Diebold Nixdorf, Incorporated
- NEC Corporation
- Fujitsu Limited
- BBPOS International Limited
- Centerm Information Co., Ltd.
- New POS Technology Ltd.
- Castles Technology Co., Ltd.
- SUNAR Technology Co., Ltd.
- Squareup International Ltd.
Market Opportunities and Future Outlook
Interoperability mandates are creating an upgrade and integration runway for multi-rail terminals and software-defined acceptance. Malaysia's June 2026 Interoperable Fund Transfer Framework (IFTF) sets an endpoint of 30 June 2028 for proprietary QR networks, pushing merchants and acquirers toward terminals and apps that support standardized QR acceptance without fragmentation. At the same time, national QR standards across ASEAN markets, including Indonesia's QRIS, Thailand's PromptPay, Malaysia's DuitNow QR, Vietnam's VietQR, and the Philippines' QR Ph, reinforce demand for devices that unify QR, NFC, and wallet acceptance within a single compliance-tested stack.
Cross-border payment connectivity is another area where vendors can target practical demand from merchants serving tourists and regional buyers. Work under ASEAN Regional Payment Connectivity, together with the creation of Nexus Global Payments, a nonprofit established by regional central banks in April 2025 to develop multilateral cross-border instant payments infrastructure, increases the premium on terminals and SoftPOS apps built around ISO 20022-aligned messaging and configurable rules by country. On merchant economics, the documented high total cost of ownership for modern devices in price-sensitive markets supports opportunity for hardware-as-a-service, bundled data plans, and managed security services, particularly as regulators tighten fraud monitoring and audit expectations for payment service providers.
Recent Industry Developments in Southeast Asia POS Terminal Market
- April 2026: PAX Technology introduced the A920Pro PCI 7 mobile SmartPOS, positioning the device around updated payment security requirements. The launch strengthens PAX's Android SmartPOS portfolio for merchants that need contactless acceptance plus compliant device security as audit scrutiny increases.
- April 2025: BSP Financial Group partnered with Verifone to integrate V660P+ Android 13-based EFTPOS terminals, starting in Papua New Guinea with expansion to other Pacific markets. The program combines terminal deployment with fleet lifecycle and service management, reinforcing the shift from one-time hardware sales to managed terminal estates.
- October 2024: Bank Indonesia imposed stricter POS cybersecurity requirements, including real-time fraud monitoring obligations for relevant participants in the payment ecosystem. The rule change increased the importance of over-the-air patching, device monitoring, and security services bundled with terminals, influencing vendor selection beyond hardware specifications.
Southeast Asia POS Terminal Market Report Scope and Research Methodology
Market Definition and Coverage
This market covers revenues generated from POS terminals used by merchants across Southeast Asia to accept payments and complete in-store or on-premise transactions, including fixed countertop devices and mobile or portable terminals, along with the related software and services tied to the terminal sale.
Scope exclusions: We exclude pure e-commerce payment gateways, consumer wallets not linked to merchant POS acceptance, and general IT hardware that is not used as a POS terminal.
Segments Covered in This Report
- By Mode of Payment Acceptance
- Contact-based
- Contactless
- By POS Type
- Fixed Point-of-Sale Systems
- Mobile / Portable Point-of-Sale Systems
- By End-User Industry
- Retail
- Hospitality
- Healthcare
- Transportation and Logistics
- Other End-User Industries
- By Country
- Singapore
- Malaysia
- Thailand
- Indonesia
- Philippines
- Vietnam
- Rest of Southeast Asia
Data Sources, Market Sizing, and Validation
Desk Research
Desk research was used to map the payment acceptance landscape in Southeast Asia and to anchor country-level adoption signals before we moved into modeling. We relied on public sources such as central bank and payments regulator publications, national statistics offices, ASEAN policy releases on cross-border payments, and World Bank data for merchant and SME indicators. We also used coverage from industry association websites for retail and hospitality, along with peer-reviewed papers on contactless adoption and acceptance infrastructure.
To translate these signals into a usable market model, we triangulated them with company filings, investor presentations, reputable press coverage, and product documentation that clarifies device positioning (fixed vs. portable) and rollout focus. In a few cases, paid subscriptions were referenced only for company financial intelligence, patent lookups, and import and export shipment checks that help validate device flow directionally. This list is not exhaustive, and many other public and paid sources were also used for data collection, validation, and research clarification.
Primary Interviews and Surveys
Primary work focused on validating the real buying and replacement cycle for POS terminals across Southeast Asia. This approach is usually the fastest way to separate installed base narratives from actual annual spending. We spoke with stakeholders across device distribution, payments acceptance, and merchant operations, and we used these inputs to test pricing, attach rates for software and services, and the pace of contactless upgrades across key countries in the region.
Distribution of primary research fieldwork respondents
| Company type | Respondent position |
|---|---|
| Top tier: 32% | CXOs: 12% |
| Mid tier: 54% | Functional/Unit leaders: 43% |
| Smaller Players: 14% | Managers: 45% |
Market-Sizing & Forecasting
We sized the market using a top-down, payment acceptance led build, where merchant counts and acceptance penetration by country are used to reconstruct the addressable terminal demand pool. We then translated into value using typical terminal ASP ranges and annual refresh rates. For each country, the model is informed by practical inputs such as contactless share of transactions, QR vs. card acceptance mix, merchant onboarding pace, replacement cycles for legacy devices, and the spread of portable terminals in hospitality and delivery-heavy formats.
Selective bottom-up checks were used to keep totals realistic, including channel feedback on shipment volumes, sampled ASP checks by device class (fixed and portable), and consistency checks against reported regional traction in vendor and distributor disclosures. Where country-level detail is limited, we bridge them using proxy indicators like retail outlet density and card acceptance intensity, and then adjust after interview validation. For forecasting, we used scenario analysis supported by year-by-year assumptions on contactless upgrades, policy push for interoperability, and merchant digitization programs. The final trajectory is cross-checked with expert consensus on when growth normalizes.
Data Validation & Update Cycle
Outputs are validated through stepwise checks that compare modeled totals against independent signals such as device replacement timing, merchant rollout announcements, and payment infrastructure growth patterns. If a country shows an abnormal jump in implied ASP or penetration, the assumptions are reviewed again and follow-up questions are triggered with interviewees until the variance is explained.
Before sign-off, a second analyst reviews the logic, sources, and calculations, and the narrative is aligned to the numbers so it does not drift. Reports are refreshed annually, and interim updates are made when material events occur, such as regulatory changes on acceptance or major shifts in cross-border payment connectivity. Right before delivery, an analyst completes a fresh pass so clients receive the latest updated view.
Mordor Intelligence's Southeast Asia Pos Terminal Market Estimate Compared With Other Published Estimates
Published market sizes for POS terminals in Southeast Asia often differ because each publisher chooses its own line between terminals, payment acceptance software, and adjacent checkout hardware, then applies different price and adoption assumptions. Differences also come from the base year used, the countries included in the regional roll-up, and how quickly contactless upgrades are assumed to spread.
Some estimates are broader because they fold in the full POS software stack and wider payment processing related revenues, which can inflate totals even when terminal shipments are unchanged. In contrast, Mordor Intelligence counts terminal-led hardware, software, and services only when they are directly tied to POS terminal deployment in Southeast Asian countries, and the value is reconciled to merchant penetration and replacement cycle signals rather than a single regional ASP curve.
Benchmark comparison
| Source | Market Size | Gaps in Research Methodology |
|---|---|---|
| Mordor Intelligence | USD 5.73 B (2026) | |
| Trade Journal A | USD 7.69 B (2028) | Uses a different base year and forward window, and the figure appears to reflect a faster merchant digitization ramp that can overstate near-term terminal revenue in countries with longer replacement cycles. |
| Regional Consultancy B | USD 6.84 B (2027) | Leans on a shorter horizon and a higher implied refresh rate, and it tends to smooth ASP movement across countries, which can miss the mix shift between low-cost portable devices and higher-value fixed deployments. |
The spread in the table is mainly explained by timing, what gets included beyond the terminal, and how quickly replacement and contactless upgrades are assumed to happen across countries. By tying the sizing steps to merchant acceptance penetration, realistic refresh cycles, and country mix, the final number stays traceable to a few clear variables that can be revisited as new information comes in.
Key Questions Answered in the Report
How large is the Southeast Asia POS Terminal market in 2026?
The market is valued at USD 5.73 billion in 2026 and is projected to reach USD 11.8 billion by 2031 at a 15.55% CAGR.
Which country leads terminal deployment in the region?
Indonesia holds 29.55% revenue share and maintains the fastest expansion, supported by the nationwide QRIS mandate.
What segment grows fastest by end-user?
Healthcare posts a 16.25% CAGR to 2031 as clinics integrate real-time payment and patient-data workflows.
Why are merchants moving toward SoftPOS?
Smartphone-based acceptance cuts hardware costs, supports contactless payments, and allows rapid feature updates via app stores.
What is the biggest restraint to wider adoption?
High total cost of ownership, ranging from USD 1,500 to USD 3,000 upfront plus subscriptions, deters small merchants in price-sensitive markets.