
Market Overview
| Study Period | 2021 - 2031 |
|---|---|
| Forecast Data Period | 2026 - 2031 |
| Base Year Market Size (2025) | USD 38.97 Billion |
| Market Size (2026) | USD 41.08 Billion |
| Market Size (2031) | USD 53.44 Billion |
| Growth Rate (2026 - 2031) | 5.40 % |
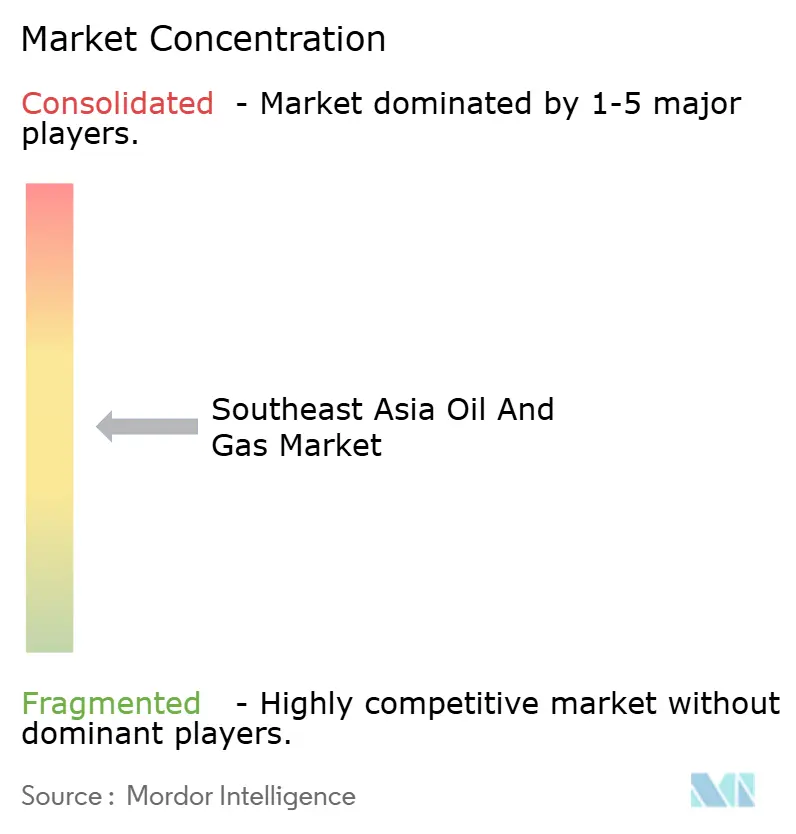
| Market Concentration | Medium |
Major Players *Disclaimer: Major Players sorted in no particular order Image © Mordor Intelligence. Reuse requires attribution under CC BY 4.0. | |
Southeast Asia Oil And Gas Market Analysis by Mordor Intelligence
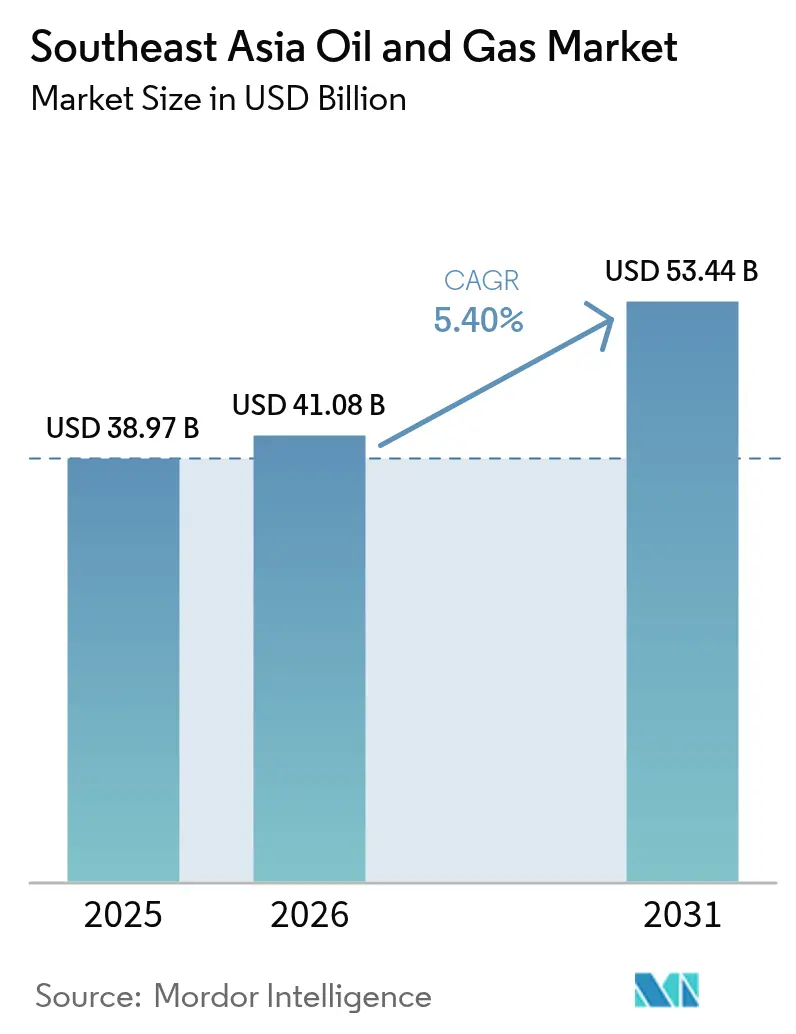
The Southeast Asia Oil And Gas Market size was valued at USD 38.97 billion in 2025 and estimated to grow from USD 41.08 billion in 2026 to reach USD 53.44 billion by 2031, at a CAGR of 5.40% during the forecast period (2026-2031).
Robust government backing for domestic resource development, accelerated post-pandemic capital spending, and rapid sanctioning of deepwater projects underpin this expansion. Elevated LNG infrastructure investment, particularly in floating storage and regasification units, is expanding regional supply options while facilitating coal-to-gas switching in power generation. Carbon capture and storage (CCS) initiatives are unlocking high-CO₂ fields, and digitalization is lowering breakeven costs at mature assets, jointly lengthening field life cycles. Competitive intensity remains moderate because national oil companies (NOCs) protect upstream acreage, yet international partners find opportunities through joint ventures that deliver advanced subsea, drilling, and CCS technologies.
Key Report Takeaways
- By sector, the upstream sector accounted for a 72.15% revenue share in 2025 and is forecast to register a 5.67% CAGR through 2031.
- By location, offshore operations accounted for 60.25% of activity in 2025, while onshore projects trailed but still posted a solid 3.98% CAGR to 2031.
- By service, construction captured a 55.75% share of sector spend in 2025; decommissioning services are expected to expand at the fastest rate, with a 7.74% CAGR through 2031.
- By geography, Indonesia led with 35.22% market share in 2025; the Philippines is expected to post the highest 6.08% CAGR between 2026 and 2031.
- PETRONAS, PT Pertamina, and PTT collectively held a 41% share of 2024 regional upstream output, underscoring NOC dominance in the Southeast Asia oil and gas market.
Note: Market size and forecast figures in this report are generated using Mordor Intelligence’s proprietary estimation framework, updated with the latest available data and insights as of 2026.
Market Trends and Insights
Drivers Impact Analysis of Southeast Asia Oil And Gas Market*
| Driver | (~) % Impact on CAGR Forecast | Geographic Relevance | Impact Timeline |
|---|---|---|---|
| Post-pandemic investment rebound in upstream & LNG supply chains | +1.20% | Indonesia, Malaysia, Thailand core markets | Short term (≤ 2 years) |
| Energy-security push for domestic production & storage | +0.80% | Philippines, Vietnam, Myanmar priority regions | Medium term (2-4 years) |
| Rapid build-out of LNG import terminals & regas capacity | +0.90% | Singapore hub, Philippines, Thailand expansion | Medium term (2-4 years) |
| CCS deployment unlocking high-CO₂ gas fields | +1.10% | Indonesia, Malaysia offshore fields | Long term (≥ 4 years) |
| Biofuel/hydrogen blending pilots in existing gas networks | +0.70% | Singapore, Malaysia regulatory frameworks | Long term (≥ 4 years) |
| Digitalisation enabling marginal field commercialisation | +0.60% | Regional, led by PETRONAS, PTT initiatives | Medium term (2-4 years) |
| Source: Mordor Intelligence | |||
Post-pandemic investment rebound accelerates upstream recovery
Capital spending on Southeast Asian upstream projects increased by 34% in 2024 to USD 28.5 billion, as operators reinstated delayed exploration and development programs. PETRONAS dedicated USD 8.2 billion to Malaysian offshore work, and PT Pertamina allocated USD 4.7 billion for Indonesian expansions, signaling restored confidence in demand growth. Approximately 40% of that is spent on targeted LNG supply chains, with Malaysia’s floating LNG and Indonesia’s onshore liquefaction benefiting most. The rapid outlays clear a project backlog dating from 2020-2022 deferrals and position the region as a swing LNG supplier for wider Asia. Real-time reservoir analytics and subsea tie-backs are compressing payback periods, further stimulating upstream commitments.
Energy-security imperatives drive domestic resource development
Governments are intensifying efforts to cut import dependence. The Philippines initiated a strategic petroleum reserve program in 2024, which provides 30 days of coverage, while Vietnam increased its gas storage capacity by 25%. Thailand’s PTT boosted exploration spending 45% in the Gulf of Thailand to offset mature-field decline, and Myanmar awarded 12 new blocks despite political risks. Revised fiscal terms—higher cost-recovery ceilings and accelerated depreciation—have improved project economics, drawing both local and foreign capital. These actions align with broader ASEAN goals of supply resiliency amid volatile global markets.
LNG-terminal construction transforms regional gas infrastructure
Regasification capacity expanded 18 MTPA in 2024, led by the Philippines’ Bataan facility and Thailand’s Map Ta Phut expansion. Singapore’s Jurong Island processed 14.2 MTPA, cementing its role as Southeast Asia’s trading hub. New import capacity is 85% contracted under long-term deals with QatarEnergy and U.S. suppliers, de-risking utilization. FSRUs supply 60% of new capacity, offering rapid deployment and lower costs compared to onshore terminals. Enhanced gas access facilitates coal-to-gas switching, enabling the meeting of emissions targets without compromising grid reliability.
Biofuel integration pilots transform gas-network utilization
Singapore has approved hydrogen blends of up to 20% in existing gas grids, targeting a commercial rollout in 2026.(1)Petronas Gas is running biogas injection trials on Peninsular Malaysia lines, proving compatibility without major infrastructure modification. Blending leverages sunk pipeline costs while creating demand for renewable molecules, turning networks into low-carbon enablers. Operators earn premium tariffs for low-carbon content and defer large-scale pipeline retirement, aligning shareholder returns with transition goals.
Restraints Impact Analysis of Southeast Asia Oil And Gas Market*
| Restraint | (~) % Impact on CAGR Forecast | Geographic Relevance | Impact Timeline |
|---|---|---|---|
| Declining legacy fields & reserve replacement gap | -0.80% | Indonesia, Malaysia mature basins | Short term (≤ 2 years) |
| Regulatory & fiscal uncertainty across ASEAN members | -0.70% | Regional, varying by jurisdiction | Medium term (2-4 years) |
| ESG-driven capital flight from fossil assets | -0.60% | Regional, affecting international majors | Medium term (2-4 years) |
| South China Sea maritime disputes delaying drilling | -0.50% | Vietnam, Philippines, Malaysia contested areas | Long term (≥ 4 years) |
| Source: Mordor Intelligence | |||
Legacy field decline outpaces reserve-replacement efforts
Indonesian basins recorded 8-12% annual depletion in 2024, exceeding the global 5-7% norm.(2)Malaysia’s aging offshore assets need USD 2.3 billion of maintenance by 2026 to sustain plateau output, straining operator cash flow. The regional reserve-replacement ratio fell to 0.7 times, underscoring the insufficient number of discoveries. Infill drilling and enhanced recovery provide only tactical relief. Operators face steeper lift costs and heightened abandonment liabilities, which intensify capital discipline and can delay frontier exploration.
Regulatory fragmentation creates investment uncertainty
Frequent fiscal-term revisions and tightening local-content rules complicate economic modeling. Indonesia’s 2024 cost-recovery overhaul reduced contractor margins by 8-12%, while Malaysia increased mandated local content to 70% for certain offshore scopes, thereby raising procurement costs. Approval cycles in Thailand lengthened by up to two years. These variances oblige investors to demand higher returns, which can shelve marginal projects. ASEAN harmonization remains aspirational because member states are reluctant to cede resource sovereignty.
*Our forecasts treat driver/restraint impacts as directional, not additive. The impact forecasts reflect baseline growth, mix effects, and variable interactions.
Southeast Asia Oil And Gas Market Segment Analysis
By Sector:
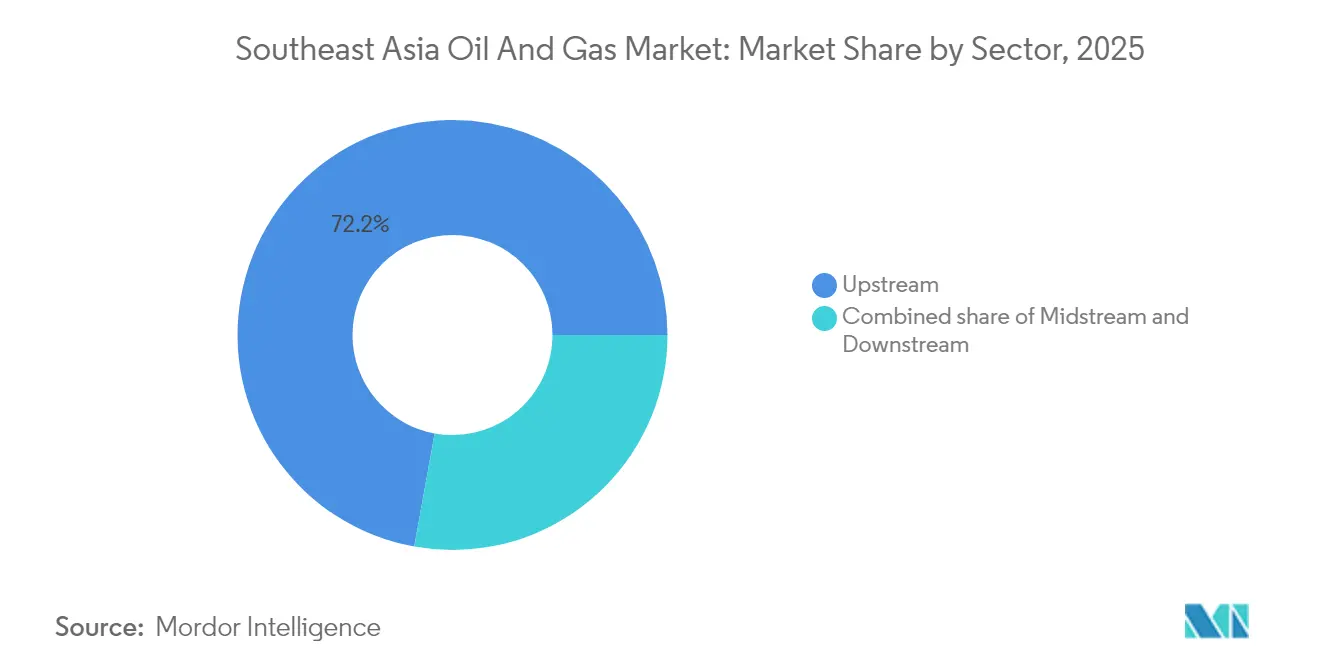
Upstream dominance reflects resource endowmentUpstream activities generated 72.15% of 2025 revenue, and the segment is projected to grow at a rate of 5.67% through 2031, maintaining its largest share of the Southeast Asia oil and gas market. Massive projects such as Indonesia’s Abadi LNG and Malaysia’s Kasawari gas development underpin spending, while midstream networks expand in tandem to evacuate new volumes. Downstream capacity growth lags because stricter emission standards curb new refinery builds.
Digital reservoir models and advanced subsea processing are elevating recovery factors, reinforcing upstream leadership. Governments favor domestic production to enhance energy security, and new fiscal incentives tend to direct capital toward exploration rather than refining upgrades. Enhanced oil recovery and unconventional resource pilots will keep the upstream segment at the forefront of the Southeast Asia oil and gas industry.

By Location:
Offshore operations drive technical innovationOffshore projects accounted for 60.25% of total 2025 expenditure and are expected to grow at a 6.17% CAGR through 2031 as operators expand their operations into regional basins. Water-depth records are continually broken in Malaysia’s Sabah and Sarawak plays, validating commercial viability beyond 1,000 meters. Onshore assets remain important for gas processing and storage, yet lack comparable growth momentum.
Floating production systems account for 45% of new capacity, offering cost flexibility and a reduced environmental footprint. ASEAN regulators are gradually aligning offshore safety and environmental codes, easing cross-border collaboration. The maturity of shallow-water supply chains shortens learning curves for deepwater development, sustaining offshore dominance in the Southeast Asia oil and gas market.
By Service:
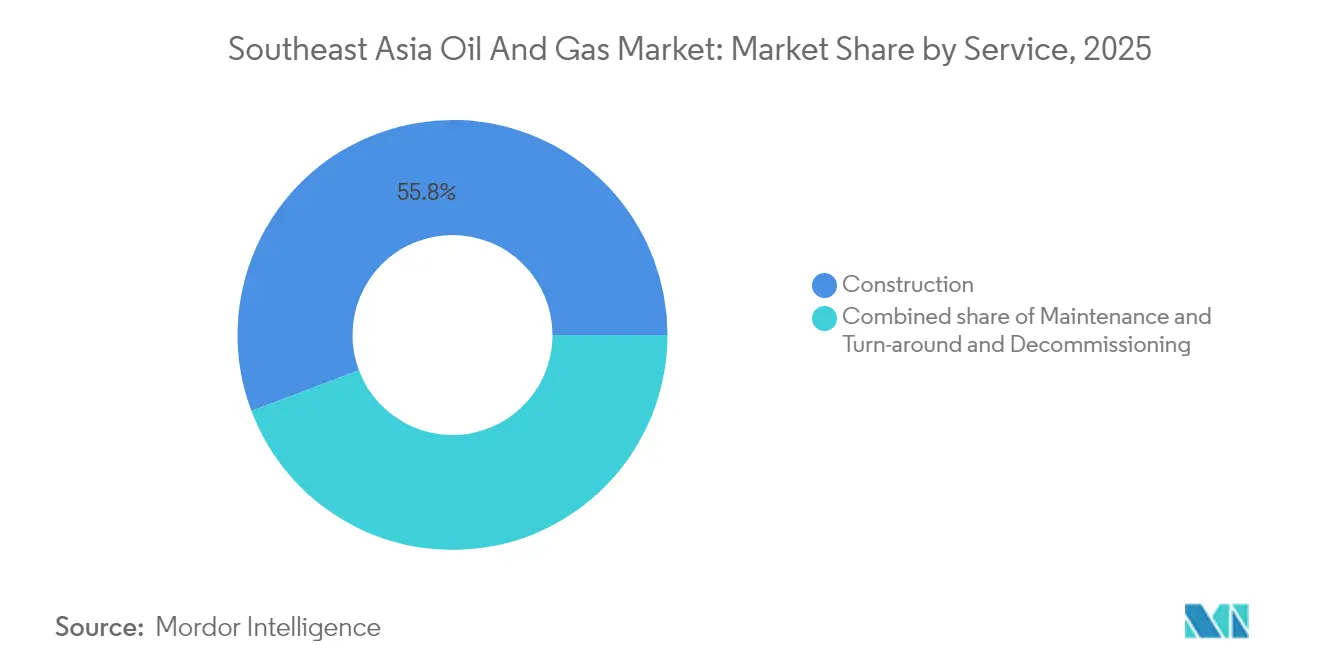
Construction leads while decommissioning acceleratesConstruction services accounted for 55.75% of revenue in 2025, as LNG terminals and offshore platforms proliferated. Decommissioning, although smaller, is projected to advance at a rate of 7.74% annually to 2031, reflecting the strict removal deadlines for end-of-life installations in Malaysia and Indonesia. Maintenance and turnaround retain steady demand by preserving uptime at aging fields.
TechnipFMC secured USD 1.2 billion in Southeast Asian awards in 2024, encompassing subsea umbilicals and LNG modules. Local-content mandates foster consortia pairing global service majors with domestic fabricators, enabling capability transfer. As decommissioning volumes rise, specialized heavy-lift and well-plugging services are expected to flourish, diversifying revenue beyond greenfield build-out in the Southeast Asian oil and gas industry.
Geography Analysis
ASEAN Oil and Gas Market
Indonesia retains market leadership with a 35.22% share in 2025, thanks to extensive offshore reserves, mature onshore facilities, and PT Pertamina’s USD 4.7 billion upstream program, which targets an incremental 180,000 BOPD by 2026. The Abadi LNG project, seeking a final investment decision, will add strategic export capacity upon sanction. Malaysia remains a strong second through PETRONAS’s integrated value chain; the Kasawari field delivered its first gas in 2024 at 1.2 BCFD, reinforcing domestic supply security. Thailand balances declining legacy output with unconventional exploration and an 11 MTPA Map Ta Phut regas expansion that anchors import flexibility.
The Philippines is expected to achieve the highest growth rate of 6.08% through 2031, as Malampaya Phase 2 ramps up and multiple LNG terminals come online to displace coal in power generation. Vietnam’s Nam Con Son developments and industrial demand boost its trajectory, supported by PetroVietnam’s 15% production growth plan. Singapore’s Jurong hub maintains regional supply liquidity by providing storage, blending, and facilitating price discovery. Myanmar’s output remains modest due to political uncertainty; however, the success of the Shwe field drilling demonstrates ongoing international engagement.
Cross-border projects knit markets closer. The Trans-ASEAN Gas Pipeline facilitates volumetric swaps, allowing countries with seasonal surpluses to support their neighbors. Regulators are drafting unified HSE and metering standards to lower transaction friction. Geography thus exerts a dual influence, granting incumbent producers scale benefits while opening up niche growth opportunities for import-reliant economies within the Southeast Asia oil and gas market size calculus.

Regulatory Landscape
Southeast Asia oil and gas regulation continues to reflect country-specific fiscal, licensing, and local-content regimes, with additional coordination around energy security and decarbonization. In June 2026, Indonesia's Ministry of Energy and Mineral Resources issued Permen ESDM No. 7 Tahun 2026, which sets business-activity standards for risk-based business licensing across the energy sector, reinforcing the shift toward standardized permitting under Indonesia's risk-based framework.
Policy reform is also active in other core jurisdictions. In April 2026, Vietnam issued Resolution No. 81/NQ-CP outlining five policy groups to support revisions to the national Law on Petroleum, indicating ongoing legislative modernization while final adoption remains subject to the National Assembly process. At the regional level, ASEAN Centre for Energy adoption of APAEC 2026-2030 (January 2026) provides a common reference for member-state planning, while Malaysia maintains its petroleum governance structure under the Petroleum Development Act 1974, with PETRONAS (via Malaysia Petroleum Management) acting as resource custodian and the primary interface for petroleum arrangement contractors.
Competitive Landscape
National champions PETRONAS, PT Pertamina, and PTT dominate upstream acreage due to state mandates and preferential access, jointly supplying roughly 41% of the 2024 regional output. International oil companies, such as Shell, ExxonMobil, and TotalEnergies, pursue deepwater or technologically complex projects where their engineering expertise justifies participation fees. Sovereign resource policies limit majority foreign ownership, channeling collaboration into joint ventures that share risk and transfer knowledge.
Digital transformation amplifies competitive gaps. PETRONAS’s AI reservoir-optimization platform increased average well productivity by 12% across more than 200 wells, and PTT’s predictive maintenance reduced unplanned downtime by 18%. Service majors TechnipFMC, Saipem, and Samsung Engineering win large EPC packages by pairing their subsea credentials with strong local content compliance. White-space competition is growing in CCS deployment, decommissioning, and renewable-gas integration fields, where first-mover technical proficiency can secure long-term service revenues.
Capital markets also shape rivalry. ESG-aligned Western investors retreat, whereas Middle Eastern and Asian funds acquire divested assets, often negotiating favorable fiscal terms from host governments keen to sustain output. As a result, regional cost structures stabilize, ensuring a moderate level of concentration in the Southeast Asian oil and gas market.
Southeast Asia Oil And Gas Industry Leaders
-
TechnipFMC
-
Saipem SpA
-
PT. JGC Indonesia
-
Bechtel Corporation
-
Fluor Corporation
- *Disclaimer: Major Players sorted in no particular order
Southeast Asia Oil And Gas Market Companies Covered in this Report
- PETRONAS
- PT Pertamina Persero
- PTT Exploration & Production PLC
- ExxonMobil Corp.
- Shell PLC
- Chevron Corp.
- TotalEnergies SE
- Harbour Energy PLC
- ConocoPhillips
- BP PLC
- Sinopec Engineering Group
- TechnipFMC PLC
- Saipem SpA
- Bechtel Corp.
- Fluor Corp.
- John Wood Group PLC
- Petrofac Ltd.
- Samsung Engineering Co. Ltd.
- PT Indika Energy Tbk
- PT Rekayasa Industri
- PT Meindo Elang Indah
Market Opportunities and Future Outlook
Deepwater gas and associated floating production systems are emerging as the most execution-led whitespace as mature shallow-water and onshore assets decline and operators look for scalable supply tied to LNG infrastructure. The July 2026 EPCI award to a Saipem and PT Tripatra Engineers and Constructors joint venture for a newbuild FPSO for Eni and PETRONAS's Kutei North Hub development offshore East Kalimantan points to continued capital-intensive offshore development and extends the addressable market for subsea, FPSO topsides, fabrication, and integration services.
Onshore and nearshore gas development and gas network build-out create additional opportunities, particularly where permitting and project structuring enable smaller, repeatable scopes. PC Ketapang II reached a final investment decision for the Bukit Panjang gas project in East Java (April 2026) and started construction in June 2026, illustrating a pathway for domestic gas supply additions that supports demand from power and industry without relying on export-scale LNG. Asset and infrastructure pooling through new integrated platforms, such as the June 2026 launch of Searah (Eni and PETRONAS) combining producing and development assets across Indonesia and Malaysia and backed by a revolving credit facility for a multi-year investment program, also creates more bankable counterparties for EPC, brownfield tie-backs, and debottlenecking work across established hubs.
Recent Industry Developments in Southeast Asia Oil And Gas Market
- July 2026: Saipem, in a joint venture with PT Tripatra Engineers and Constructors, was awarded an EPCI contract for a newbuild FPSO for Eni and PETRONAS's Kutei North Hub gas project offshore East Kalimantan, Indonesia. The approximately USD 2 billion award reinforces the role of FPSO-led deepwater developments in Indonesia and expands multi-year demand for fabrication, integration, and offshore installation capacity.
- November 2025: TechnipFMC won a substantial iEPCI contract from Eni for the deepwater Maha project offshore Indonesia. The award, which includes Subsea 2.0 technology, highlights operator preference for standardized subsea architectures and integrated delivery models to improve schedule and cost control in complex offshore developments.
- August 2025: INPEX Masela awarded a FEED contract to a consortium including JGC Indonesia and subsidiaries of Technip Energies for the Abadi LNG project in Indonesia, covering the onshore LNG plant and the offshore production facility (FPSO). Advancing FEED work supports progression toward final investment decisions and expands the regional pipeline of LNG-linked engineering and project management scopes.
Southeast Asia Oil And Gas Market Report Scope and Research Methodology
Market Definition and Coverage
For this methodology, the Southeast Asia oil and gas market is sized as the revenues generated from upstream, midstream, and downstream activities across the region, including related onshore and offshore operations and service work tied to assets and projects.
Scope exclusions (for clarity): We do not count purely financial trading gains or unrelated power and utility retail revenues that are not directly linked to oil and gas operations in Southeast Asia.
Segments Covered in This Report
- By Sector
- Upstream
- Midstream
- Downstream
- By Location
- Onshore
- Offshore
- By Service
- Construction
- Maintenance and Turn-around
- Decommissioning
- By Geography
- Indonesia
- Malaysia
- Thailand
- Vietnam
- Philippines
- Singapore
- Myanmar
- Rest of Southeast Asia
Data Sources, Market Sizing, and Validation
Desk Research
Desk research is used to set the factual backbone for the model, before assumptions are stress-tested in interviews. We referred to public datasets and official publications such as IEA energy statistics, OPEC annual reports, ASEAN energy cooperation publications, and national government energy and petroleum regulators for country level supply, demand, and infrastructure signals.
To make the revenue conversion practical, we also used sources such as customs and port statistics, company annual reports and investor presentations, and credible industry press for project timelines, capacity additions, and asset utilization context. Where needed, paid subscription database inputs for company financials and shipment level import export views were used to fill gaps on smaller operators and cross border flows. The desk sources mentioned are illustrative only, and many other public references were also used to collect, cross-check, and clarify data points.
Primary Interviews and Surveys
Primary calls and surveys were done with a mix of operators, EPC and service contractors, midstream and LNG infrastructure participants, and downstream and refining stakeholders across key Southeast Asian countries. The respondent input focused on what is actually being executed on the ground, including award pace, utilization, typical commercial terms, and how pricing is being reset for ongoing maintenance versus new builds.
Distribution of primary research fieldwork respondents
| Company type | Respondent position |
|---|---|
| Top tier: 33% | CXOs: 20% |
| Mid tier: 46% | Functional/Unit leaders: 20% |
| Smaller Players: 21% | Managers: 60% |
Market-Sizing & Forecasting
Sizing starts with a top-down build where regional oil and gas activity is reconstructed using country level production and consumption trends, midstream throughput and LNG movements, and downstream capacity and utilization. Those activity indicators are then translated into revenue using a set of price and cost markers that were checked in interviews and aligned to the study scope.
To keep the totals grounded, we corroborated the output with selective bottom-up approximations such as sampled project and service award values, typical maintenance and turnaround spending per facility class, and a few supplier roll ups where public financial disclosure made it feasible. Key inputs that shaped the model include upstream capex direction, offshore versus onshore activity mix, pipeline and LNG terminal additions, refinery runs and utilization, and average service intensity by construction versus maintenance and turnaround.
For forecasting, scenario analysis was used so that oil price assumptions, sanctioning pace, and schedule slippage risk could be varied, and then re-validated with expert views for a realistic central case. When a country or sub-activity had limited disclosure, gap handling was done by using proxy indicators like capacity, utilization, and known project backlogs, and then adjusting the result based on interview feedback.
Data Validation & Update Cycle
Outputs are checked against independent signals, and the numbers are pushed through a few rounds of variance review before sign-off. We compare implied revenues against project award momentum, facility utilization and throughput trends, and what operators and contractors describe as current budget envelopes, and then investigate outliers until the driver is understood.
Reports are refreshed annually, and interim updates are triggered when material events occur, such as major project sanctions, cancellations, or sharp price swings that change spending plans. Before final delivery, a last pass is completed so the published tables reflect the latest data points and consistent assumptions across countries and activities.
Mordor Intelligence's Southeast Asia Oil and Gas Market Size Versus Other Published Estimates
Published market sizes for Southeast Asia oil and gas can look far apart because the scope line is not drawn the same way, and because the revenue conversion logic is handled differently. In this sector, the total changes quickly when one estimate mixes full downstream product sales with infrastructure and services, or when another estimate treats end-use fuel spending as the market.
The biggest gap drivers usually come from what is counted as market revenue, whether upstream, midstream, and downstream are all included, and how onshore versus offshore activity is weighted year to year. Differences also show up when some sources apply aggressive price escalation to all barrels and cubic meters, or when currency timing and refresh cadence are not aligned to the same base year.
Benchmark comparison
| Source | Market Size | Gaps in Research Methodology |
|---|---|---|
| Mordor Intelligence | USD 38.97 B (2025) | |
| Regional Consultancy A | USD 300.00 B (2024) | This figure appears to reflect a much broader spend pool that can fold in downstream product sales and end-use fuel consumption value, which inflates totals versus an activity and operations revenue view. |
| Industry Publisher B | USD 187.40 B (2026) | This number is downstream-only and is heavily driven by refining and petrochemical product scope, so it is not directly comparable to a full oil and gas value chain total and can swing with product price assumptions. |
The table shows that scope selection explains most of the spread, followed by how revenue is translated from barrels, throughput, and capacity into USD at different timing points. Keeping downstream product sales separated from upstream and midstream activity, and validating utilization and project pace through interviews, are the practical checks applied in the model, which then get reflected in the final number reported by Mordor Intelligence.
Key Questions Answered in the Report
How large is the Southeast Asia oil and gas market?
The Southeast Asia oil and gas market size is valued at about USD 41.08 billion in 2026 and is on track to top USD 53.44 billion by 2031, growing at 5.40% annually.
Which segment shows the fastest growth through 2031?
Decommissioning services are projected to advance at 7.74% CAGR as regulators enforce platform-removal deadlines across Malaysia and Indonesia.
Why is the Philippines considered the fastest-growing geography?
New LNG import terminals and the Malampaya field expansion lift the Philippines to a 6.08% CAGR, outpacing other ASEAN members.
How are CCS projects influencing regional supply?
Commercial CCS at fields such as Kasawari captures CO₂ and enables development of high-CO₂ reservoirs, unlocking reserves previously uneconomic under conventional processing.
What role does digitalization play in field economics?
AI-driven reservoir optimization and predictive maintenance raise production up to 15% and cut development costs by about 25%, improving marginal-field viability.
Which companies dominate regional output?
PETRONAS, PT Pertamina, and PTT together supply about 41% of Southeast Asian output, underscoring strong but not monopolistic NOC control.