
Market Overview
| Study Period | 2021 - 2031 |
|---|---|
| Forecast Data Period | 2026 - 2031 |
| Base Year Market Size (2025) | USD 6.15 Billion |
| Market Size (2026) | USD 6.44 Billion |
| Market Size (2031) | USD 8.1 Billion |
| Growth Rate (2026 - 2031) | 4.70 % |
| Market Concentration | Medium |
Major Players *Disclaimer: Major Players sorted in no particular order Image © Mordor Intelligence. Reuse requires attribution under CC BY 4.0. | |
Southeast Asia Oil And Gas Downstream Market Analysis by Mordor Intelligence
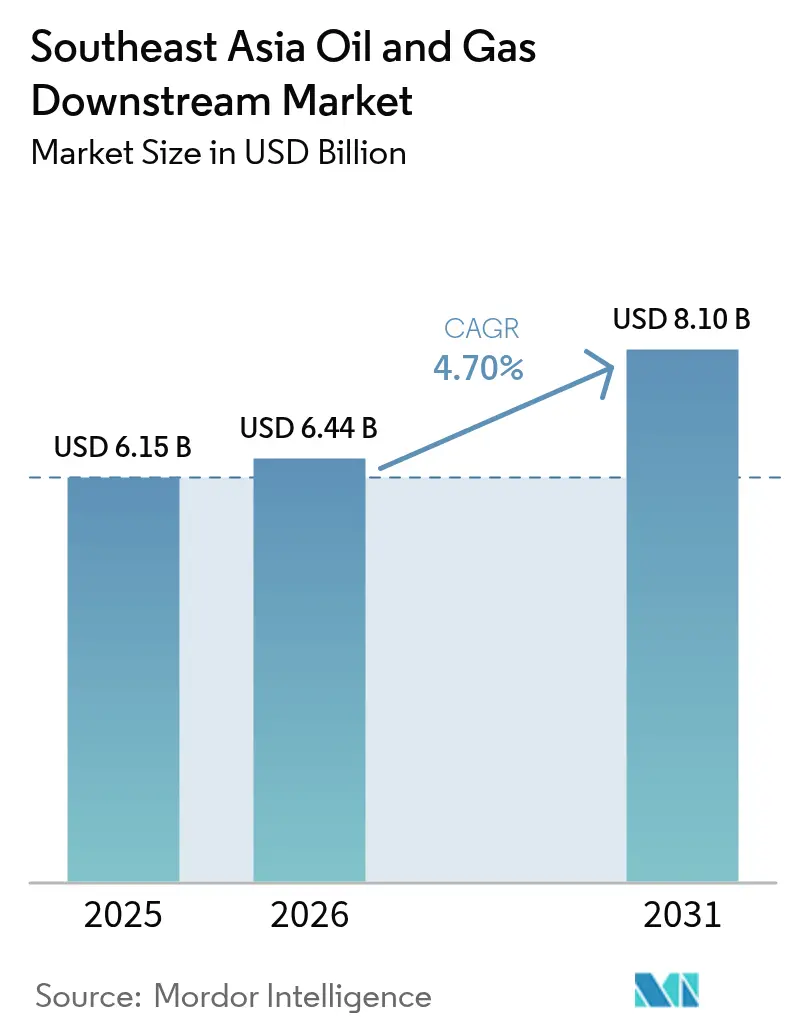
The Southeast Asia Oil And Gas Downstream Market size is expected to grow from USD 6.15 billion in 2025 to USD 6.44 billion in 2026 and is forecast to reach USD 8.1 billion by 2031 at 4.7% CAGR over 2026-2031.
Accelerated transitions from stand-alone refining toward integrated petrochemical platforms, stronger post-COVID-19 aviation fuel demand, and stricter marine fuel regulations position the Southeast Asian oil and gas downstream market for resilient expansion despite feedstock price volatility. Competitive differentials now hinge on carbon-pricing readiness, IMO 2020-compliant bunker production, and Euro-V fuel upgrades, each of which elevates capital-spending requirements but also unlocks premium margin pools. Sustained integration with digital-control architectures and AI-enabled predictive maintenance reduces unplanned downtime by up to 12%, enabling refineries to adjust product slates in real-time, which supports profitability throughout demand cycles.[1] Regional policies—especially Singapore’s rising carbon tax and Indonesia’s forthcoming emissions levy—provide monetary incentives for carbon-capture investments that future-proof asset values within the broader Southeast Asian oil and gas downstream market.
Key Report Takeaways
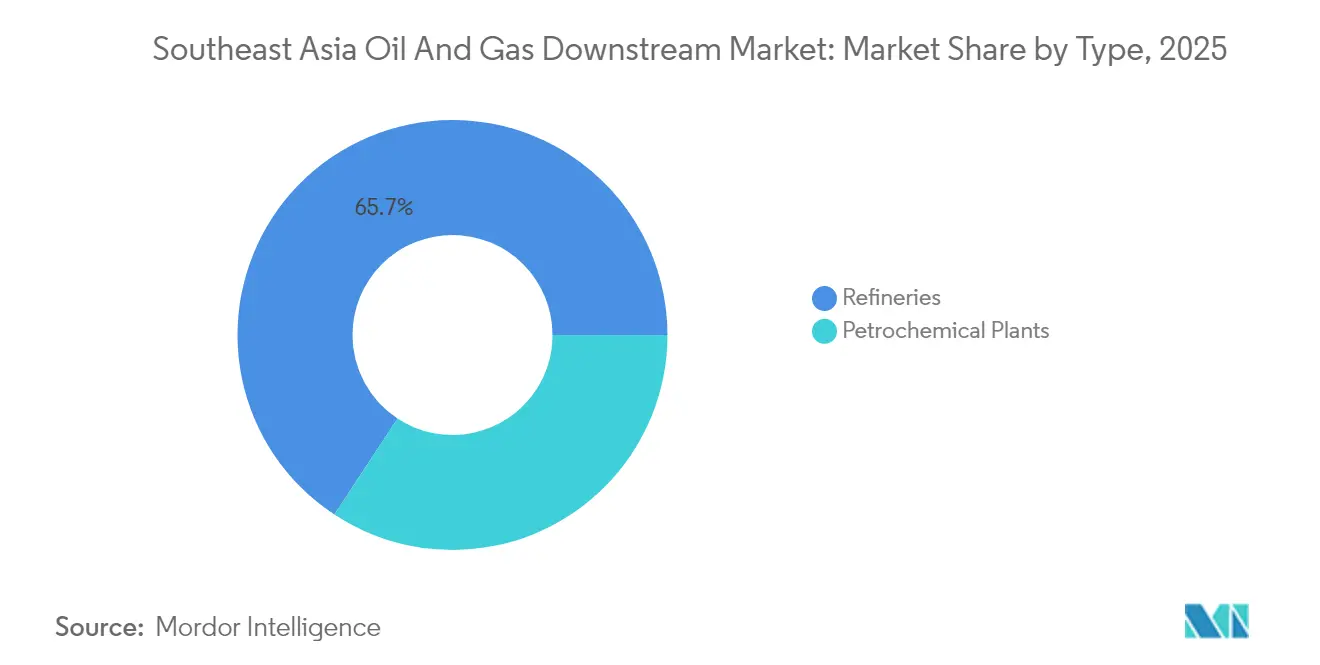
- By type, refineries held 65.74% of the Southeast Asia oil and gas downstream market share in 2025; petrochemical plants posted the fastest growth rate of 6.02% through 2031.
- By product type, refined petroleum products accounted for 61.12% of the Southeast Asia oil and gas downstream market size in 2025, while petrochemicals are projected to advance at a 6.78% CAGR to 2031.
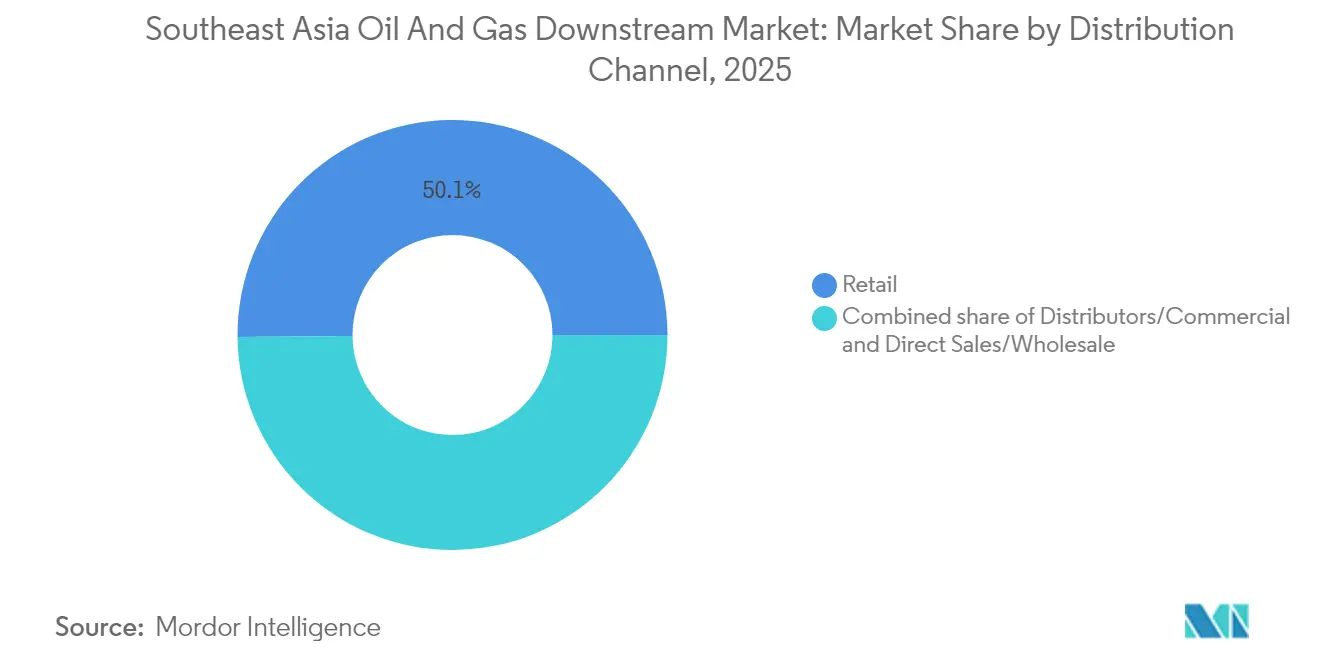
- By distribution channel, retail captured 50.14% of the Southeast Asia oil and gas downstream market size in 2025; distributors and commercial channels are forecast to expand at a 5.63% CAGR during 2026-2031.
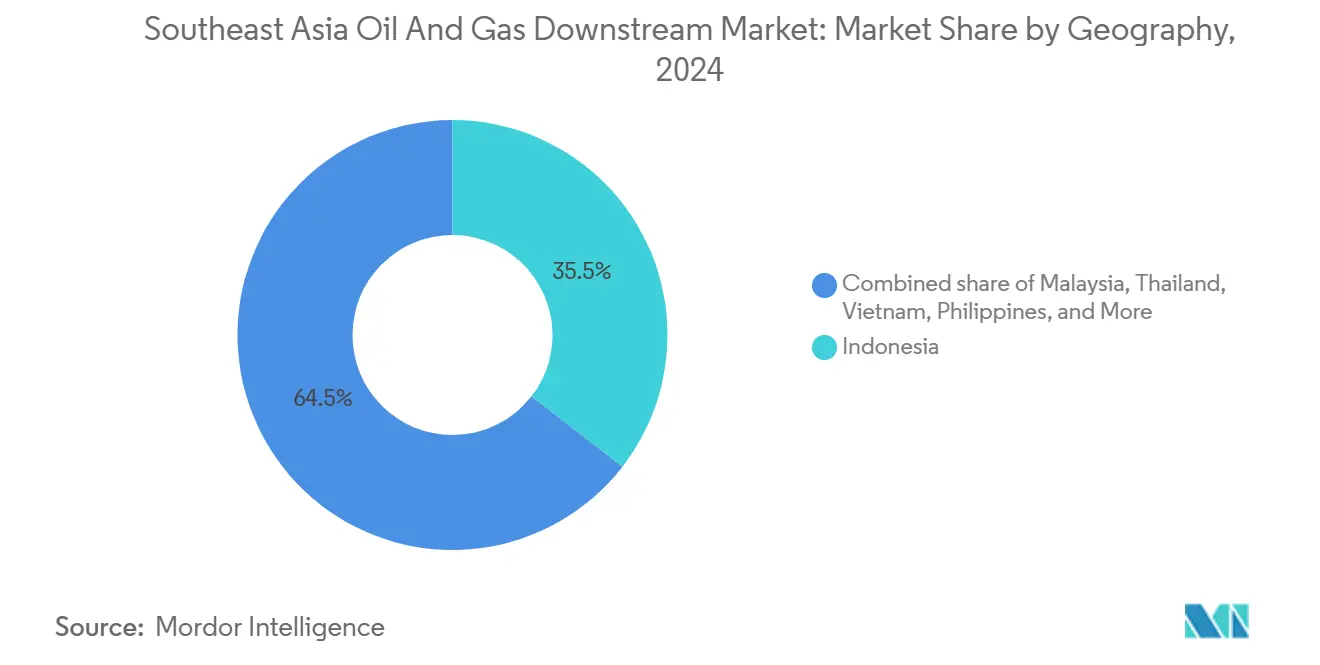
- By geography, Indonesia commanded 35.08% of the Southeast Asia oil and gas downstream market size in 2025, whereas the Philippines delivered the fastest growth rate of 5.79% over the outlook period.
Note: Market size and forecast figures in this report are generated using Mordor Intelligence’s proprietary estimation framework, updated with the latest available data and insights as of 2026.
Market Trends and Insights
Drivers Impact Analysis of Southeast Asia Oil And Gas Downstream Market*
| Driver | (~) % Impact on CAGR Forecast | Geographic Relevance | Impact Timeline |
|---|---|---|---|
| Rapid recovery of regional jet-fuel demand post-COVID | +1.0% | Singapore, Malaysia, Thailand aviation hubs | Short term (≤ 2 years) |
| Rising regional integration of carbon-pricing schemes | +0.7% | ASEAN core markets, Singapore leadership | Medium term (2-4 years) |
| Expansion of IMO 2020-compliant bunkering hubs | +0.8% | Singapore, Malaysia, Indonesia ports | Short term (≤ 2 years) |
| Mainstream fuel-quality upgrades (Euro-V standards) | +0.6% | Indonesia, Thailand, Vietnam domestic markets | Medium term (2-4 years) |
| Accelerated petrochemical integration at existing refineries | +0.9% | Malaysia, Indonesia, Thailand integrated complexes | Long term (≥ 4 years) |
| AI-driven predictive maintenance reducing OPEX | +0.4% | Regional, early adoption in Singapore, Malaysia | Short term (≤ 2 years) |
| Source: Mordor Intelligence | |||
Rapid Recovery of Regional Jet-Fuel Demand Post-COVID
Aviation traffic across ASEAN rebounded sharply, pushing 2024 jet-fuel liftings at Singapore Changi to 8.2 million t, 15% above the 2019 baseline.[2] Parallel upticks at Kuala Lumpur International and Suvarnabhumi airports were sufficient to justify refinery configuration shifts toward higher jet-fuel yields. Airlines such as AirAsia and Singapore Airlines restored fleet utilization while expanding secondary-city routes, which require multi-node fuel logistics and create stable pull-through for integrated supply contracts. Refineries equipped with advanced hydro-treaters capture premium spreads on certified aviation fuel, thereby reinforcing the margin resilience of the Southeast Asia oil and gas downstream market. Demand visibility encourages capital outlays for distillate-selective units that can toggle between jet fuel and diesel depending on seasonal crack spreads. Predictable volume signals also help downstream operators negotiate long-term offtake agreements that underpin balance-sheet planning across new integration projects.
Rising Regional Integration of Carbon-Pricing Schemes
Singapore lifted its carbon levy to SGD 25 t-CO₂ in 2024 and will incrementally raise it to SGD 80 by 2030, a move mirrored by Thailand’s pilot trading system and Indonesia’s 2025 tax framework.[3] Differentiated CO₂ costs prompt operators to deploy flare-gas recovery, heat-integration retrofits, and post-combustion capture, thereby reducing unit emissions and creating tradable credits that offset compliance expenses. Financial centers in Kuala Lumpur and Singapore facilitate cross-border credit markets, enabling portfolio optimization for multi-country operators. Plants that couple carbon capture with hydrogen-ready furnaces position themselves for the looming scrutiny of global customers on Scope 3 emissions. Early adopters already monetize lower-carbon diesel and bunker blends through premium contracts with multinational logistics firms seeking verifiable emission reductions. Collectively, carbon-pricing harmonization supplies both carrot and stick incentives that accelerate technology uptake within the Southeast Asia oil and gas downstream market.
Expansion of IMO 2020-Compliant Bunkering Hubs
Sales of 0.5%-sulfur marine fuels at Singapore surpassed 47.8 million t in 2024, cementing the city-state’s global leadership. Neighboring hubs, Port Klang and Batam, added hydrotreating and blending units, increasing compliant bunker output by 40% since 2020. Strategic geography along Asia-Europe lanes guarantees throughput, while port authorities streamline quality-assurance protocols, reinforcing buyer confidence. The bunker boom spurs investment in co-located storage, shore power, and alternative fuels such as methanol and ammonia, creating ancillary revenue streams. Shipowners locking in long-term supply contracts drive predictable demand, allowing refiners to hedge against softening gasoline margins. Competitive dynamics, therefore, favor multi-site networks capable of synchronized product allocation, a trend that amplifies the regional importance of the Southeast Asia oil and gas downstream market.
Accelerated Petrochemical Integration at Existing Refineries
Malaysia’s Pengerang Integrated Complex illustrates the economic rationale: shared utilities and unified feedstock pools increase the overall return on invested capital by 250 basis points compared to stand-alone assets. Indonesia’s Cilacap upgrade adds ethylene and propylene streams that satisfy domestic polymer demand and open export channels to China. Integration mitigates fuel-demand cyclicality, reallocating naphtha and atmospheric residue toward higher-value chemical outputs during periods of compressed transport-fuel cracks. Process-control algorithms adjust cutpoints in real-time, maximizing aromatics or light olefins as market spreads dictate, which underpins sustained earnings even in downturns. The approach is expected to diffuse rapidly across the Southeast Asian oil and gas downstream market, with Thailand’s Map Ta Phut complex already executing specialty-chemical expansions aimed at producing electronics-grade materials. Long-cycle integration thus becomes a cornerstone strategy for maintaining competitive relevance throughout the decade of the energy transition.
Restraints Impact Analysis of Southeast Asia Oil And Gas Downstream Market*
| Restraint | (~) % Impact on CAGR Forecast | Geographic Relevance | Impact Timeline |
|---|---|---|---|
| High capital cost escalations amid EPC supply-chain crunch | -0.8% | Regional, acute in complex projects | Short term (≤ 2 years) |
| Growing EV penetration suppressing gasoline demand | -0.6% | Thailand, Indonesia urban centers | Medium term (2-4 years) |
| Stringent green-bond taxonomy limiting fossil-fuel financing | -0.5% | Singapore, Malaysia financial centers | Medium term (2-4 years) |
| Skilled-labour shortages for complex turnaround projects | -0.4% | Regional, concentrated in specialized skills | Long term (≥ 4 years) |
| Source: Mordor Intelligence | |||
High Capital-Cost Escalations Amid EPC Supply-Chain Crunch
Steel and specialty-alloy prices surged 40% between 2022 and 2024, while delivery lead times for large-bore reactors stretched to 24 months, inflating outlays on hydrocrackers and ethylene crackers. Samsung Engineering and Hyundai Engineering reported procurement delays on Pengerang and Balikpapan units, forcing schedule re-baselines and eroding project net present values. Financing structures now incorporate larger contingency cushions and index-linked escalation clauses, adding complexity to credit-committee approvals. Operators with robust supplier alliances and modular construction plans partially offset cost blowouts, but smaller players confront prohibitive entry barriers. Persistent bottlenecks threaten to defer capacity-addition timelines, softening near-term supply growth in the Southeast Asia oil and gas downstream market.
Growing EV Penetration Suppressing Gasoline Demand
Thailand’s 2024 EV penetration reached 9% of new-vehicle sales, supported by tax holidays and charging infrastructure subsidies. Indonesia’s nickel-based battery value chain is accelerating local EV manufacturing, projecting a potential 15-20% reduction in gasoline demand in Jakarta by 2030. Retail forecourts thus confront traffic attrition, pressuring throughput and ancillary convenience-store sales. Refiners counter by tilting toward jet kerosene, marine gas oil, and petrochemical feedstocks less exposed to electrification. Although internal-combustion fleets are expected to dominate in the medium term, consumption elasticity signals a long-term plateauing of gasoline output, nudging strategic capital expenditures toward diversified product slates across the Southeast Asian oil and gas downstream market.
*Our forecasts treat driver/restraint impacts as directional, not additive. The impact forecasts reflect baseline growth, mix effects, and variable interactions.
Southeast Asia Oil And Gas Downstream Market Segment Analysis
By Type:
Refinery Scale Anchors, Petrochemical Plants Propel GrowthRefineries commanded 65.74% of 2025 revenue, but petrochemical units are expected to deliver the Southeast Asia oil and gas downstream market’s fastest 6.02% CAGR through 2031. The refinery cohort leverages economies of scale, coastal logistics, and crude-flex configurations that can shift from sweet to sour slates as price spreads fluctuate. Singapore’s integrated cluster alone processes 1.5 million bpd and feeds export pipelines across ASEAN. Nevertheless, the sustained risk of gasoline demand propels operators toward steam-cracker add-ons and aromatics extraction, which monetizes competitive naphtha economics.
Petrochemical integration increases the overall margin per barrel by converting incremental naphtha into ethylene-based derivative chains. Malaysia’s RAPID complex embodies this shift, deploying unified off-gas recovery and shared cogeneration to lower unit costs. Thailand’s Map Ta Phut expansion packages niche elastomers and specialty olefins for automotive component suppliers, reinforcing non-fuel value capture. The approach minimises exposure to motor-fuel cycling, future-proofing asset bases against electrification and decarbonization headwinds across the Southeast Asia oil and gas downstream market.

By Product Type:
Petrochemicals Outpace Refined FuelsRefined petroleum products retained a 61.12% share in 2025, with exports of gasoline, diesel, and compliant bunker fuel through well-established routes to Australia and Northeast Asia. However, petrochemicals are expected to lead growth at a 6.78% CAGR, supported by escalating demand for polymers used in packaging, construction, and durable goods manufacturing. Yields of ethylene, propylene, and aromatics from integrated sites underpin ASEAN’s aspiration to displace imports.
Lubricants occupy a premium niche, with base oil and additive blending drawing on Group III feedstocks produced at regional hydro-processing facilities. Branded lube marketers pursue original-equipment-manufacturer approvals to secure aftermarket loyalty. The evolving product mix delivers resilience, as higher-value chemicals and specialty lubricants shield margins when transport fuel prices crack—a scenario anticipated during widespread EV adoption—fortifying the competitiveness of the Southeast Asia oil and gas downstream market.
By Distribution Channel:
Retail Dominates, Commercial Flows AccelerateRetail fuels remained the largest channel, accounting for 50.14% in 2025, underpinned by over 40,000 service stations across Indonesia, Thailand, and Malaysia. Loyalty apps and convenience-store formats enhance non-fuel revenue streams, partially insulating forecourt economics from erosion in gallonage. Meanwhile, distributor/commercial channels show a 5.63% CAGR, driven by aviation-fuel uplift, marine-fuel sales, and bulk diesel contracts serving independent power producers.
Digital order-management platforms enable bulk customers to schedule deliveries and obtain sulfur-content certificates, thereby increasing service stickiness. Direct sales/wholesale caters to industrial clusters that need customized fuel blends, such as low-pour-point marine gas oil for refrigerated cargo. Commercial-channel sophistication enhances supply-chain transparency and mitigates inventory holding costs, thereby reinforcing demand capture in the Southeast Asia oil and gas downstream market.
Geography Analysis
Indonesia Oil and Gas Downstream Market
Indonesia led with a 35.08% share in 2025, processing roughly 1.6 million bpd across Cilacap, Balikpapan, and Dumai, and capturing Euro-V premium spreads through recent hydrocracker retrofits. Pertamina's USD 15 billion petrochemical outlay aims to close a domestic polymer deficit projected at 3 million t by 2027. Regulatory frameworks grant import-tariff relief on cracker equipment, accelerating execution schedules.
Malaysia and Thailand Oil and Gas Downstream Market
Malaysia follows, anchored by PETRONAS's Pengerang Integrated Complex, which pairs 300,000 bpd of refining with 3.3 million t of olefins and aromatics capacity. Carbon-capture pilots at the site reduce Scope 1 emissions by 15%, generating voluntary credits that offset Singapore's carbon-levy exposure for inter-company shipments. Thailand sits third, leveraging Map Ta Phut's petrochemical depth and PTT's nationwide retail grid; the country also scales bunkering infrastructure at Laem Chabang, courting vessel traffic diverted from tighter Singapore berthing slots.
ASEAN Oil and Gas Downstream Market
The Philippines posts the fastest 5.79% CAGR, courtesy of Petron's modernization efforts that add Euro-V capability and polypropylene lines, while meeting surging transport fuel demand linked to infrastructure build programs. Vietnam advances its refining self-sufficiency through Nghi Son Phase 2, securing feedstock from Middle East supply contracts and boosting aromatics exports to China. Singapore, although physically constrained, maintains its hub status through sophisticated derivatives trading and integrated storage and blending assets that balance regional supply and demand. Myanmar and Brunei contribute niche capacities and exploit cross-border swaps to mitigate domestic scale limitations, rounding out geographic diversity within the Southeast Asia oil and gas downstream market.
Regulatory Landscape
Downstream regulation across Southeast Asia is increasingly shaped by fuel-quality and emissions compliance, particularly around Euro-V grade upgrades and IMO 2020 marine-fuel sulfur limits that drive hydrotreating and blending investments in major hubs such as Singapore. Carbon-pricing policy also affects operators with cross-border footprints, with Singapore lifting its carbon levy to SGD 25 per t-CO2 in 2024 and the stated pathway to SGD 80 by 2030, which raises the value of efficiency retrofits and carbon-capture readiness in refining and petrochemicals.
Country-level frameworks remain central to permitting and compliance. In Indonesia, downstream activities continue to reference Government Regulation No. 36 of 2004 (as amended), while the move toward a risk-based licensing regime following Government Regulation No. 28 of 2025 increases the importance of monitoring implementing rules that affect refineries, terminals, and retail networks. Fuel specifications are also set through Ministerial and Director General of Oil and Gas decisions, including the Director General decision covering RON 98 gasoline specifications. In the Philippines, the Department of Energy administers downstream standards under the Downstream Oil Industry Deregulation Act of 1998 (Republic Act 8479), including facility and pipeline standards aligned with Philippine National Standards (PNS). Timor-Leste vests downstream inspection and regulatory authority in the Autoridade Nacional do Petroleo under Decree-Law no. 01/2012.
Competitive Landscape
Competitive Landscape
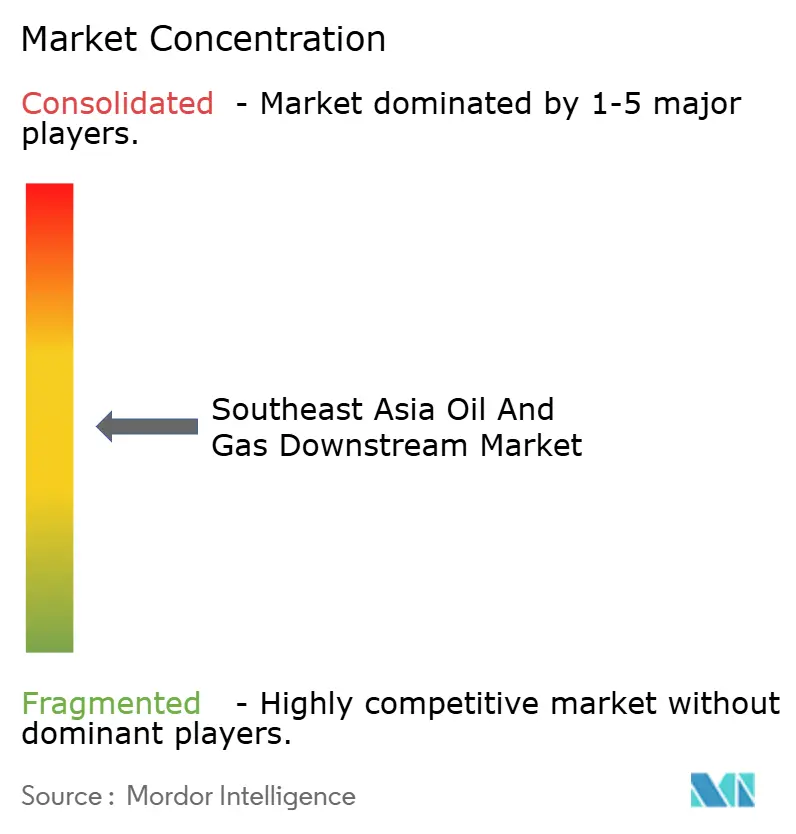
The market displays moderate concentration, with national champions PETRONAS, Pertamina, and PTT, along with ExxonMobil, Shell, and TotalEnergies, securing roughly 65% of the aggregate regional capacity, leaving a competitive fringe of mid-tier refiners and specialty chemical players. Integrated state firms wield regulatory latitude and domestic distribution power, while IOCs inject deep process know-how and global marketing muscle. Hybrid joint ventures—such as PTT-Aramco at Map Ta Phut—combine crude supply security with petrochemical technology, thereby spreading risk across the entire value chain.
Digital transformation proves decisive. Thai Oil’s AI-driven control loops trim energy intensity by 5%, while Shell’s Singapore complex leverages machine-vision drones to map corrosion hot-spots, reducing inspection downtime. Early leaders in emissions capture, such as PETRONAS at Pengerang Phase 2, negotiate premium contracts with consumer electronics brands requiring low-carbon plastics. Commercial agility likewise matters: Pavilion Energy’s freight-optimization algorithms match bunker-fuel dispatches with vessel ETAs, slashing demurrage costs.
Competitive tension escalates as EV uptake pressures gasoline margins. Forward-looking refiners are pivoting toward aviation fuel, marine distillates, and chemical derivatives that are less vulnerable to electrification. Simultaneously, renewable-fuel entrants—including Neste’s former Singapore assets now under Shell—challenge incumbents on carbon intensity metrics. Success increasingly depends on orchestrating feedstock flexibility, digital efficiency, and portfolio diversity to secure long-term viability across the Southeast Asian oil and gas downstream market.
Southeast Asia Oil And Gas Downstream Industry Leaders
-
PTT Public Company Ltd
-
PT Pertamina
-
Shell plc
-
Petroliam Nasional Berhad
-
Exxon Mobil Corp
- *Disclaimer: Major Players sorted in no particular order
Southeast Asia Oil And Gas Downstream Market Companies Covered in this Report
- Shell plc
- PTT Public Company Ltd
- PT Pertamina
- Petroliam Nasional Berhad (PETRONAS)
- Exxon Mobil Corp
- Vietnam Oil & Gas Group (PetroVietnam)
- Perusahaan Gas Negara Tbk
- Chevron Corporation
- TotalEnergies SE
- SK Energy
- Hyundai Engineering Co.
- Bangchak Corp
- IRPC Public Co.
- Hengyi Industries Sdn Bhd
- Pilipinas Shell Petroleum Corp
- Thai Oil Public Co.
- PT Chandra Asri Petrochemical Tbk
- Petron Corp
- Brunei Shell Petroleum
- Idemitsu Kosan (Vietnam JV)
Read Analysis of Southeast Asia Oil And Gas Downstream Companies
Market Opportunities and Future Outlook
Refinery complexity upgrades and petrochemical integration continue to create opportunities in import-displacement products, including Euro-V fuels, propylene/ethylene derivatives, and higher-spec aromatics, with project momentum visible in core markets. In Indonesia, the RDMP Balikpapan upgrade inaugurated in January 2026 lifted capacity from 260,000 bpd to 360,000 bpd, supporting a shift toward larger, more complex domestic supply systems that can pivot product slates toward jet fuel and marine distillates while meeting tighter fuel specifications. Vietnam also shows a clear investment track, with construction of the Dung Quat Refinery Upgrade and Expansion Project commencing in July 2026 to raise capacity from 148,000 bpd to 171,000 bpd by 2028, while the Long Son complex in Vietnam advanced feedstock flexibility via an ethane-enablement contracting step (LSPE) to align petrochemical output economics more closely with global feedstock spreads.
Low-carbon liquid fuels and the associated logistics add an opportunity layer around aviation and marine demand centers. Singapore and Malaysia have concrete SAF evaluation and development moves underway, including Keppel and Aster assessing a Jurong Island SAF plant (100,000 tonnes per year) and Oiltek with BioSeaga announcing joint development of a 300 metric tons per day SAF biorefinery in Sabah. In parallel, gas and LNG infrastructure is becoming more consequential for downstream-adjacent supply security and industrial demand, as PETRONAS Gas and Tenaga Nasional formalized development of Malaysia's third LNG regasification terminal (RGT-3) in Lumut, Perak (500 MMscfd), supporting reliability for gas-fired generation and industrial users that anchor fuel, LPG, and petrochemical value chains.
Recent Industry Developments in Southeast Asia Oil And Gas Downstream Market
- April 2026: Pertamina advanced new gasoline-supply infrastructure by breaking ground for two new refinery facilities at its Dumai and Cilacap sites, with a stated combined 62,000 bpd capacity and an estimated investment of about USD 1.2 billion. The move reinforces Indonesia's import-reduction agenda and increases the pipeline of downstream projects linked to domestic demand and product-quality upgrades.
- May 2025: Shell agreed to transfer ownership of its Indonesia mobility retail network to a joint venture between Citadel Pacific and Sefas Group, while keeping the Shell brand and supplying fuel products under brand licensing arrangements. The transaction reshapes competitive dynamics in retail distribution by separating network ownership from brand and supply, creating room for new operators to scale forecourt footprints.
- May 2024: Shell announced plans to sell its interest in the Singapore Energy and Chemicals Park, including the Singapore refinery and petrochemicals assets, in a portfolio action later followed by a buyer process. The development signaled a shift in ownership for a strategic regional hub and increased the importance of supply-chain and trading optimization for market participants reliant on Singapore for exports, blending, and bunkering.
Southeast Asia Oil And Gas Downstream Market Report Scope and Research Methodology
Market Definition and Coverage
For this study, the market captures downstream oil and gas activity across Southeast Asia, focusing on the value created from refining and processing through to marketing and sale of finished petroleum products and processed gas delivered into local demand.
Scope exclusions: We do not count upstream exploration and production, crude trading margins, or midstream pipeline and LNG shipping services unless they are bundled into downstream selling revenue.
Segments Covered in This Report
- By Sector
- Refineries
- Petrochemical Plants
- By Product Type
- Refined Petroleum Products
- Petrochemicals
- Lubricants
- By Distribution Channel
- Direct Sales/Wholesale
- Distributors/Commercial
- Retail
- By Geography
- Indonesia
- Malaysia
- Thailand
- Vietnam
- Philippines
- Singapore
- Myanmar
- Rest of Southeast Asia
Data Sources, Market Sizing, and Validation
Desk Research
Desk research starts with public energy and trade statistics, so the demand and supply picture is anchored in figures that can be checked against country reporting. We commonly rely on sources such as ASEAN energy publications, national energy ministries and regulators in the covered countries, IEA country and product balances, UN Comtrade import and export series, and refinery capacity disclosures from official operators and port authorities.
After that, we use company annual reports, investor presentations, and audited filings to understand capacity additions, utilization, and product mix shifts that move revenue. For cross-checks, we also review reputable news coverage on turnaround schedules and new unit start-ups, and we use paid subscriptions for company financials, shipment-level trade signals, and patent lookups where relevant. These desk sources are illustrative only, and many other public documents were also used to collect, confirm, and clarify data.
Primary Interviews and Surveys
Primary work is used to test what the desk numbers cannot fully explain, especially pricing logic, utilization patterns, and how marketing margins move across countries. We spoke with a mix of refiners, fuel distributors, storage and terminal linked stakeholders, and large end users, and coverage was balanced across APAC sub regions within Southeast Asia so country differences were not averaged out too early.
Distribution of primary research fieldwork respondents
| Company type | Respondent position |
|---|---|
| Top tier: 36% | CXOs: 16% |
| Mid tier: 46% | Functional/Unit leaders: 35% |
| Smaller Players: 18% | Managers: 49% |
Market-Sizing & Forecasting
Sizing starts with a top-down build where regional refining capacity (thousand barrels per day), typical utilization, and product output patterns are used to reconstruct saleable volumes, and then converted to revenue using observed price bands. To keep totals realistic, we also run selective bottom-up checks, like sampling country level demand indicators and using ASP times volume for key products, and then adjusting when channel checks indicate unusual discounting or shortages.
Inputs are kept practical and repeatable, including refinery capacity additions and shutdowns, utilization and turnaround cycles, product crack spread direction, import dependence for specific fuels, and changes in retail fuel pricing policies. For forecasting, scenario analysis is used because the region can shift quickly with new units, regulation, and oil price swings, and primary feedback is then used to select the most likely path for utilization and blended ASP progression. When bottom-up data is missing for smaller markets, the gap is handled through share allocation anchored to trade flows and known capacity rather than guesswork.
Data Validation & Update Cycle
Outputs are checked against independent signals such as trade balances for refined products, visible capacity and commissioning timelines, and country level consumption trends, and then variances are investigated before sign off. If a number moves too sharply, we re-check the key drivers, re-run currency and pricing steps, and re-contact sources when needed.
Reports are refreshed on an annual cycle, and interim updates are made when major events occur, such as large refinery start ups, extended outages, or policy changes that affect pricing. Before delivery, an analyst completes a final pass so clients receive an updated view based on the latest available public releases and confirmed field feedback.
Mordor Intelligence's Southeast Asia Oil and Gas Downstream Market Size Measured Against Other Published Estimates
Published market values for this downstream topic can vary because firms decide different boundaries for what counts as downstream revenue, and they also apply different timing for currency conversion and oil-linked pricing. Small changes in how ASPs are blended across gasoline, diesel, jet fuel, and other products can shift the total materially, particularly when utilization changes around turnarounds.
In our case, the model is rechecked around major price moves using the same conversion month for local currencies and a refreshed blended ASP curve. Those steps are then validated against capacity utilization and trade flow signals, which is the refresh-led discipline applied by Mordor Intelligence.
Benchmark comparison
| Source | Market Size | Gaps in Research Methodology |
|---|---|---|
| Mordor Intelligence | USD 6.15 B (2025) | |
| Regional Consultancy A | USD 182.40 B (2024) | This figure likely uses a much broader revenue pool by folding in a wider set of downstream value chain activities, and it is anchored to a different base year, which changes currency timing and the price environment. |
| Trade Journal B | USD 187.40 B (2026) | The estimate appears to lean on a fuel and petrochemical revenue interpretation with an aggressive ASP progression, and it also uses a later base year that can inflate totals when oil prices and margins are higher. |
The spread in values mostly comes from scope boundaries and how pricing and currency timing are handled across years. By keeping the steps tied to capacity, utilization, trade flows, and a clearly defined ASP conversion window, the resulting market size is easier to trace back to observable drivers and to update consistently when conditions change.
Key Questions Answered in the Report
How large will the Southeast Asia oil and gas downstream market be by 2031?
Forecasts place the value at USD 8.1 billion, up from USD 6.15 billion in 2025.
Which downstream segment is growing fastest?
Petrochemical plants are projected to expand at a 6.02% CAGR through 2031 as integration strategies accelerate.
Why is Indonesia pivotal to regional downstream dynamics?
A 35.08% revenue share, a 1.6 million bpd refining system and USD 15 billion in planned petrochemical capacity make Indonesia the anchor market.
How does carbon pricing impact refinery economics?
Rising levies in Singapore and planned taxes in Indonesia incentivize efficiency upgrades and carbon-capture deployment that lower net emissions and unlock premium low-carbon product pricing.
What does IMO 2020 compliance mean for regional bunkering?
Southeast Asian ports added 40% compliant fuel capacity since 2020, securing long-term marine-fuel demand for refineries configured with advanced hydrotreaters.
How is EV adoption reshaping gasoline demand?
Thailand’s 9% EV sales share and Indonesia’s battery-supply push point to a medium-term erosion of urban gasoline demand, urging refiners to diversify toward jet fuel, marine distillates and chemicals.