
Market Overview
| Study Period | 2020 - 2031 |
|---|---|
| Forecast Data Period | 2026 - 2031 |
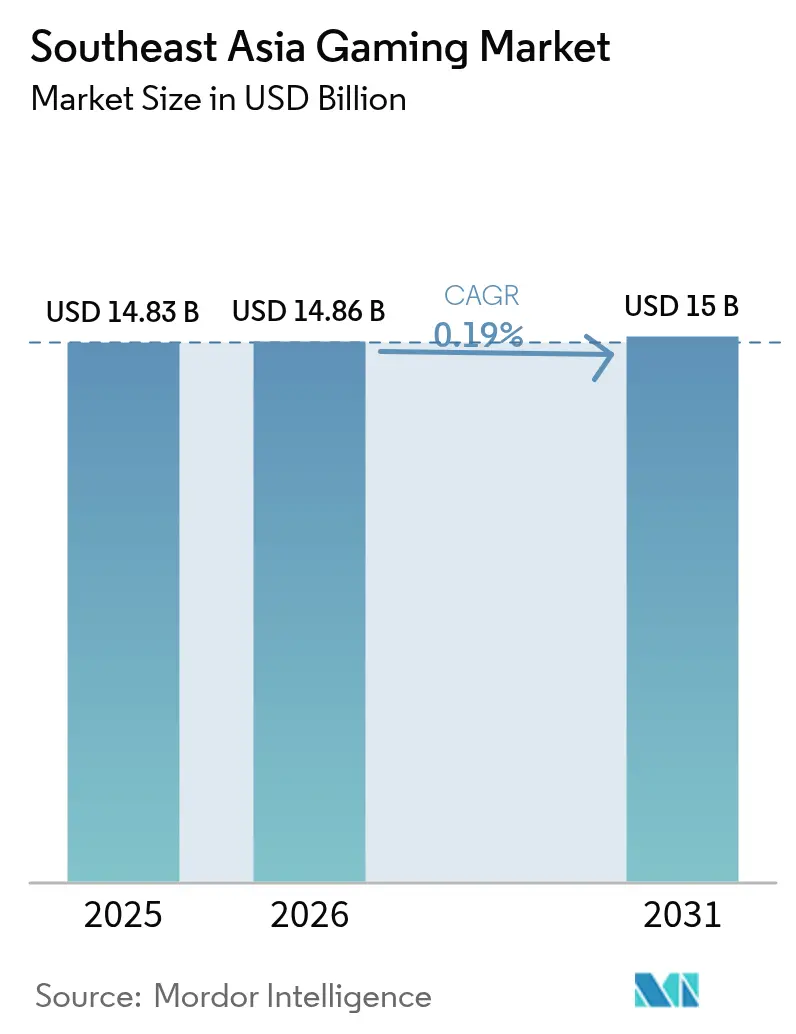
| Base Year Market Size (2025) | USD 14.83 Billion |
| Market Size (2026) | USD 14.86 Billion |
| Market Size (2031) | USD 15 Billion |
| Growth Rate (2026 - 2031) | 0.19% CAGR |
| Market Concentration | Medium |
Major Players *Disclaimer: Major Players sorted in no particular order Image © Mordor Intelligence. Reuse requires attribution under CC BY 4.0. | |
Southeast Asia Gaming Market Analysis by Mordor Intelligence
Southeast Asia gaming market size in 2026 is estimated at USD 14.86 billion, growing from 2025 value of USD 14.83 billion with 2031 projections showing USD 15 billion, growing at 0.19% CAGR over 2026-2031. Robust user engagement continues, yet saturated addressable audiences, tightening regulations, and currency volatility restrain top-line expansion. Mobile titles retain primacy as 5G coverage improves playability and cloud-based delivery, but low-spec devices cap average revenue per user and limit premium content uptake. Localized payment ecosystems anchored in digital wallets and carrier billing reduce friction for micro-transactions and help offset credit-card under-penetration. Intensifying rivalry among regional champions such as Garena and global publishers, including Tencent and NetEase, accelerates content localization, esports sponsorship, and hybrid monetization experiments. Government esports programs and tax incentives spur professionalization, though compliance costs and content-approval delays temper immediate returns.
Key Report Takeaways
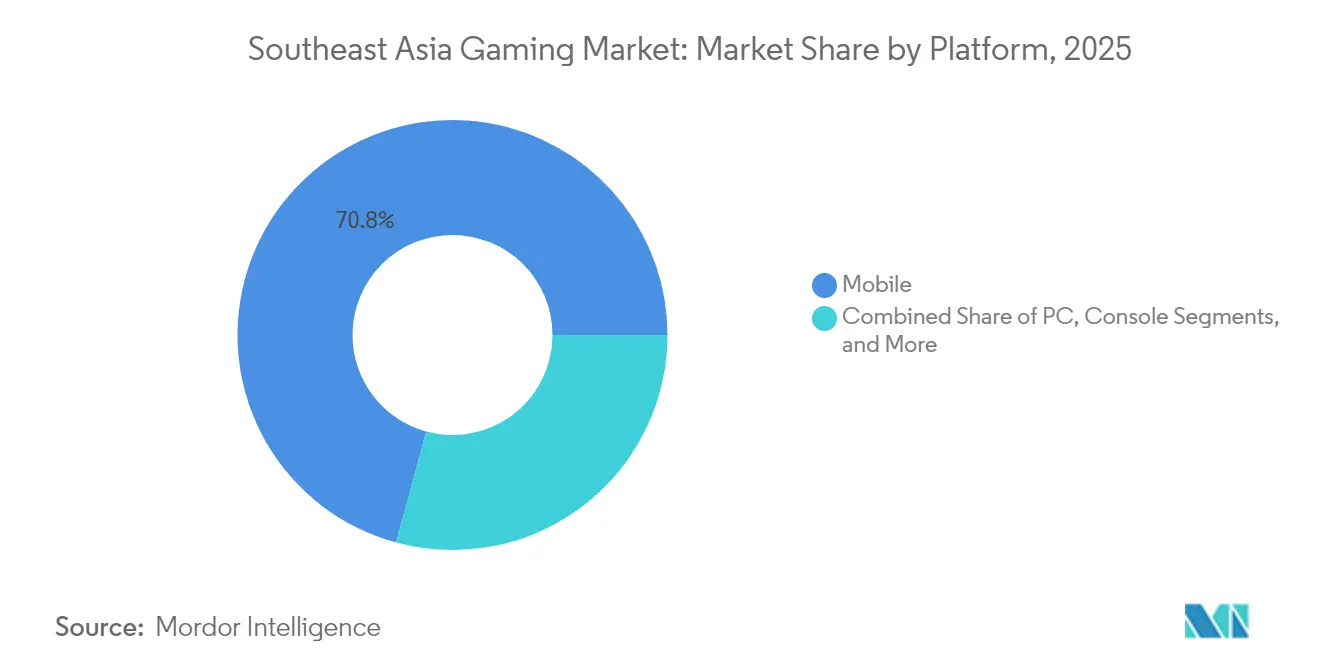
- By platform, mobile accounted for 70.78% of the Southeast Asia gaming market share in 2025. Cloud gaming is projected to expand at a 0.95% CAGR between 2026-2031.
- By revenue model, free-to-play held 75.62% share of the Southeast Asia gaming market size in 2025. Subscription services post the fastest growth at a 1.20% CAGR through 2031.
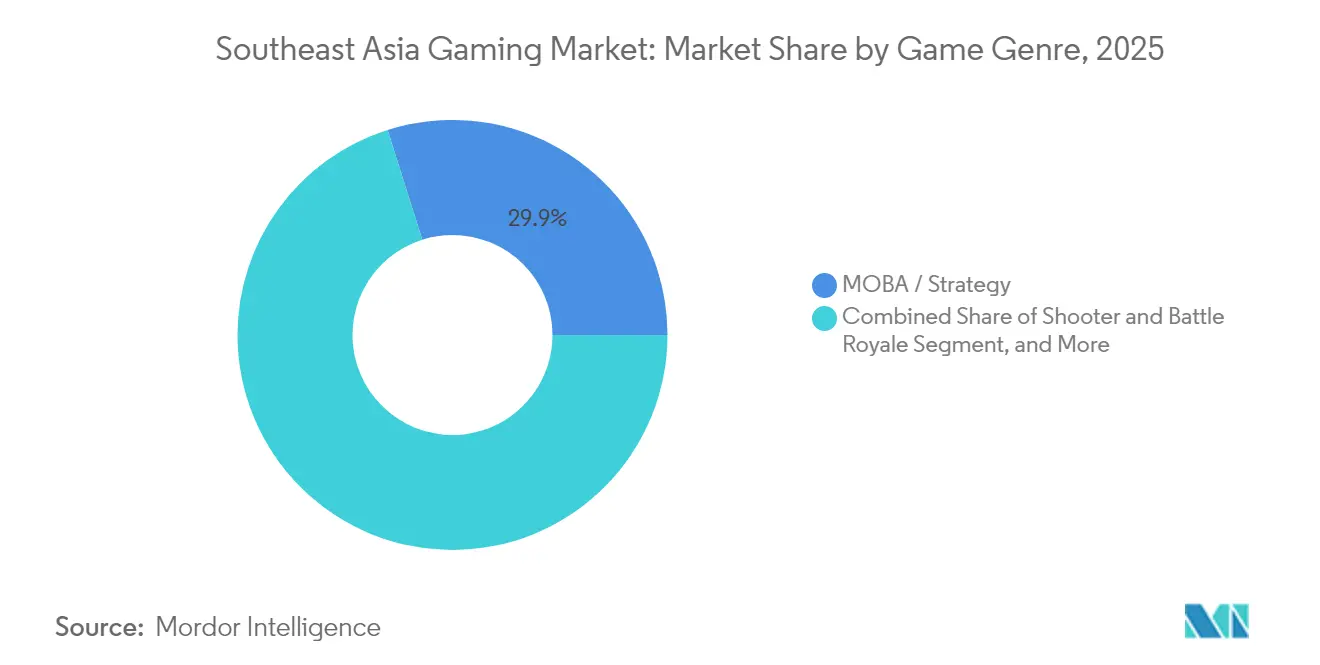
- By game genre, MOBA and strategy commanded 29.88% of the Southeast Asia gaming market size in 2025, while simulation and sports are advancing at a 0.43% CAGR.
- By country, Indonesia led with 29.45% of the Southeast Asia gaming market share in 2025; Thailand records the highest projected CAGR at 0.59% through 2031.
Note: Market size and forecast figures in this report are generated using Mordor Intelligence’s proprietary estimation framework, updated with the latest available data and insights as of 2026.
Southeast Asia Gaming Market Trends and Insights
Drivers Impact Analysis*
| Driver | (~) % Impact on CAGR Forecast | Geographic Relevance | Impact Timeline |
|---|---|---|---|
| Rising mobile-internet penetration and affordable smartphones | +0.8% | Indonesia, Philippines, Vietnam | Medium term (2-4 years) |
| 5G rollout enabling low-latency competitive gaming | +0.6% | Singapore, Malaysia, Thailand | Medium term (2-4 years) |
| Increasing adoption of digital wallets and carrier billing | +0.5% | Thailand, Malaysia, Philippines | Short term (≤ 2 years) |
| Government support for esports and tax incentives | +0.4% | Thailand, Malaysia, Indonesia | Long term (≥ 4 years) |
| Emergence of out-of-app alternative distribution channels | +0.3% | Global | Short term (≤ 2 years) |
| Surging cloud-gaming cafés in tier-2 SEA cities | +0.2% | Indonesia, Vietnam, Philippines | Medium term (2-4 years) |
| Source: Mordor Intelligence | |||


Rising Mobile-Internet Penetration and Affordable Smartphones
Indonesia achieved 99.4% smartphone adoption among internet users by 2024, with 96% of players favoring mobile titles. Budget Android devices priced below USD 150 broadened gamer demographics, bringing Vietnam’s user base to 54 million and sustaining 9% annual growth. Publishers respond by optimizing asset size, frame rates, and battery consumption to accommodate entry-level hardware, ensuring reach but limiting premium graphics and monetization depth. Lightweight builds cut data costs and improve playability on 3G fallback connections, reinforcing the Southeast Asia gaming market’s mobile-first orientation. Yet low disposable income segments restrain in-app purchase intensity, keeping ARPU below USD 15 across most markets. Device vendors collaborating with telcos on gaming-bundled data plans aim to elevate engagement and nudge users toward higher-end handsets.
5G Rollout Enabling Low-Latency Competitive Gaming
Malaysia’s 5G network covered 80.2% of the population by December 2024, boosting median download speeds to 105.36 Mbps from 45.57 Mbps a year earlier. Singapore ranks among Asia’s fastest for mobile throughput, while Thailand’s 5G footprint spans over 90% of urban centers.[1]Staff Reporter, “5G Availability High Amongst APAC Markets,” Asian Telecom, asiantelecom.com Low-latency connectivity cuts lag to sub-30 ms, a threshold critical for MOBA and battle-royale esports. TM Global deployed edge facilities to shrink server round-trips, demonstrating 40% latency reduction in pilot cloud-gaming sessions. Telcos bundle data-free game passes and co-host tournaments to popularize 5G services. Rural coverage gaps and spectrum-auction delays in Indonesia temper uniform gains, but government digital-inclusion mandates aim to close disparities by 2027.
Increasing Adoption of Digital Wallets and Carrier Billing
TrueMoney, GrabPay, and Boost collectively exceed 120 million active wallets region-wide, with game credit top-ups among the top three use cases in Thailand and Malaysia.[2]DigitalEdge, “Fintech: Digital Wallets Driving User-Centric Finance,” The Edge Malaysia, theedgemalaysia.com Average in-game basket sizes rise 64% when buy-now-pay-later options are available, signaling latent spending capacity once friction barriers fall. Direct carrier billing still processes over 25% of micro-transactions in the Philippines, serving unbanked users, though operator fees above 25% compress publisher margins. Regulatory pushes for interoperable QR standards and caps on wallet fees support broader payment choice, benefiting the Southeast Asia gaming market as platforms diversify monetization away from sole reliance on Google Play and App Store rails.
Government Support for Esports and Tax Incentives
Thailand’s 2021 recognition of esports as a professional sport unlocked access to the Sports Authority fund, channeling USD 2.9 million into athlete development by 2025. Malaysia earmarked RM 10 million (USD 2.4 million) for esports infrastructure, matched by private sponsorship from telcos and hardware vendors.[3]Dealessandri Marie, “Esports Professionally Recognised in Thailand,” GamesIndustry.biz, gamesindustry.biz Indonesia’s Presidential Regulation 19/2024 coordinates ministries to raise domestic developer share and eases foreign-talent visas, targeting USD 40 million annual private investment. These programs legitimize gaming careers, expand event calendars, and attract global tournament IP such as Valorant Masters Bangkok 2025. Lengthy budget disbursement cycles and shifting political priorities may stagger timelines, yet the policy tailwind remains positive.
Restraints Impact Analysis*
| Restraint | (~) % Impact on CAGR Forecast | Geographic Relevance | Impact Timeline |
|---|---|---|---|
| Low-spec device base limits high-fidelity titles | -0.4% | Indonesia, Philippines, Vietnam | Medium term (2-4 years) |
| Stringent content regulations and approval delays | -0.3% | Vietnam, Indonesia, Malaysia | Long term (≥ 4 years) |
| Volatile local currencies hurt IAP pricing | -0.2% | Indonesia, Philippines, Thailand | Short term (≤ 2 years) |
| Rising digital-payment fraud and chargebacks | -0.1% | Global | Medium term (2-4 years) |
| Source: Mordor Intelligence | |||
Low-Spec Device Base Limits High-Fidelity Titles
Entry-level smartphones with 3 GB RAM or less still account for 52% of handsets in Indonesia and the Philippines. Developers invest in asset-streaming and adaptive-resolution technology to maintain playability, but visual downgrades dilute potential for premium cosmetics and season-pass upselling. Testing matrices encompass over 600 device models, inflating QA budgets by up to 35%. The constraint sustains dominance of casual and hyper-casual genres, keeping average session times under 30 minutes and depressing ad-view CPMs. Hardware upgrades will occur gradually as income levels rise, but near-term monetization upside remains capped.
Stringent Content Regulations and Approval Delays
Vietnam’s Ministry of Information and Communications revoked 104 G1 licenses by November 2024 for non-compliance, extending go-to-market timelines to six-plus months.[4]Vietnam+, “Vietnam Seeks to Tap Into Game Industry’s Huge Potential,” vietnamplus.vn Indonesia blocked access to Steam and Epic Games Store in 2022 over registration issues, underscoring enforcement capabilities. Malaysia’s Film Censorship Board retains broad discretionary powers that have led to game bans on religious-sensitivity grounds. These hurdles raise legal costs and encourage partnerships with local publishers versed in compliance. Iterative live-ops updates can trigger re-review, complicating seasonal content release pacing and hampering the Southeast Asia gaming market’s agility relative to global peers.
*Our forecasts treat driver/restraint impacts as directional, not additive. The impact forecasts reflect baseline growth, mix effects, and variable interactions.
Segment Analysis
By Platform: Mobile Strength Spurs Cloud Crossover
Mobile titles generated 70.78% of 2025 revenues, confirming the Southeast Asia gaming market dependence on handheld devices. The segment still posts mid-single-digit user growth as rural smartphone diffusion progresses, but monetization intensity plateaus. Cloud gaming, although only 1.8% of revenue, records the fastest 0.95% CAGR, benefitting from 5G rollouts and edge-compute partnerships. The Southeast Asia gaming market size for cloud services is projected to surpass USD 365 million by 2031, translating to 2.43% of overall spend. Hybrid models allowing session hand-off between mobile and cloud strengthen retention. PC café revenue slips amid higher electricity prices, yet cafés reposition as esports arenas, drawing sponsorship from peripheral brands. Console adoption lags due to USD 400+ hardware pricing and limited official distribution channels, though gray-market imports feed niche enthusiast communities.
Hardware subsidies tied to telco contracts and cloud-streamed console libraries attempt to lower the entry barrier. Content strategy increasingly revolves around cross-platform progression, letting players grind on mobile and enjoy premium visuals in the café or at home. Publishers leverage cloud-rendered demos to market upcoming mobile ports, reducing APK download friction and highlighting flagship experiences that were previously inaccessible to low-spec device owners.


By Revenue Model: Subscriptions Gain Traction Amid Free-to-Play Plateau
Free-to-play accounted for 75.62% of the Southeast Asia gaming market size in 2025, with gacha, season passes, and cosmetic bundles anchoring spend. However, payer conversion rates hover at 6–8%. Subscription passes such as Garena Booyah and Apple Arcade post a 1.20% CAGR, surpassing USD 426 million by 2031. Bundles offering ad-free gameplay, exclusive skins, and monthly currency stipends enhance perceived value, especially when priced below USD 4. Carrier-billed weekly pass variants attract unbanked users. In-game advertising grows alongside regional digital-ad spending but faces viewability trade-offs during competitive sessions.
Regulators scrutinize loot-box mechanics, pushing publishers to disclose odds and cap spending, which may marginally depress high-spender activity. Consequently, developers diversify toward battle-pass and cosmetic subscriptions. The Southeast Asia gaming market share for premium pay-to-play titles remains under 3% given price sensitivity, yet remastered legacy IPs enjoy nostalgia-driven spikes. Web3 play-to-earn activity cools after speculative token declines, but select guild-run scholarship models persist in the Philippines.
By Game Genre: MOBA Primacy Meets Simulation Surge
MOBA and strategy titles held 29.88% of 2025 revenue, led by Mobile Legends: Bang Bang, which generated USD 45 million regionally during January-April 2024. The Southeast Asia gaming market size for MOBA is projected to contract marginally as newer genres take share, but esports-driven engagement keeps monetization robust. Simulation and sports exhibit 0.43% CAGR, propelled by localized football licenses and life-sim titles featuring regional cultural motifs. Shooter and battle-royale franchises maintain stickiness through frequent cosmetic drops and influencer-backed tournaments, though user churn rises with content fatigue. Role-playing games gain footing via cross-media collaborations with anime properties popular among Gen Z.
Cross-genre hybrids emerge: MOBA-auto-battler mashups and shooter-RPG blends create differentiated loops to combat saturation. Developers localize language packs and celebrity voice-overs to deepen emotional resonance. Educational game sub-genres begin exploring ad-funded freemium paths in Thailand’s school sector. The genre diversification underscores evolving taste profiles as disposable incomes rise and as cloud-streamed fidelity broadens palate.
Geography Analysis
Indonesia anchors the Southeast Asia gaming market with a 29.45% stake, leveraging its vast population and 96% mobile preference to generate USD 4.38 billion in 2026 revenue. Presidential Regulation 19/2024 sets objectives to lift local developer revenue share and to streamline import duties on gaming hardware. Yet 2022 platform blocks highlight regulatory unpredictability that can upend foreign publisher planning. Telcos partner with Tencent Cloud to pilot edge nodes in Java and Sulawesi, eyeing 40% latency reduction for multiplayer titles.
Thailand’s projected 0.59% CAGR brings its revenue to USD 2.62 billion by 2031, driven by 5G coverage, esports grants, and high social-media penetration that amplifies influencer campaigns. State-backed tournaments funnel prize pools that exceed USD 5 million annually, stimulating semi-pro circuits. Payment-gateway regulation caps merchant fees at 1.5%, encouraging micro-transaction experimentation.
Vietnam’s gaming user base surpassed 54 million in 2024, and the government outlines a USD 1 billion ambition by 2030. However, G1 licensing reviews and content screening prolong launch timelines. Local studios such as VNG and Hiker Games secure co-publishing deals with Korean and Chinese IP owners to mitigate compliance risk.
Malaysia and Singapore share advanced infrastructure. Malaysia’s nationwide network modernization, 44% complete in 2024, readies 7,200 5G-capable sites. Singapore’s Infocomm Media Development Authority supports cloud-gaming pilots within its Media Industry Digital Plan, offering rebates on GPU cloud hours. The Philippines leverages a 76 million mobile-first population, with telco Smart’s Giga Arena esports platform surpassing 1 million registered gamers in 2025. Emerging markets such as Cambodia and Laos show double-digit gamer growth but contribute under 3% of regional spend due to limited payment rails and political uncertainties.
Regulatory Landscape
Southeast Asia operates across multiple regulators, with market access shaped by content classification, licensing, and online safety rules that differ materially by country. In Vietnam, online game publishing remains governed through licensing tiers, including G1 online game services licensed via the Ministry of Information and Communications, while other categories rely on local certification. Enforcement has included large-scale license revocations in late 2024 for non-compliance, which continues to favor local publishing partners and longer approval lead times.
In 2026, policy updates introduced additional compliance touchpoints in both Singapore and Vietnam. Singapore amended its framework for exempt video games through the Films (Classification - Exempt Video Games) (Amendment) Notification 2026, published on April 29, 2026 and effective May 1, 2026, operating alongside IMDA classifications (including enforceable M18). Vietnam brought Decree No. 86/2026/ND-CP into force on May 15, 2026, amending rules around prize-winning electronic games for foreigners. In Malaysia, subsidiary instruments under the Online Safety Act 2025 moved forward into Q2 2026, with child protection and content controls driving operational requirements for platforms and publishers, including age-appropriate experiences and safety tooling.
Competitive Landscape
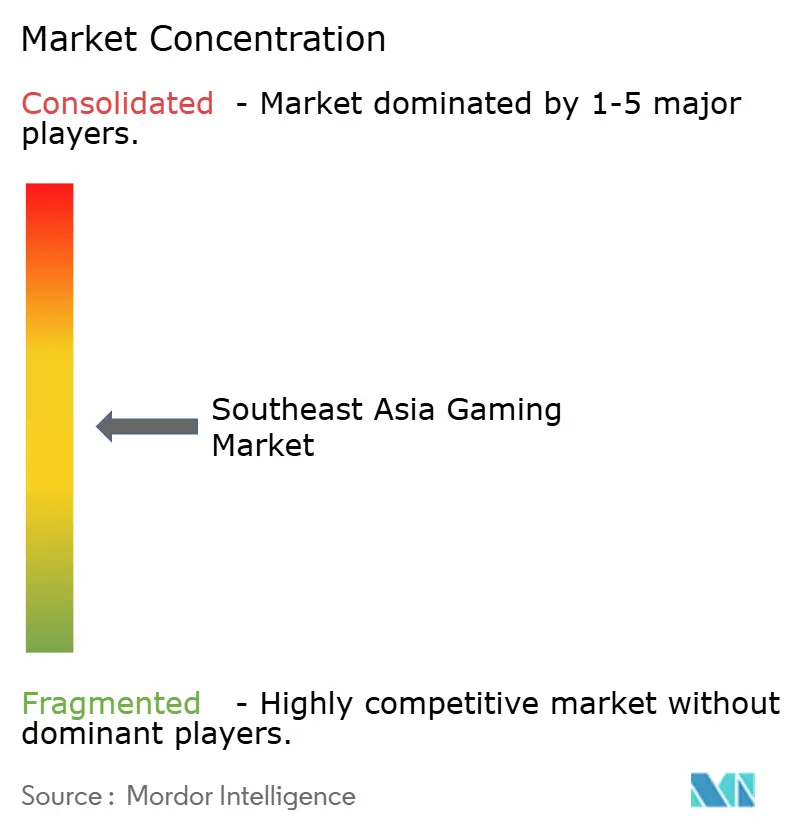
The Southeast Asia gaming market remains fragmented; the top five publishers collectively hold roughly 28% share, indicating moderate concentration. Sea Limited’s Garena leads through localized operations and flagship Free Fire, which posted 70% quarter-over-quarter download growth in Indonesia during 2024. Tencent leverages WeChat Pay integrations and partnerships with Malaysian telcos to reduce payment friction. NetEase expands via local joint ventures and Thai-language dubbing studios, while Activision Blizzard licenses Call of Duty Mobile through Garena to capitalize on existing distribution.
Content localization depth differentiates regional players: Bahasa voice-overs, cultural holiday events, and Muslim-friendly cosmetic items lift engagement during Ramadan. Cloud infrastructure investments become competitive moats; TM Global and Tencent Cloud court publishers with SLA-backed sub-40 ms latency. Blockchain integration experiments continue, illustrated by play-to-own cosmetics trials in Singapore, but mainstream adoption stays cautious.
Strategic moves in 2024-2025 illustrate rivalry escalation. NCSOFT created NCV Games with Vietnam’s VNG to publish Lineage 2M across six markets, tapping VNG’s Zalo payment network. TM Global’s March 2025 Edge Gaming launch positions Malaysia as a cloud-gaming hub. Tencent opened a Jakarta creator campus providing motion-capture facilities to indie studios, aiming to secure early access to breakout IP. Esports event operators ESL and Mineski expand arena footprints, deepening sponsorship inventory.
Southeast Asia Gaming Industry Leaders
IGG Inc.
Nintendo Co., Ltd.
Asiasoft Corporation Public Company Limited
Sony Group Corporation
Com2uS Holdings Corporation
- *Disclaimer: Major Players sorted in no particular order

Market Opportunities and Future Outlook
Two near-term opportunity areas stand out from the current operating constraints: (i) compliance-ready publishing and live-ops services that shorten time-to-launch under tightening licensing and classification regimes, and (ii) payments and trust infrastructure that improves conversion in a price-sensitive, wallet-heavy region. Vietnam and Malaysia illustrate how operational readiness translates into execution capacity, since Vietnam tightened oversight through licensing enforcement actions and updated 2026 rules, while Malaysia is rolling out Online Safety Act 2025 instruments through Q2 2026. This raises the value of localized moderation, age-gating, and content governance capabilities that can be applied across multiple titles.
On monetization, Southeast Asia already has the mechanics to lift spend without relying only on premium device penetration. TrueMoney, GrabPay, and Boost collectively exceed 120 million active wallets region-wide, and direct carrier billing continues to process a meaningful share of micro-transactions in the Philippines despite high operator fees. In 2026, ecosystem players also leaned into enablement and market-building: Coda Payments signed an MoU with Indonesia's Ministry of Creative Economy (EKRAF) in June 2026 focused on developer infrastructure and player safety initiatives, while Gravity Game Vision launched Ragnarok: The New World in Southeast Asia in July 2026, reinforcing the region as a primary rollout theater for live-service MMORPGs that can be tuned to local payments, language, and community channels.
Recent Industry Developments
- April 2026: Nintendo planned to acquire 80% of Bandai Namco Studios Singapore and rename it Nintendo Studios Singapore. The deal deepens Nintendo's direct operating footprint in Southeast Asia beyond distribution, adding local development capability that can support region-specific content and faster release operations.
- September 2025: Nintendo established Nintendo Singapore Pte. Ltd. with SGD 8 million in capital to accelerate its regional business. A dedicated subsidiary strengthens go-to-market control for hardware and software, and supports partnerships, localization, and compliance processes managed closer to in-market realities.
- March 2025: Asphere Innovations (Asiasoft) partnered with Tencent Cloud and Anti-Cheat Expert (ACE) to integrate security services for its online games in Southeast Asia. The expanded anti-cheat and integrity tooling helps publishers protect competitive ecosystems and reduces fraud and chargeback exposure tied to live-service monetization.


Research Methodology Framework and Report Scope
Market Definition and Coverage
This market is defined as the revenue generated from video games across Southeast Asia, covering consumer spending tied to playing games on mobile, PC, console, and cloud gaming services.
Scope exclusions: We exclude gambling and casino gaming, plus hardware-only sales that are not directly tied to game content or gaming services revenue.
Segmentation Overview
- By Platform
- Mobile
- PC
- Console
- Cloud/Game-Streaming
- By Revenue Model
- Free-to-Play (F2P)
- Premium / Pay-to-Play
- Subscription
- In-Game Advertising
- Hybrid and Web3 / Play-to-Earn
- By Game Genre
- MOBA / Strategy
- Shooter and Battle Royale
- Role-Playing Games (RPG)
- Casual and Puzzle
- Simulation and Sports
- Other Game Genre
- By Country
- Indonesia
- Malaysia
- Philippines
- Singapore
- Thailand
- Vietnam
- Rest of Southeast Asia
Data Sources, Market Sizing, and Validation
Desk Research
Desk research starts by setting the demand pool and country coverage for Southeast Asia, and then mapping that to how games are monetized across platforms. Public sources are used to anchor key series such as internet access, mobile adoption, and digital spend behavior, since these move the addressable base for gaming.
Sources referenced include official statistics and releases from national telecom and ICT agencies, central bank publications for currency and consumer spending signals, and ITU for connectivity indicators. We also use World Bank materials for population and income markers, and customs and trade statistics where they help interpret console and device availability. In parallel, we review public company filings and investor materials for monetization direction, along with association websites and reputable press for regulatory and payments context. Where needed for cross-checks, we use paid subscriptions for company financials and intelligence, news and financials, and patent databases to validate product cycles and content investment signals. The sources listed here are illustrative, and additional public references were used to collect, validate, and clarify inputs.
Primary Interviews and Surveys
Primary interviews and surveys are used to pressure-test desk assumptions with people who see real demand patterns in Southeast Asia. This includes publishers, distributors, payment ecosystem participants, esports stakeholders, and platform-focused operators. Discussions focus on practical drivers such as monetization mix shifts, pricing and promotion behavior, platform time-share changes, and country level regulatory friction, which then tightens model inputs.
Distribution of primary research fieldwork respondents
| Company type | Respondent position | Region |
|---|---|---|
| Top tier: 29% | CXOs: 13% | |
| Mid tier: 56% | Functional/Unit leaders: 38% | |
| Smaller Players: 15% | Managers: 49% |
Market-Sizing & Forecasting
The core sizing logic uses a top-down demand pool build-up where connected population by country is translated into an active gamer base, then multiplied by spend intensity adjusted by platform and monetization mix. To keep the totals realistic, the model is corroborated with selective bottom-up checks, including sampled revenue run rates for major game formats, channel discussions on typical take rates, and simple ASP times volume approximations for paid titles and subscriptions.
Key inputs include smartphone and broadband penetration, gamer population and engagement signals, platform mix across mobile, PC, console, and cloud gaming, and the split across free-to-play, premium, subscriptions, and advertising. We also account for currency movement in-country that affects USD conversion. Country context is tracked for Indonesia and Thailand, since shifts in mobile share, esports engagement, and payment preferences can move the spend curve even when gamer counts grow slowly.
For forecasting, scenario analysis links growth paths to expected platform mix change and monetization progression, using expert inputs from interviews. Where country level data is thin, proxy indicators such as connectivity growth, income trends, and app economy signals are used first, then recalibrated after interview feedback and cross-checks on historical stability.
Data Validation & Update Cycle
Validation is done by checking model totals against independent signals, then drilling into country and platform level variances before sign-off. If a metric falls outside the expected range, we re-check unit assumptions, re-run currency conversions for the specific period, and re-contact relevant respondents to confirm what changed.
A multi-step internal review is completed so inputs, calculations, and outputs remain traceable and consistent across the study period. Reports are refreshed annually, and interim updates are made when material events occur, such as a major regulation change, a meaningful monetization shift, or a macro move that affects consumer spend. Before delivery, the model and narrative receive a final pass so the latest updated view is reflected for clients.
Mordor Intelligence's Southeast Asia Gaming Market Size Measured Against Other Published Estimates
Published market sizes for Southeast Asia gaming do not always match, because authors select different revenue baskets, vary country coverage, and apply different USD conversion timing, then label the results under similar market names. We outline these differences so a buyer can see what is counted and what is not.
One common gap is scope. Some sources focus only on SEA-6 video game revenue and leave out the wider Southeast Asia roll-up or additional platform services, which drives a much smaller number. Timing is another driver, since base years and exchange-rate windows vary, which changes the headline even when local currency spending is similar. In this study, a narrower external number is usually based on a games-revenue-only basket, while Mordor Intelligence counts a broader gaming revenue pool across Southeast Asia with platform and monetization coverage kept consistent year to year.
Benchmark comparison
| Source | Market Size | Gaps in Research Methodology |
|---|---|---|
| Mordor Intelligence | USD 14.83 B (2025) | |
| Trade Journal A | USD 14.80 B (2024) | Uses a different base year and forecast window, and the definition is less explicit on monetization inclusions, which can shift what is counted under gaming services and related revenue. |
| Industry Analysis B | USD 5.47 B (2025) | Represents SEA-6 video game revenue and can exclude parts of the broader Southeast Asia coverage and certain monetization streams, so the total is not directly comparable to a full regional gaming market value. |
The spread across sources mainly comes from how wide the geography is defined and whether the value includes only game revenue or a wider set of monetization streams across platforms. By keeping country coverage, platform scope, and USD conversion timing consistent, our estimate stays easier to replicate and to reconcile against observable demand indicators such as connectivity, engagement, and spending patterns.


Key Questions Answered in the Report
How large is the Southeast Asia gaming market in 2026?
It is valued at USD 14.86 billion, with a forecast to reach USD 15 billion by 2031 at a 0.19% CAGR.
Which platform leads spending among gamers in Southeast Asia?
Mobile titles dominate, accounting for 70.78% of 2025 revenue and retaining growth momentum as 5G coverage expands.
Why is Thailand considered the region’s fastest-growing gaming country?
Government recognition of esports, 5G rollout, and hosting premier events like Valorant Masters underpin its 0.59% CAGR outlook through 2031.
What revenue model shows the most upside beyond free-to-play?
Subscription passes are the fastest-growing, increasing at a 1.20% CAGR as they offer bundled perks and predictable cash flows.
How are payment preferences shaping monetization?
Rising digital-wallet and carrier-billing adoption lowers friction for micro-transactions, boosting average basket sizes and payer conversion rates.
Page last updated on:


