
Market Overview
| Study Period | 2021 - 2031 |
|---|---|
| Forecast Data Period | 2026 - 2031 |
| Base Year Market Size (2025) | USD 516.91 Million |
| Market Size (2026) | USD 534.02 Million |
| Market Size (2031) | USD 628.53 Million |
| Growth Rate (2026 - 2031) | 3.31 % |
| Market Concentration | High |
Major Players *Disclaimer: Major Players sorted in no particular order Image © Mordor Intelligence. Reuse requires attribution under CC BY 4.0. | |
South Sudan Oil And Gas Upstream Market Analysis by Mordor Intelligence
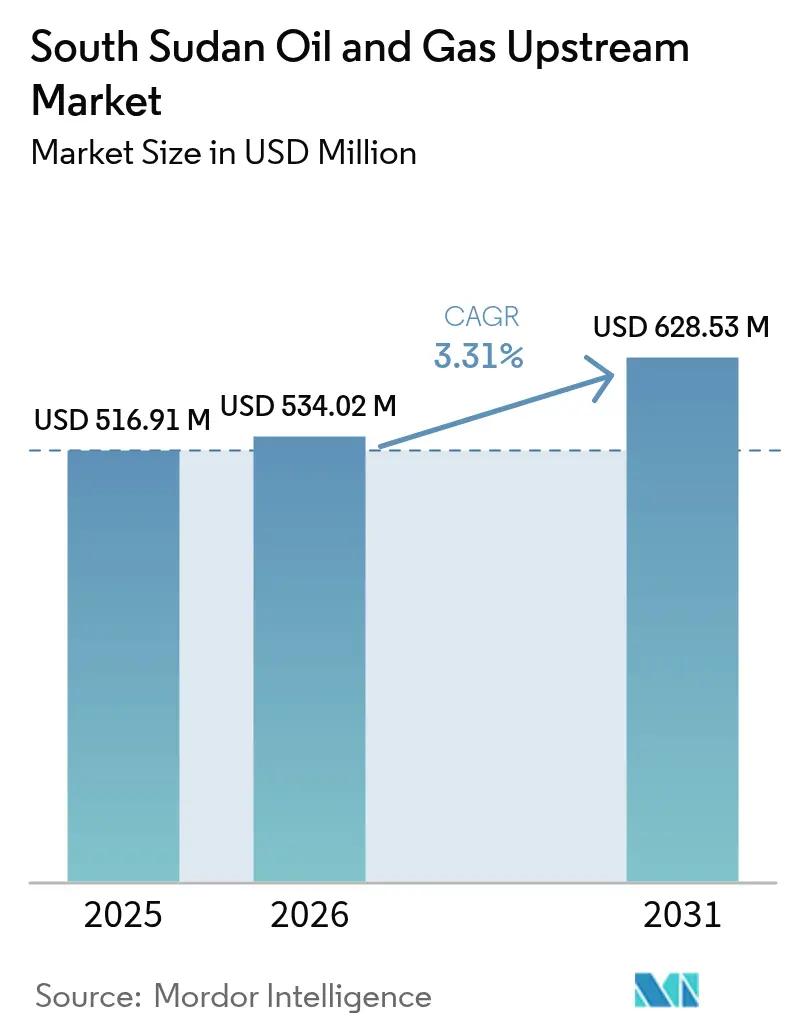
The South Sudan Oil And Gas Upstream Market size is expected to grow from USD 516.91 million in 2025 to USD 534.02 million in 2026 and is forecast to reach USD 628.53 million by 2031 at 3.31% CAGR over 2026-2031.
South Sudan’s gradual production recovery, the planned restart of shut-in capacity, and incremental diversification of export routes underpin this outlook. Political stabilization is enabling field rehabilitation, while new licensing rounds are beginning to attract exploration capital that can offset the natural decline of mature assets. At the same time, rising Asian demand for Nile and Dar blends continues to provide a reliable offtake channel that supports cash-flow visibility for operators. Persistent dependence on Sudan’s pipeline network, flood-related environmental liabilities, and unresolved asset-transfer disputes exert countervailing pressure, tempering the overall growth trajectory of the South Sudan oil and gas upstream market.
Key Report Takeaways
- By location of deployment, onshore operations held 99.74% of the South Sudan oil and gas upstream market share in 2025, while offshore activities are forecast to register the fastest growth, at a 4.85% CAGR, to 2031.
- By resource type, crude oil accounted for a 99.66% share of the South Sudan oil and gas upstream market size in 2025; natural gas is projected to advance at a 4.63% CAGR between 2026 and 2031.
- By well type, conventional wells maintained 100.00% control of the South Sudan oil and gas upstream market share in 2025 and are expected to grow at a 3.31% CAGR through 2031.
- By service, development and production contributed 69.92% of 2025 revenues, while exploration services are forecast to post a 4.66% CAGR to 2031.
- China National Petroleum Corporation, Sinopec Group, and ONGC Videsh collectively commanded more than 80% of operated output in 2024.
Note: Market size and forecast figures in this report are generated using Mordor Intelligence’s proprietary estimation framework, updated with the latest available data and insights as of 2026.
Market Trends and Insights
Drivers Impact Analysis of South Sudan Oil And Gas Upstream Market*
| Driver | (~) % Impact on CAGR Forecast | Geographic Relevance | Impact Timeline |
|---|---|---|---|
| Peace-driven restart of shut-in capacity | +1.20% | Unity and Upper Nile states | Short term (≤ 2 years) |
| 2021-25 licensing rounds attracting new E&P | +0.80% | Under-explored blocks nationwide | Medium term (2-4 years) |
| Proposed Lamu export pipeline | +0.60% | National, with coastal access via Kenya | Long term (≥ 4 years) |
| >90% untapped reserves in new basins | +0.70% | Remote geological formations nationwide | Long term (≥ 4 years) |
| Rising Asian demand for Nile & Dar blends | +0.40% | Global, revenue impact on export volumes | Medium term (2-4 years) |
| Nilepet JVs boosting local content | +0.30% | National, improving field uptime | Medium term (2-4 years) |
| Source: Mordor Intelligence | |||
Peace-driven restart of shut-in capacity
Cease-fire compliance has allowed operators to resume rehabilitation of key assets in Blocks 1, 2, and 4. Equipment overhauls, well workovers, and pipeline repairs are progressing in tandem with security-force deployments that safeguard field crews. Early-stage output ramp-ups illustrate how quickly latent capacity can be restored once surface facilities resume operations. Nevertheless, funding requirements for enhanced oil recovery (EOR) technologies remain substantial, and execution hinges on uninterrupted access to spare parts and skilled labor. A lasting peace accord will therefore be the single most important determinant of short-term volume additions in the South Sudan oil and gas upstream market.
2021-25 licensing rounds attracting new E&P capital
The Ministry of Petroleum’s competitive bid terms—including cost-recoverable royalty structures and fiscal stability clauses—have begun to draw mid-size independents seeking frontier exposure. Signature bonuses, though modest, inject immediate state revenue, while minimum work-program obligations guarantee near-term seismic acquisition and appraisal drilling. Service-sector providers stand to benefit first, as exploration drilling’s 4.9% CAGR outpaces development activity. The extent to which new acreage translates into sustained output will depend on timely permit approvals, contract sanctity, and the deployment of modern directional drilling and mud-logging technologies.
Proposed Lamu export pipeline lowering transit risk
The Lamu Port–South Sudan–Ethiopia Transport (LAPSSET) corridor offers a multi-modal alternative that bypasses Sudan’s conflict-prone pipeline. Although capital-intensive, the 1,485 km line would reduce tariff leakage, curtail unscheduled shutdowns, and diversify crude-blend marketing options. South Sudan’s negotiating leverage with current transit providers has already improved as a result, but tangible volumetric relief is not expected to materialize until after 2029, when mechanical completion is anticipated. Engineering, procurement, and construction (EPC) consortia are currently reviewing environmental impact statements to secure debt funding from export credit agencies.
Greater than 90% untapped reserves in under-explored basins
Geophysical surveys across the Jonglei, Baggara, and Melut extension basins reveal multiple four-way closures and stratigraphic pinch-outs with analogous reservoir characteristics to those of proven fields. Less than 25% of the national acreage has undergone 3-D seismic surveys, and resource-in-place estimates suggest reserve replacement potential well beyond current producing assets. While immediate revenue uplift is unlikely, successful wildcats could establish entirely new development hubs by the early 2030s, broadening the geographic footprint of the South Sudan oil and gas upstream market.(1)
Restraints Impact Analysis of South Sudan Oil And Gas Upstream Market*
| Restraint | (~) % Impact on CAGR Forecast | Geographic Relevance | Impact Timeline |
|---|---|---|---|
| Sudan civil war disruptions to export line | −1.8% | National, covers all export-dependent operations | Short term (≤ 2 years) |
| Flood-induced spills & environmental liability | −0.6% | Oil-producing regions | Medium term (2-4 years) |
| Exit of Petronas and asset-transfer litigation | −0.4% | Select producing blocks | Short term (≤ 2 years) |
| High-TAN Dar blend raises processing costs | −0.3% | National, affects crude marketing | Medium term (2-4 years) |
| Source: Mordor Intelligence | |||
Flood-induced spills & mounting environmental liabilities
Seasonal inundation of low-lying fields has increased the incidence of wellhead washouts and containment-berm failures. Clean-up costs, mandated under the Petroleum Act 2012, have grown as soil remediation contractors charge risk premiums for remote-area deployment. International humanitarian agencies warn that unmitigated contamination threatens community water sources, intensifying calls for stricter environmental audits. The resulting financial provisions divert capital away from drilling programs and lower net investment in the South Sudan oil and gas upstream market.(2)
Exit of PETRONAS and asset-transfer litigation
Malaysia’s Petronas filed an ICSID claim in August 2024 after its divestment to Savannah Energy stalled. Uncertainty over ultimate asset ownership has delayed work-program approvals and capped discretionary spending in the affected blocks. Remaining partners, apprehensive about retrospective tax claims, have slowed spud counts until legal clarity emerges. Although headline output losses are limited, investor sentiment across the broader South Sudan oil and gas upstream market has weakened, reflecting heightened perceived sovereign risk.(3)
*Our forecasts treat driver/restraint impacts as directional, not additive. The impact forecasts reflect baseline growth, mix effects, and variable interactions.
South Sudan Oil And Gas Upstream Market Segment Analysis
By Location of Deployment:
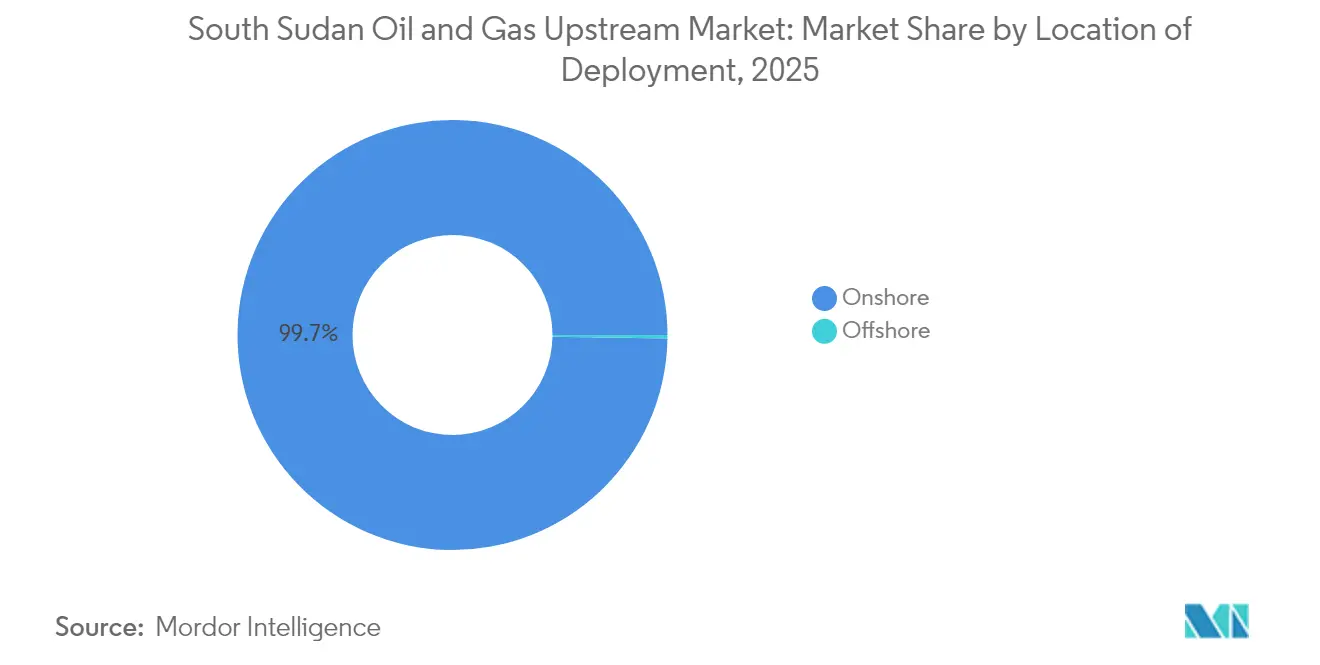
Onshore dominance with emerging offshore prospectivityOnshore activities accounted for 99.74% of the South Sudan oil and gas upstream market share in 2025, generating USD 515.56 million of the overall South Sudan oil and gas upstream market size. Output is centered on mature fields in Unity and Upper Nile, where existing gathering lines and central processing facilities support cost-effective barrel delivery. While political stabilization has improved surface-facility uptime, periodic security incidents and road-haul bottlenecks still disrupt materials flow, occasionally forcing operators to curtail discretionary maintenance.
Offshore acreage, though representing only USD 1.35 million in 2025, offers a 4.85% CAGR through 2031, the fastest among all deployment categories. Interpretation of legacy aeromagnetic surveys suggests the existence of tilted fault blocks along the Red Sea margin, although a modern 2-D seismic grid has yet to be shot. Should commercial volumes be proven, the incremental reserves would diversify the geographic spread of the South Sudan oil and gas upstream market, partially insuring against onshore security disruptions.

By Resource Type:
Crude oil supremacy amid nascent gas monetizationCrude oil generated 99.66% of 2025 revenues, equivalent to USD 515.15 million of the South Sudan oil and gas upstream market size, reflecting decades of pipeline-oriented infrastructure that is optimized for liquid hydrocarbons. Enhanced oil recovery pilots—such as polymer flooding and water-alternating-gas (WAG) injection—are being tested to counter 8-10% annual field decline rates. The rising Asian demand for Nile and Dar grades secures offtake, encouraging continued spending on workovers and artificial lift upgrades.
Natural gas production contributes only USD 1.76 million today but is expected to expand at a 4.63% CAGR through 2031. Flaring reduction commitments under the Global Gas Flaring Reduction partnership motivate operators to prioritize associated-gas gathering. A small-scale liquefied petroleum gas (LPG) project, slated for 2026, will supply regional households, providing a domestic offtake channel that improves project economics. Successful early monetization could meaningfully broaden the revenue profile of the South Sudan oil and gas upstream market.
By Well Type:
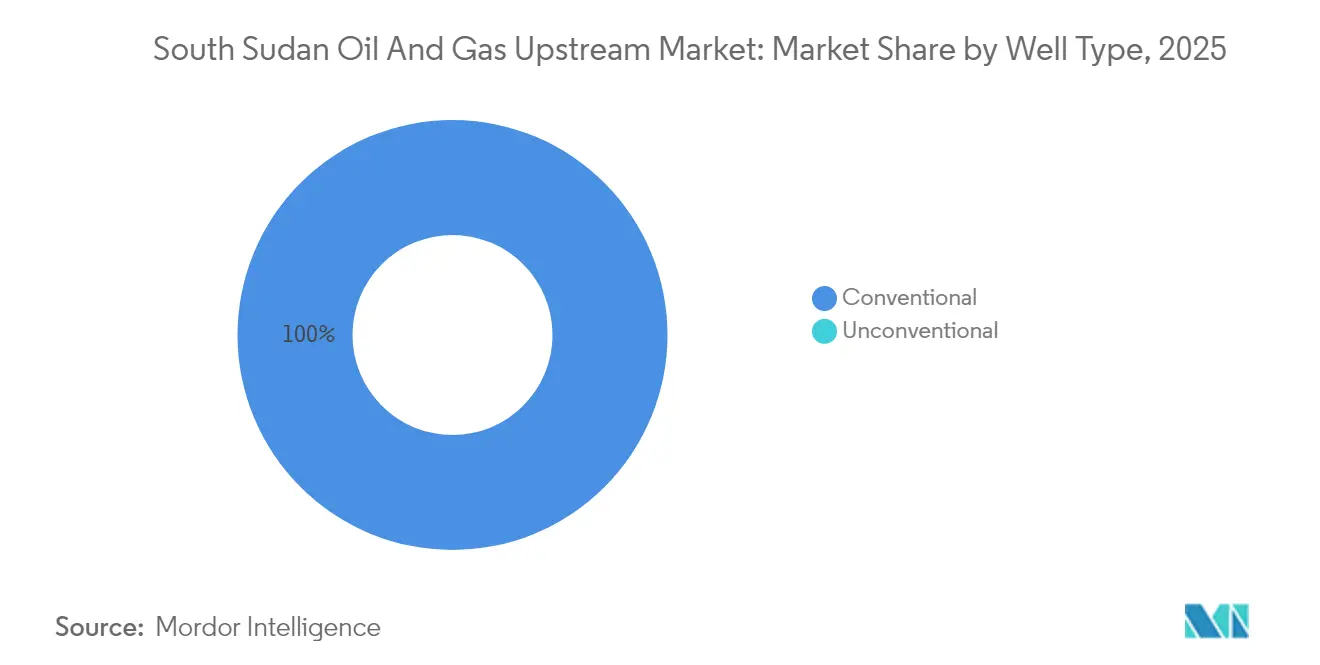
Conventional focus limits technology uptakeConventional wells dominated the 2025 landscape, holding a 100.00% market share and generating USD 516.91 million, reaffirming the historical reliance on vertical and deviated wells in clastic reservoirs. Well-workover intensity increased 12% year-over-year as operators countered natural decline, and downhole chemical programs were expanded to manage scale and asphaltene buildup. Such interventions have deferred steep production drops; however, without more aggressive EOR adoption, incremental gains will taper off toward the end of the decade.
Unconventional resource development remains absent. The high cost of hydraulic fracturing fluids, limited water availability, and a lack of proppant supply chains are primary barriers. Should government incentives materialize, early exploration of low-permeability sandstones in the northern Melut Basin could cultivate a fledgling unconventional segment, adding future depth to the South Sudan oil and gas upstream market.
By Service:
Development spending outweighs exploration, but the gap is narrowingDevelopment and production services captured 69.92% of 2025 revenues, reflecting the industry’s emphasis on restoring pre-war capacity. Line-pipe replacement, pump upgrades, and surface-facility debottlenecking account for the majority of expenditures, as operators focus on stabilizing throughput at existing central processing facilities.
Exploration services, despite representing just 18.34% of current spend, are forecast to grow at a 4.66% CAGR, driven by seismic acquisition linked to the 2021-25 licensing rounds. Modern 3-D seismic, gravity gradiometry, and high-resolution magnetotellurics are being deployed to illuminate subsalt structures. If early results prove promising, appraisal drilling could accelerate from 2027 onward, gradually rebalancing the service mix within the South Sudan oil and gas upstream market.
Geography Analysis
The bulk of production is clustered in the northern states of Unity and Upper Nile, which collectively contributed more than 95% of national output in 2025. Proximity to the Greater Nile and Petrodar trunk pipelines shortens evacuation time to Port Sudan, keeping transportation costs below USD 9/bbl. However, the singular export corridor exposes the entire South Sudan oil and gas upstream market to conflict-related shutdowns across the border.
The central Jonglei Basin remains under-explored, yet airborne gravity surveys suggest stacked fluvial-deltaic sandstones with reservoir potential. Infrastructure access is limited, but a USD 778 million highway project financed by parliamentary appropriation is under construction to link Jonglei to Ethiopia’s Gambella region, ultimately offering a Djibouti export route. This corridor could lower dependence on Sudan and enhance regional liquidity, broadening the geographic reach of the South Sudan oil and gas upstream market.
Southern regions such as Central Equatoria host minor prospective acreage near the Ugandan border. Though politically stable, they lack processing facilities and pipeline tie-ins. Future activity will hinge on whether the proposed Lamu pipeline spur passes within a commercially viable distance. If realized, southern licenses could see their first exploration wells by the early 2030s, adding new growth vectors to the South Sudan oil and gas upstream market.
Regulatory Landscape
South Sudan's upstream sector is governed primarily by the Petroleum Act 2012, which assigns the Ministry of Petroleum as sector manager and places the National Petroleum and Gas Corporation (Nilepet) at the center of state participation across the value chain. In April 2026, the Ministry signaled tighter license discipline by announcing it would not renew Oranto Petroleum's EPSA for Block B3, citing unmet seismic and drilling obligations. This reinforced work-program performance as a gating item for acreage retention and new awards.
Operational compliance requirements are anchored in HSE management systems overseen by the Ministry of Petroleum, including site-specific environmental and social impact assessments (ESIAs) and contractor adherence to recognized international industry practices and continuous-improvement approaches. Flood-related spill exposure has elevated the practical importance of environmental controls under the Petroleum Act 2012, while the market continues to be shaped by administrative and contractual actions connected to crude sales and financing (including the BB Energy dispute). These actions influence the availability of advance-payment mechanisms used by the state and operating JOCs.
Competitive Landscape
Market leadership remains concentrated among Asian national oil companies. China National Petroleum Corporation (CNPC) and Sinopec jointly operate the Greater Pioneer and Dar Petroleum blocks and, together with India’s ONGC Videsh, account for more than 80% of 2024 operated output. Their long-term investment horizon and sovereign backing provide a resilience advantage during periods of geopolitical volatility.
Petronas’s announced exit in 2024 introduced near-term uncertainty. While the Malaysian firm pursues ICSID arbitration over blocked asset transfers, South Sudan’s Nilepet has assumed interim operatorship to avoid operational discontinuities. The episode highlights the heightened risk of contract sanctity, potentially increasing financing costs for future upstream projects in the South Sudan oil and gas market.(5)
Competitive differentiation now centers on uptime optimization rather than acreage accumulation. CNPC has implemented predictive-maintenance analytics, which have reduced unplanned downtime by 6% within one year, whereas Sinopec is testing polymer flooding to enhance recovery factors in Block 4. Smaller independents seek niche positions in frontier blocks where their agility and lower overheads can offset scale disadvantages.
South Sudan Oil And Gas Upstream Industry Leaders
-
Nile Petroleum Corporation
-
Niger Delta Exploration & Production Plc
-
ONGC Videsh Limited
-
Oranto Petroleum
-
Petroliam Nasional Berhad (PETRONAS)
- *Disclaimer: Major Players sorted in no particular order

South Sudan Oil And Gas Upstream Market Companies Covered in this Report
- China National Petroleum Corp. (CNPC)
- Nile Petroleum Corp. (Nilepet)
- ONGC Videsh Ltd.
- Sinopec Group
- Dar Petroleum Operating Co.
- Greater Pioneer Operating Co.
- Sudd Petroleum Operating Co.
- Strategic Fuel Fund (SFF)
- Wildcat Petroleum plc
- Tri-Ocean Energy
- Niger Delta Exploration & Production plc
- Oranto Petroleum
- National Upstream Solutions
- Nile Drilling & Services
- SIPET Engineering & Consultancy
- Nile Delta JV
- Dietsmann Nile S.A.
- NIYAT Oilfield Services
- Savannah Energy plc
- Trinity Energy Ltd.
Market Opportunities and Future Outlook
Near-term whitespace is concentrated in field rehabilitation, brownfield drilling, and production-optimization services across the core producing areas in Unity and Upper Nile, where onshore operations dominated 2025 activity. The 2026 production rebound disclosed by operating entities, including GPOC's reported increase to about 60,000 bpd and DPOC reporting output over 100,000 bpd from Blocks 3 and 7, expands the spend envelope for workovers, integrity repairs, artificial lift upgrades, and reservoir studies aimed at countering mature-field decline.
A second opportunity set is tied to governance and commercial reforms around crude marketing and operator solvency, which directly affect the pace of upstream work programs and contractor payment cycles. Ministerial Order No. 04-2026 establishing a high-level committee to review crude oil sales and marketing, together with Nilepet's May 2026 settlement of USD 172 million in arrears (including obligations to Petronas) and the July 2026 partial settlement actions connected to BB Energy cargo financing, create room for tighter contracting standards, improved procurement regularity, and renewed participation interest in blocks recycled through enforcement actions such as the reopening of Block B3. Gas monetization also offers a practical expansion lane where associated-gas gathering and flare-reduction initiatives can align with the report's 2026 LPG project milestone, supporting domestic offtake while upstream liquids output is restored.
Recent Industry Developments in South Sudan Oil And Gas Upstream Market
- July 2026: South Sudan reached a partial settlement to ease restrictions linked to its dispute with commodity trader BB Energy, and reports referenced the award of crude cargoes to restore access to crude financing arrangements. The step reduced near-term constraints around oil-backed prepayment structures and supported cash-flow continuity for upstream operations that depend on export proceeds.
- May 2026: Nile Petroleum Corporation (Nilepet) announced it cleared about USD 172 million in operational arrears owed to partners including Petronas, enabling it to exit default status across joint operating companies. This improved counterpart confidence for vendors and JOC partners and helped unblock approvals and spend tied to rehabilitation and production-restoration programs.
- August 2024: Petronas initiated ICSID arbitration proceedings after its divestment process in South Sudan stalled, escalating the dispute into a formal international legal process. This increased uncertainty around asset transfers and work-program decisions in affected blocks, with spillover effects on investment sentiment and contracting pace across the upstream sector.
South Sudan Oil And Gas Upstream Market Report Scope and Research Methodology
Market Definition and Coverage
For this report, the South Sudan upstream oil and gas market covers the value of activities that enable crude oil and natural gas exploration, field development, and production inside South Sudan, including related upstream services that are directly tied to these operations.
Scope exclusions: Midstream transportation, refining, fuel marketing, and general power generation spending are excluded unless they are part of an upstream project scope.
Segments Covered in This Report
- By Location of Deployment
- Onshore
- Offshore
- By Resource Type
- Crude Oil
- Natural Gas
- By Well Type
- Conventional
- Unconventional
- By Service
- Exploration
- Development and Production
- Decommissioning
Data Sources, Market Sizing, and Validation
Desk Research
Desk research started with public production and macro baselines so the model stays tied to what the country can actually produce and sell. We referenced sources such as OPEC statistical publications, IEA oil market series, World Bank macro indicators, UN Comtrade trade statistics, and open government or regulator releases where available.
Next, we used operator and partner disclosures like annual reports, project updates, and investor presentations to map the active asset base, restart timelines, and typical cost and pricing assumptions for South Sudan-linked upstream projects. A paid subscription for company financials and intelligence was used selectively to normalize fragmented disclosures, and it was cross-checked with reputable press and association websites. These examples are not exhaustive, and many other public sources were reviewed for validation and clarification.
Primary Interviews and Surveys
We interview and survey regulators, operators, service providers, advisers, and finance or procurement leaders active in South Sudan. Their responses help clarify field activity, contract rates, drilling plans, service mix, and pipeline access, while also testing secondary production and trade figures. Analysts re-contact contributors when responses conflict with observed South Sudan production or trade indicators.
Distribution of primary research fieldwork respondents
| Company type | Respondent position |
|---|---|
| Top tier: 28% | CXOs: 18% |
| Mid tier: 50% | Functional/Unit leaders: 32% |
| Smaller Players: 22% | Managers: 50% |
Market-Sizing & Forecasting
Sizing was built using top-down logic where production and export signals are reconstructed into an upstream value pool, and then translated into market value using practical price and activity assumptions for South Sudan crude oil and natural gas production. The outputs were corroborated with selective bottom-up approximations, such as sampled field-level activity checks and a reasonableness roll-up of typical service intensity against producing volumes, which helped correct for data gaps.
Key inputs used in the model included crude production volumes, the share of shut-in versus producing capacity, realized crude price proxies for the relevant crude slate, drilling and workover activity direction, and the timing of asset restarts and maintenance cycles. Where field-level detail was missing, we applied conservative ranges that were agreed with interview feedback, and the range was narrowed after checking consistency with export capacity and historic operating patterns.
For forecasting, scenario analysis was used, since the outlook depends heavily on restart reliability, pipeline and export continuity, and policy or security disruptions that can change volumes quickly in-country. The final forecast path follows the scenario most consistently supported by expert feedback, and it is further sanity-checked against macro constraints like investment appetite and government revenue dependence.
Data Validation & Update Cycle
Model results are checked against independent signals, including South Sudan production trend lines, export direction, and public price movements, and then reviewed for outliers before sign-off. When a variance is large, we re-check the year mapping, currency conversion timing, and the implied price per barrel before the figures are finalized.
Reviews happen in steps, starting with analyst peer checks on assumptions and followed by a final internal review that focuses on consistency across the narrative and exhibits. Reports are refreshed annually, and interim updates are made when material events occur, such as major production restarts, prolonged shutdowns, or policy actions that change the operating environment in South Sudan. Before delivery, a fresh pass is completed so clients receive the latest updated view.
Mordor Intelligence's South Sudan Oil and Gas Upstream Market Size Compared With Other Published Estimates
Published market sizes for South Sudan upstream oil and gas can look far apart, even when they describe the same country and time window. The difference usually comes from what is counted as upstream value, how prices are applied to volumes, and whether the estimate is updated when on-the-ground conditions shift.
The benchmark table shows a wide spread, and in Mordor Intelligence's model the value is tied to upstream exploration, development, and production activity rather than counting broader oil and gas industry revenues or large adjacent infrastructure budgets. Some estimates also appear to lean on aggressive price and activity assumptions over long horizons, while others blend in trade, downstream, or economy-wide energy spending that is not directly linked to upstream operations.
Benchmark comparison
| Source | Market Size | Gaps in Research Methodology |
|---|---|---|
| Mordor Intelligence | USD 534.02 M (2026) | |
| Global Consultancy A | USD 9.63 B (2024) | Uses a much broader upstream value interpretation and appears to blend in large investment and infrastructure spending that is not limited to annual upstream activity value, which inflates the addressable total versus an activity-linked approach. |
| Industry Publisher B | USD 1.80 B (2026) | Likely applies higher per-barrel value capture or includes a wider set of upstream-related contract and investment categories, and the sizing seems less constrained by near-term production and restart realities in the country. |
Looking across the three figures, the main takeaway is that scope and the link between volumes and pricing explain most of the gap. When the size is anchored to producing volumes, practical price realization, and realistic activity intensity, the result is easier to trace, update, and repeat year to year.
Key Questions Answered in the Report
What is the current size of the South Sudan oil and gas upstream market?
The market reached USD 534.02 million in 2026 and is projected to reach USD 628.53 million by 2031.
Which segment is growing the fastest within South Sudan’s upstream sector?
Offshore activities, though still tiny, are forecast to post a 4.85% CAGR through 2031.
How dependent is South Sudan on crude oil compared with natural gas?
Crude oil generated 99.66% of 2025 revenues, while gas contributed less than 1% but is growing at a 4.63% CAGR.
Which companies dominate production in South Sudan?
CNPC, Sinopec, and ONGC Videsh together account for more than 80% of operated output.
What major infrastructure project could reduce export risk?
The proposed Lamu pipeline under the LAPSSET corridor would bypass Sudan and provide a direct route to the Kenyan coast.
How is the government attracting new exploration capital?
Competitive licensing rounds with fiscal-stability clauses and local-content incentives are bringing mid-size independents into under-explored blocks.