
Market Overview
| Study Period | 2021 - 2031 |
|---|---|
| Forecast Data Period | 2026 - 2031 |
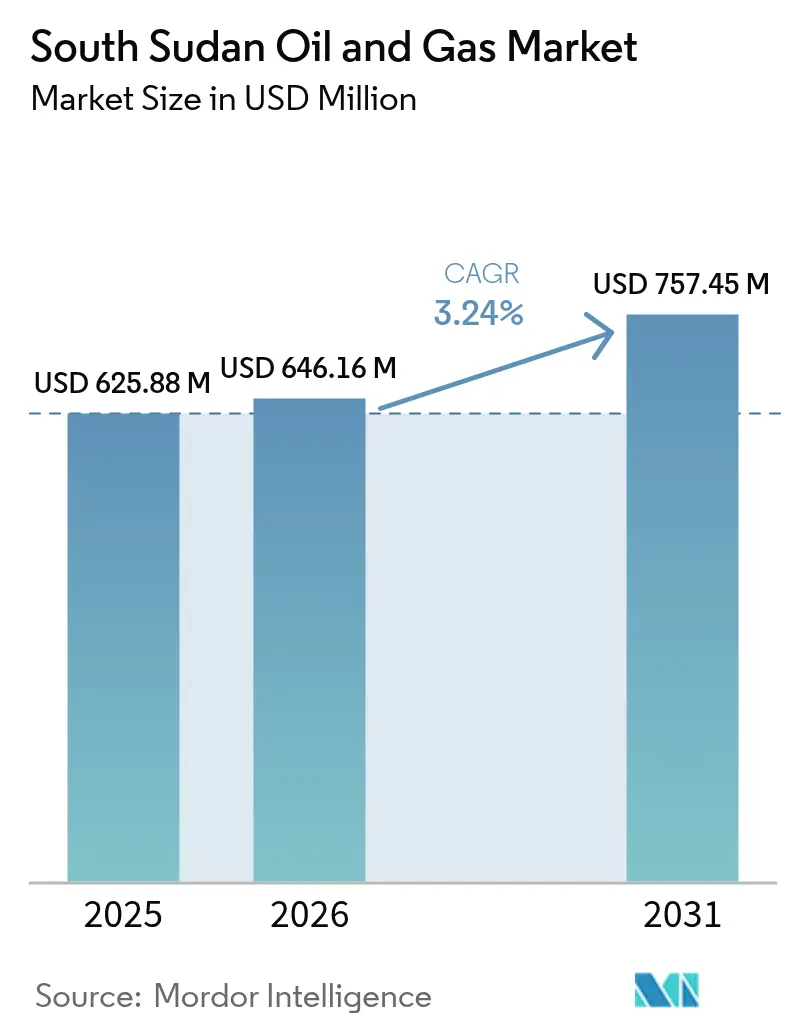
| Base Year Market Size (2025) | USD 625.88 Million |
| Market Size (2026) | USD 646.16 Million |
| Market Size (2031) | USD 757.45 Million |
| Growth Rate (2026 - 2031) | 3.24 % |
| Market Concentration | High |
Major Players *Disclaimer: Major Players sorted in no particular order Image © Mordor Intelligence. Reuse requires attribution under CC BY 4.0. | |
South Sudan Oil And Gas Market Analysis by Mordor Intelligence
South Sudan Oil And Gas Market size in 2026 is estimated at USD 646.16 million, growing from 2025 value of USD 625.88 million with 2031 projections showing USD 757.45 million, growing at 3.24% CAGR over 2026-2031.
Modest expansion stems from the restart of exports through Sudan’s pipeline network, incremental gains from optimizing mature fields, and renewed exploration interest in underexplored basins. Upstream activity will continue to dominate revenue, as the country relies on crude exports for more than 90% of its public income. Infrastructure constraints, frequent security incidents, and unresolved arbitration disputes temper the growth outlook, yet sustained Chinese investment and a pending diversification of export corridors provide upside potential. Enhanced-oil-recovery programs, combined with digital well surveillance, are expected to increase recovery factors and slow natural decline rates in legacy fields, thereby mitigating supply risks associated with external disruptions.[1]
Key Report Takeaways
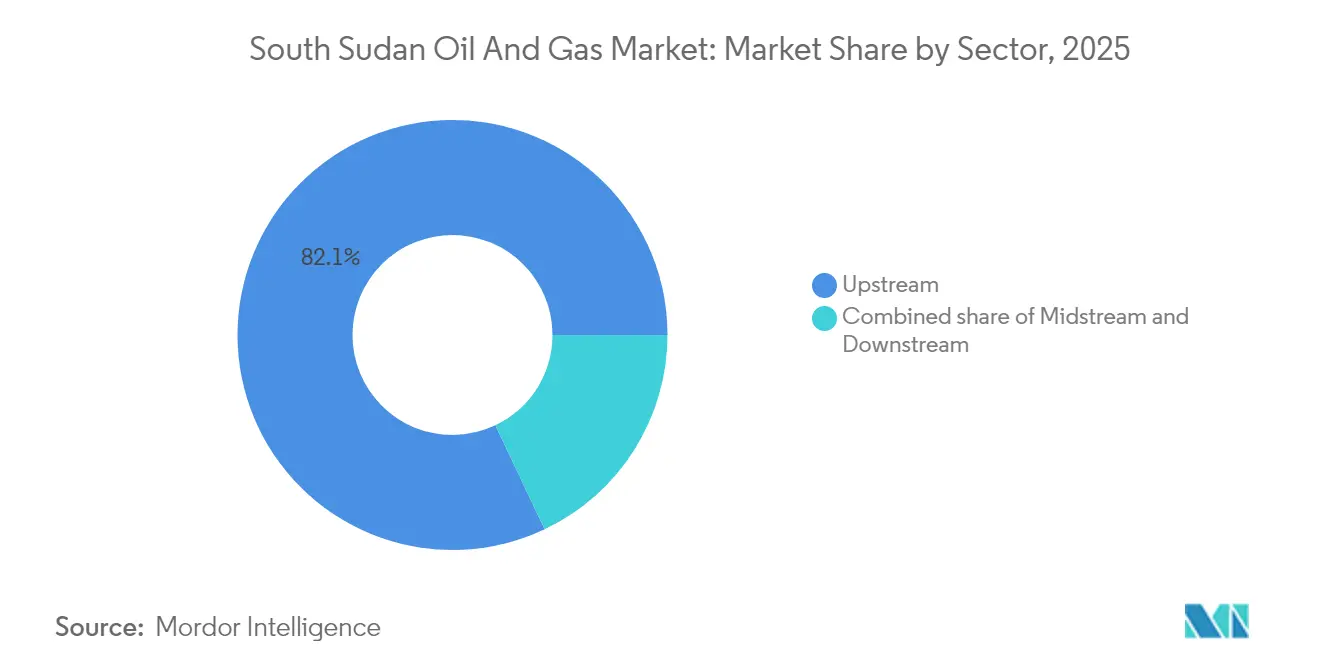
- By sector, upstream operations held 82.05% of the South Sudan oil and gas market share in 2025 and are expected to grow at a 3.47% CAGR through 2031.
- By location, onshore assets accounted for 99.78% share of the South Sudan oil and gas market size in 2025, whereas offshore prospects post the fastest 4.92% CAGR over the outlook period.
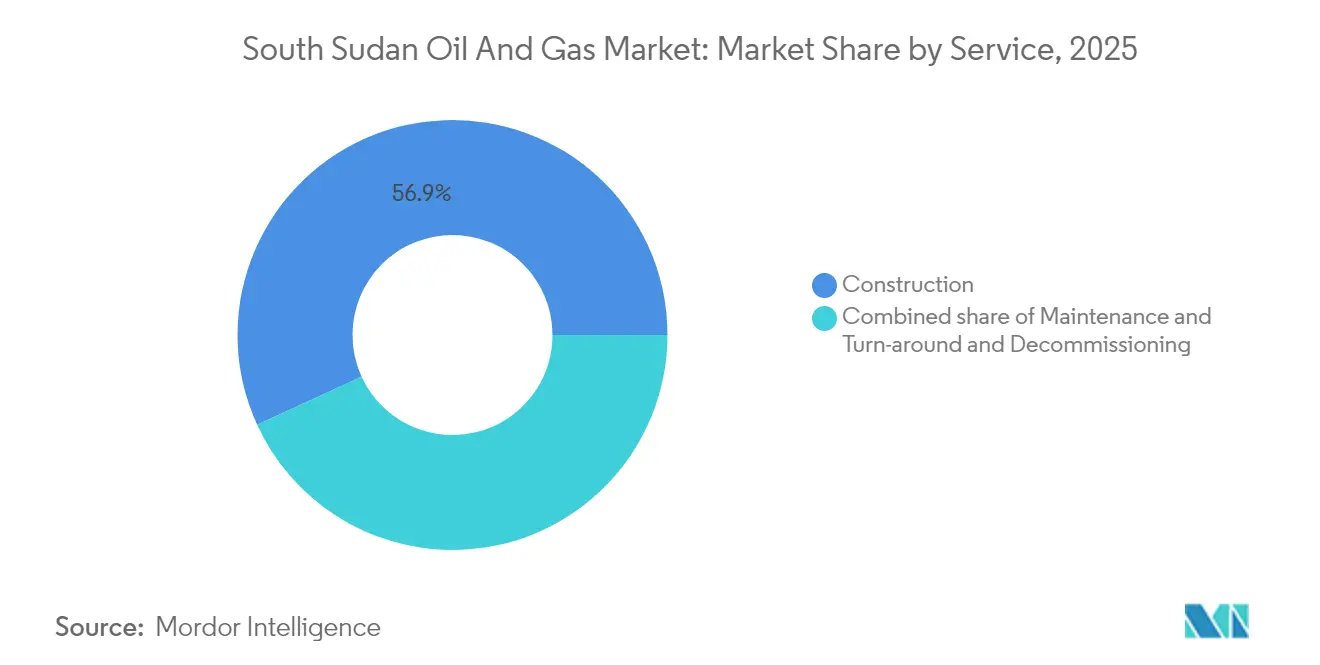
- By service, construction led with 56.85% revenue share in 2025, while maintenance and turnaround services are forecast to expand at a 4.32% CAGR to 2031.
Note: Market size and forecast figures in this report are generated using Mordor Intelligence’s proprietary estimation framework, updated with the latest available data and insights as of 2026.
South Sudan Oil And Gas Market Trends and Insights
Drivers Impact Analysis*
| Driver | (~) % Impact on CAGR Forecast | Geographic Relevance | Impact Timeline |
|---|---|---|---|
| Restart of exports via Sudan pipeline (2025) | +1.2% | National, with concentration in Unity, Upper Nile states | Short term (≤ 2 years) |
| Untapped reserves & 2021 licensing round | +0.8% | National, focus on Jonglei, Eastern Equatoria exploration blocks | Medium term (2-4 years) |
| Chinese and regional investment in alternative export routes | +0.6% | National, with infrastructure spanning to Kenya, Djibouti corridors | Long term (≥ 4 years) |
| Enhanced-oil-recovery rollout in mature Nile/Dar fields | +0.4% | Unity State, Upper Nile State mature field clusters | Medium term (2-4 years) |
| Debt-for-oil restructuring incentives | +0.3% | National, with primary impact on government revenue streams | Short term (≤ 2 years) |
| Satellite-enabled digital oilfield monitoring | +0.2% | National, with early adoption in major producing blocks | Medium term (2-4 years) |
| Source: Mordor Intelligence | |||
Restart of Exports via Sudan Pipeline Creates Revenue Recovery Pathway
The reopening of Sudan’s pipeline in 2025 ended an eight-month pause that had stripped South Sudan of roughly USD 100 million in monthly receipts. Wax-management upgrades at six pumping stations now enable continuous Dar Blend flow, which typically accounts for three-quarters of national exports. Joint technical committees between Juba and Khartoum maintain real-time oversight, reducing the chance of protracted outages. Improved cash flow supports overdue capital expenditures in gathering systems and well workovers, which lift output toward the pre-shutdown target of 150,000 barrels per day. Renewed confidence in midstream reliability also frees up budgetary space for social spending, thereby boosting political stability that underpins exploration commitments.[2]
Untapped Reserves Drive Strategic Licensing Expansion
Blocks A2, A5, B1, B4, and D2 together cover more than 60,000 square kilometers and remain mostly unmapped. The 2021 bid round attracted African independents eager to secure frontier acreage at a low entry cost while oil prices hovered above USD 60 per barrel. The state retains minority stakes of 5-10%, ensuring public benefit without scaring off investors seeking operatorship. Ongoing seismic programs aim to lift national geological coverage from under 5% in 2021 to 30% by 2025, sharply narrowing subsurface risk. Early success in Block B3 underscores the potential for expansion outside the legacy Muglad and Melut basins, indicating a multi-decade runway for growth.
Chinese Investment Catalyzes Alternative Export Infrastructure
China National Petroleum Corporation’s 41% share in Dar Petroleum gives it an economic incentive to de-risk delivery routes. Feasibility work on a South Sudan–Djibouti pipeline tied to the LAPSSET corridor would bypass Sudan entirely. Beijing-backed lenders have proven their ability to finance multibillion-dollar, cross-border lines, as shown by the 1,600 km Greater Nile conduit, which was built in 2.5 years. South Sudan’s recent land purchase in Djibouti signals political backing, while phased construction could align with field-life extension plans, keeping tariff exposure affordable. Route diversification also improves bargaining leverage on existing transit fees, raising long-term netbacks.
Enhanced Oil Recovery Technologies Extend Field Life Cycles
Primary recovery rates in many Nile and Dar reservoirs have dropped below 20%. Pilot water-floods demonstrate incremental gains of 8-10 percentage points, and integrated digital monitoring cuts downtime by predicting sub-surface pressure drops. Shallow depths of 1,000-3,000 meters reduce water-injection costs, widening economic margins when crude trades above USD 60 per barrel. The government aims to expand EOR projects by 30% by 2027, with support from Chinese technical teams that already manage similar programs in Xinjiang and Daqing. Successful rollouts could add 20-30% to recoverable reserves, smoothing national output beyond 2035.
Restraints Impact Analysis*
| Restraint | (~) % Impact on CAGR Forecast | Geographic Relevance | Impact Timeline |
|---|---|---|---|
| Reliance on conflict-prone Sudan export infrastructure | -0.9% | National, with critical dependency on Port Sudan pipeline route | Short term (≤ 2 years) |
| Natural decline of mature blocks | -0.6% | Unity State, Upper Nile State legacy production areas | Long term (≥ 4 years) |
| Arbitration liabilities risking cargo seizure | -0.4% | Global, affecting international crude sales and financing | Medium term (2-4 years) |
| ESG-driven financing squeeze on heavy crude | -0.3% | Global, with impact on international project financing | Long term (≥ 4 years) |
| Source: Mordor Intelligence | |||
Export Infrastructure Vulnerability Constrains Market Stability
South Sudan ships every barrel through Sudan, paying USD 24 per barrel in combined transit and processing charges. Ongoing conflict fragments control of six heating stations, which are required for the flow of waxy Dar Blend. Even brief diesel shortages can force shut-ins that damage reservoir pressure. Insurance premiums and letter-of-credit costs rise each time hostilities flare, eroding netbacks and complicating project finance for new blocks. Until an alternative line is operational, the country’s fiscal health remains hostage to external security dynamics.[3]
Arbitration Disputes Create Operational and Financial Risks
Outstanding claims tied to legacy cost-recovery terms expose crude cargoes to attachment orders in foreign courts. Petronas exited in 2024 after a two-year divestment process marred by legal wrangling, underscoring the perceived risk of jurisprudence. Banks that normally extend pre-export credit tighten lending when asset titles face challenges, slowing capital expenditure cycles. New entrants, such as Wildcat Petroleum, require clear indemnities before finalizing farm-ins, which can delay field redevelopment. Government efforts to streamline arbitration through a specialized commercial court could unlock fresh capital if implemented as planned.
*Our forecasts treat driver/restraint impacts as directional, not additive. The impact forecasts reflect baseline growth, mix effects, and variable interactions.
Segment Analysis
By Sector: Upstream Operations Underpin Revenue Concentration
Upstream activities generated 82.05% of the total value in 2025, confirming the central role of crude extraction in the South Sudan oil and gas market. The combination of favorable geology and limited domestic processing capacity channels virtually all investment toward drilling, completion, and well interventions. CNPC and Sinopec anchor two major operating consortia, setting cost norms that shape service pricing and procurement schedules. The South Sudan oil and gas market size attributable to upstream is projected to expand at a 3.47% CAGR through 2031, supported by EOR deployment that offsets natural decline. A modest increase in national training programs is slated to raise local labor participation from 12% in 2025 to 25% by 2030, aligning fiscal objectives with skill-transfer ambitions.
Midstream and downstream segments lag because refining projects remain on hold pending firm financing. The government favors exporting high-value Dar and Nile blends to achieve fiscal stability, rather than absorbing the debt burden of a domestic refinery. However, successful alternative-corridor plans could spur gradual midstream diversification as new tank farms and feeder lines become bankable. Field gas monetization, presently flared, may emerge as a niche downstream opportunity once output stabilizes and internal markets mature.

By Location: Onshore Dominance Persists but Offshore Interest Builds
Onshore fields contributed 99.78% of 2025 volume, reflecting three decades of development inside the Muglad and Melut rift basins. Existing gathering lines, in-country rig fleets, and shallow depths keep lifting costs below USD 20 per barrel, ensuring economic resilience even during market down-cycles. Offshore prospects in the Red Sea are attracting growing attention due to their prospective source rock similarities with the prolific Sudanese and Saudi Arabian shelves. The offshore slice of the South Sudan oil and gas market size is currently small, yet it is forecast to post a 4.92% CAGR between 2026 and 2031, following the 2021 bid round, which included littoral acreage. Interest from international players with deep-water experience could accelerate if political risk coverage is available at competitive premiums.
Terrain challenges persist across swamps and seasonal floodplains, raising logistics costs for onshore expansion in southern blocks. Planned modular roads and a fiber-optic link financed by regional development banks will help operators manage data flow and equipment mobilization, further enhancing onshore productivity while de-risking early offshore appraisal wells.
By Service: Construction Peaks, Maintenance Takes the Baton
Pipeline repairs, flow station builds, and rig camp refurbishments drove construction to a 56.85% revenue share in 2025. As greenfield spend tails off, operators switch focus to facility uptime, pushing maintenance and turnaround services to a 4.32% CAGR, the fastest among service lines. Predictive analytics tools reduce unscheduled downtime by flagging equipment failure before it occurs, enabling leaner parts inventories and lowering lifting costs by up to USD 1.50 per barrel. The rising complexity of well completions, including multistage fracs for tight sand intervals, supports demand for specialty services even as aggregate drilling counts remain flat. Over the forecast horizon, mature-field decommissioning is expected to emerge as a niche, although clear abandonment guidelines are still pending.
Geography Analysis
Unity State and Upper Nile State together supplied nearly 85% of the national production in 2025, underscoring their strategic importance in the South Sudan oil and gas market. The Unity cluster’s Heglig and Bamboo fields produce a waxy, sweet-grade oil that trades at discounts during the winter months due to a higher pour-point risk; however, their low sulfur content keeps refinery demand stable. Upper Nile’s medium-sweet Nile blend enjoys steady off-take from Indian and Malaysian refiners under long-running supply contracts.
Jonglei and Eastern Equatoria have emerged as frontier growth zones since the 2021 licensing round opened, with five large blocks being allocated across both states. Early seismic suggests structural traps analogous to producing reservoirs farther north, giving explorers confidence despite scant data. Successful wells here would shift production centers southward, requiring pipelines to either east to Kenya’s Lamu port or northeast to the proposed Djibouti terminal. The government earmarks 20% of its annual petroleum revenue for a regional stabilization fund, which finances feeder roads and healthcare, thereby creating a social buffer that reduces local conflict risk and encourages operator entry.
Security conditions remain the primary geographic determinant of capex allocation. Community grievance mechanisms, underpinned by CNPC-funded social programs, lower protest frequency around existing sites, yet flare-related air-quality complaints persist. Improved dialogue through county-level petroleum committees cuts permitting delays in comparatively peaceful areas, setting the stage for broader geographic diversification of the South Sudan oil and gas market by the late 2020s.
Regulatory Landscape
South Sudan’s petroleum sector is governed primarily by the Petroleum Act, 2012, which provides the legal basis for upstream licensing and production sharing and sets sector oversight under the Ministry of Petroleum and Nile Petroleum Corporation (Nilepet). For day-to-day compliance, the Ministry’s Health, Safety and Environment framework (including the HSE Systems regulation built around a Plan-Do-Check-Act approach) defines contractor obligations for field development, operations, and incident management.
In 2026, enforcement and policy actions tightened around contract performance and state control of hydrocarbons-linked trade. The Ministry of Petroleum announced the non-renewal of Oranto Petroleum’s EPSA for Block B3, citing failure to meet work program obligations, which signals closer scrutiny of exploration commitments. On the downstream side, the government issued directives to route fuel imports through the Kenya-South Sudan Government-to-Government arrangement and communicated a transition toward South Sudan Energy, reinforcing a more centralized approach to refined-product procurement and supply oversight.
Competitive Landscape
The South Sudan oil and gas market features a two-tier structure. Three Chinese state-owned majors—CNPC, Sinopec, and CNOOC—partner with ONGC Videsh to control all producing fields, leveraging decades of drilling experience and access to concessional funding. Their combined output share topped 70% in 2024, granting cost advantages through bulk procurement and shared service fleets. Petronas’s 2024 exit opened space for new entrants. Wildcat Petroleum seeks to assume the vacated stakes, while Savannah Energy eyes exploration blocks along the Kenyan border.
Service competition remains fragmented. Schlumberger and Baker Hughes deliver high-end down-hole services amid security-related site restrictions. China Petroleum Engineering & Construction Corporation dominates large-scale EPC work, thanks to bundled financing provided via Chinese policy banks. Local player Nile Drilling & Services holds a strong position in rig supply and basic well services, benefiting from government mandates that expand local content. Digital technology adoption is a pivotal differentiator. Operators that integrate satellite imagery and cloud-based SCADA reduce non-productive time by up to 7%, translating into lower unit costs and a natural edge during bid rounds.
The nationalization roadmap unveiled in 2022 aims to lift Nile Petroleum Corporation’s operating share, but skill gaps and capital intensity compel continued reliance on strategic alliances with experienced foreign partners. As a result, the market will likely remain moderately concentrated through 2030, with technology leadership outweighing simple acreage count in shaping long-term competitiveness.[5]
South Sudan Oil And Gas Industry Leaders
-
Nile Petroleum Corporation
-
Petroliam Nasional Berhad (Petronas)
-
China National Petroleum Corporation
-
ONGC Videsh Ltd.
-
Sinopec Group
- *Disclaimer: Major Players sorted in no particular order

Market Opportunities and Future Outlook
Near-term whitespace is concentrated in mature-field optimization and production reliability, where enhanced oil recovery, workovers, and digital monitoring can convert operational improvements into additional barrels without relying on new export infrastructure. In June 2026, official statements cited higher output levels across major producing systems, including contributions from Dar Petroleum (Blocks 3 and 7) and Greater Pioneer Operating Company (Blocks 1, 2, and 4). The Presidency also recognized GPOC’s increase from 44,000 to about 60,000 barrels per day, underscoring how brownfield programs and services tied to uptime, including maintenance, turnarounds, integrity management, and flow assurance, can support near-term value.
Beyond operations, trade, marketing, and legal structuring offer active opportunity areas, particularly around restoring access to crude financing and stabilizing offtake. In July 2026, South Sudan awarded three crude cargoes to BB Energy following a consent order at the London High Court that partially lifted constraints on advance payment arrangements through November 2026, pointing to continuing demand for compliant crude marketing, risk management, and structured finance solutions. For refined products, the Ministry of Petroleum’s June 2026 decision to nominate additional suppliers under the Kenya Government-to-Government arrangement supports logistics, storage, and distribution capacity that can improve supply continuity in a market with limited domestic refining and ongoing import dependence.
Recent Industry Developments
- July 2026: South Sudan reached a settlement framework with BB Energy over undelivered crude cargoes and awarded three crude cargoes to support renewed access to crude financing. The step aligned crude marketing with ongoing legal constraints while giving the government a route to normalize offtake and funding mechanisms tied to exports.
- June 2026: A London court upheld an injunction restricting the issuance of new oil prepayment contracts for South Sudan. The ruling narrowed the financing toolkit available to the state and pushed operators and traders toward alternative, more compliant trade and credit structures to support field operations and cargo sales.
- October 2024: Sudan’s provisional administration completed pipeline repairs linking South Sudan’s fields to Red Sea export terminals. Restored integrity on the export route reduced outage risk on the single critical corridor and provided a clearer basis for upstream work programs tied to sustained evacuation capacity.
Research Methodology Framework and Report Scope
Market Definition and Coverage
This market is sized as the total value generated from oil and gas activities taking place in South Sudan, covering spending and revenues linked to upstream, midstream, and downstream operations that support production, movement, and sale of hydrocarbons.
Scope exclusions: We exclude oil and gas activity outside South Sudan and any non-hydrocarbon energy value that is not directly tied to oil and gas operations.
Segmentation Overview
- By Sector
- Upstream
- Midstream
- Downstream
- By Location
- Onshore
- Offshore
- By Service
- Construction
- Maintenance and Turn-around
- Decommissioning
Data Sources, Market Sizing, and Validation
Desk Research
We start with public, traceable datasets that explain the country context and the operating reality for oil and gas in South Sudan. Key inputs are pulled from sources such as OPEC and IEA releases, World Bank macro series, UN Comtrade trade statistics, and UN or government publications that cover energy and fiscal accounts where available.
Next, the desk work is tightened using company annual reports, operator updates, and credible press coverage that indicate project restarts, pipeline constraints, and export conditions. Where financials are not fully visible, we also use paid subscriptions for company financials and intelligence, plus news and financials coverage, and then we reconcile those findings with import or export shipment-level signals where they exist. These are examples of what we use, and many other sources are reviewed for data collection, validation, and clarification during the study.
Primary Interviews and Surveys
Within South Sudan, we use interviews and surveys with CXOs, functional and unit leaders, managers, field service providers, transport specialists, distributors, and public-sector experts. Their views help validate production disruptions, pipeline use, project timing, service rates, and demand assumptions that are not fully visible in public records. Responses are used to close evidence gaps and test the final model through repeated checks.
Distribution of primary research fieldwork respondents
| Company type | Respondent position |
|---|---|
| Top tier: 22% | CXOs: 12% |
| Mid tier: 58% | Functional/Unit leaders: 33% |
| Smaller Players: 20% | Managers: 55% |
Market-Sizing & Forecasting
Sizing starts with a top-down build where production and export conditions are reconstructed from country level indicators for South Sudan, then translated into an addressable value pool for oil and gas activity inside the country. Once the headline value is established, it is cross-checked with selective bottom-up approximations, such as sampled volume-by-price calculations and roll ups of visible operator and service spending, which helps adjust totals when a single indicator looks overstated.
A few of the inputs that matter most here include crude output levels, export throughput constraints, realized crude pricing and differentials, pipeline availability and downtime patterns, and local refined product availability versus imports. Where data points are missing, assumptions are filled using ranges confirmed during interviews and then stress-tested so the final market number does not depend on one fragile datapoint. For forecasting, we lean on scenario analysis built around oil price paths, expected field activity, and infrastructure reliability, and the final year-by-year outlook is aligned to what primary respondents consider realistic under base case operating conditions.
Data Validation & Update Cycle
We validate outputs by comparing the model results with independent signals like production direction, export visibility, and the implied spend intensity per barrel, and then we investigate any sharp jumps before sign-off for South Sudan. When a variance is flagged, the assumptions behind the driver are reviewed and, if needed, primary contacts are re-engaged to confirm whether it is a one-off event or a structural shift.
Before publication, the work is reviewed in steps so unit conversions, currency timing, and year alignment are checked more than once. Reports are refreshed annually, with interim updates triggered by material events such as prolonged outages, major project sanctions, or policy changes that can move volumes or pricing, and then a final pre-delivery pass is completed to reflect the latest available information.
Mordor Intelligence's South Sudan Oil and Gas Market Size Compared Against Other Published Estimates
Different published market sizes for South Sudan oil and gas can look far apart even when they refer to the same country, because the value chain coverage and the pricing logic are not always consistent. Variations usually come from what parts of the industry are included, which year is treated as the base, and whether the numbers follow actual country activity signals or broad regional assumptions.
In this market, the biggest gap drivers are scope and what gets counted as market value. Some estimates focus only on upstream, while others focus only on downstream fuel and retail value, which changes the size by design. Another source of spread is pricing, because some models use international benchmarks without adjusting to country realized pricing and export constraints, and refresh timing also matters when there are outages or restart announcements that change yearly volumes.
Benchmark comparison
| Source | Market Size | Gaps in Research Methodology |
|---|---|---|
| Mordor Intelligence | USD 625.88 M (2025) | |
| Industry Publisher A | USD 1.15 B (2025) | This figure is downstream-only and includes retail sale value of petroleum products, which inflates totals versus an oil and gas value chain view that does not treat end-fuel retail as the full market. |
| Industry Publisher B | USD 625.88 M (2025) | This estimate is upstream-only, which can miss midstream and downstream activity that still occurs even when upstream volumes are constrained. |
The table mainly shows how selecting only one slice of the value chain shifts the reported number, even when the year matches. By keeping the value chain definition consistent and tying the build to production, export constraints, and price realization checks, the number stays comparable over time, which is the approach applied by Mordor Intelligence.
Key Questions Answered in the Report
How large is the South Sudan oil and gas market in 2026?
The South Sudan oil and gas market size is USD 646.16 million in 2026, with a projected rise to USD 757.45 million by 2031 at a 3.24% CAGR.
Which segment contributes most to national revenue?
Upstream operations account for 82.05% of value and remain the primary revenue engine through 2031.
What is the outlook for alternative export routes?
Feasibility studies on Djibouti and Kenya corridors are under way, with Chinese financing support, but commissioning is unlikely before the late 2020s.
Where do enhanced-oil-recovery projects focus?
Most EOR pilots target mature Nile and Dar fields in Unity and Upper Nile states, aiming to lift recovery factors by 20-30%.
Which service line is growing fastest?
Maintenance and turnaround services are forecast to expand at a 4.32% CAGR as operators prioritize uptime over new builds.
How concentrated is operator control?
The top five firms—largely Chinese majors—hold about 80% of production, indicating a high but not absolute concentration.