
Market Overview
| Study Period | 2021 - 2031 |
|---|---|
| Forecast Data Period | 2026 - 2031 |
| Base Year Market Size (2025) | 2.42 gigawatt |
| Market Volume (2026) | 3.27 gigawatt |
| Market Volume (2031) | 14.73 gigawatt |
| Growth Rate (2026 - 2031) | 35.10 % |
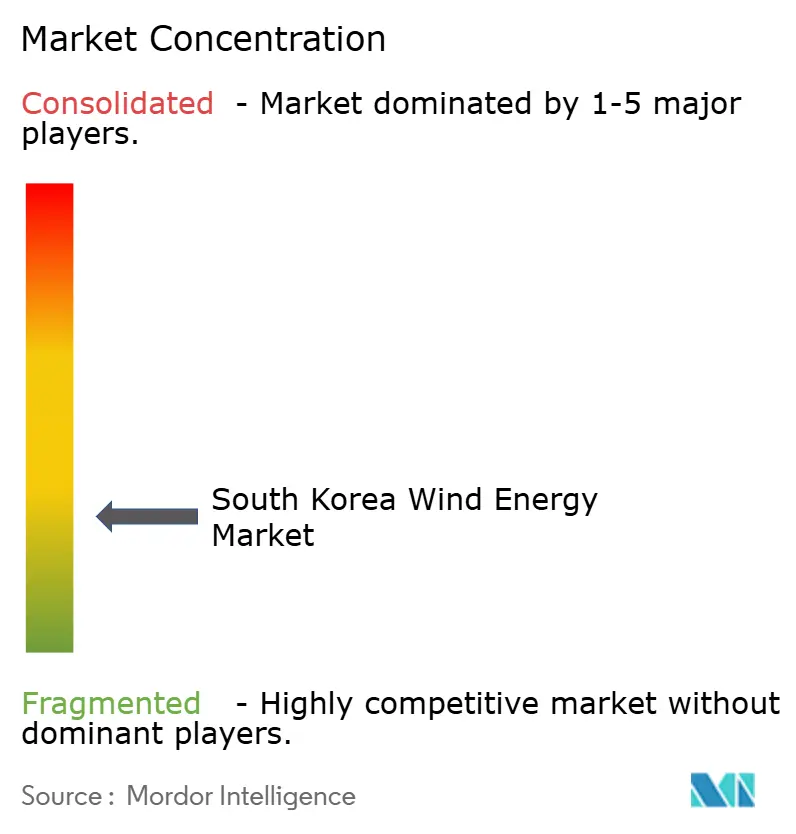
| Market Concentration | Low |
Major Players *Disclaimer: Major Players sorted in no particular order Image © Mordor Intelligence. Reuse requires attribution under CC BY 4.0. | |
South Korea Wind Energy Market Analysis by Mordor Intelligence
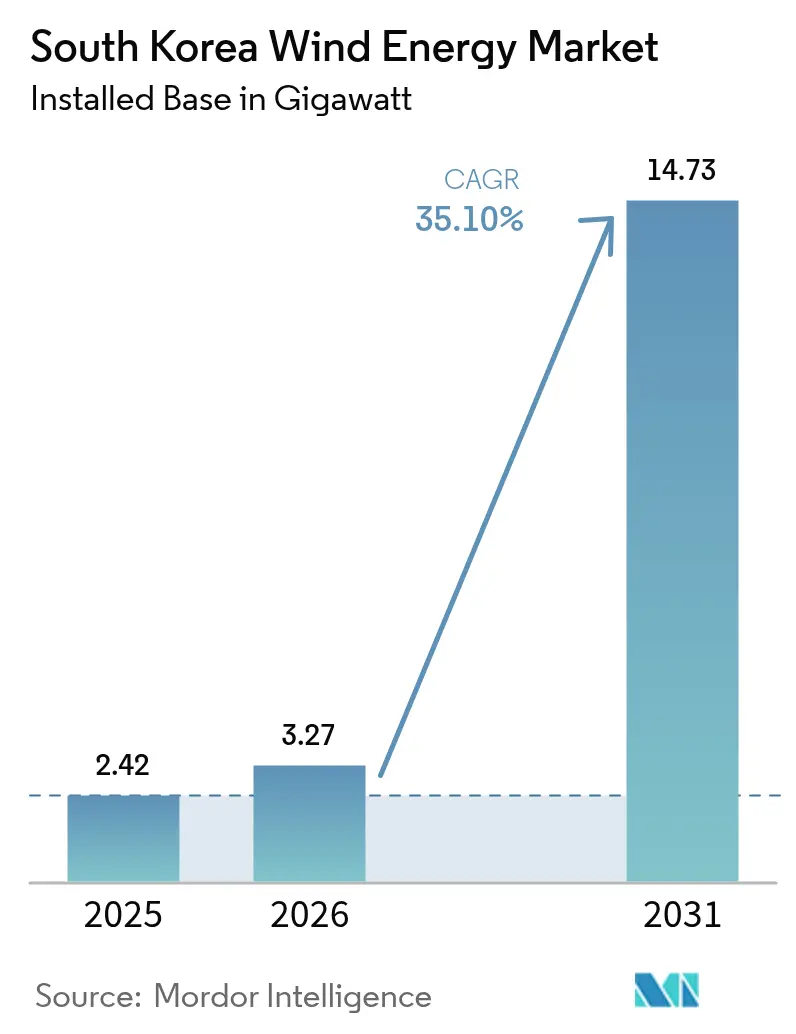
South Korea Wind Energy Market size in 2026 is estimated at 3.27 gigawatt, growing from 2025 value of 2.42 gigawatt with 2031 projections showing 14.73 gigawatt, growing at 35.10% CAGR over 2026-2031.
Strong policy support under the Green New Deal, rapid offshore build-out, and rising corporate power-purchase agreements (PPAs) underpin this sustained expansion. Developers are pivoting from incremental onshore additions toward utility-scale offshore arrays that leverage Korea’s shipbuilding capacity, export-credit insurance, and localized high-voltage cables to compress project timelines and costs. Floating-wind technology validated off Ulsan in 2024 now unlocks deep-water East Sea resources, while turbine upsizing to 8–15 MW platforms lowers balance-of-system costs and boosts capacity factors. Competition intensifies as European majors ally with chaebols, yet permitting, grid congestion, and typhoon-grade design standards cap near-term installation rates and pressure project returns.
Key Report Takeaways
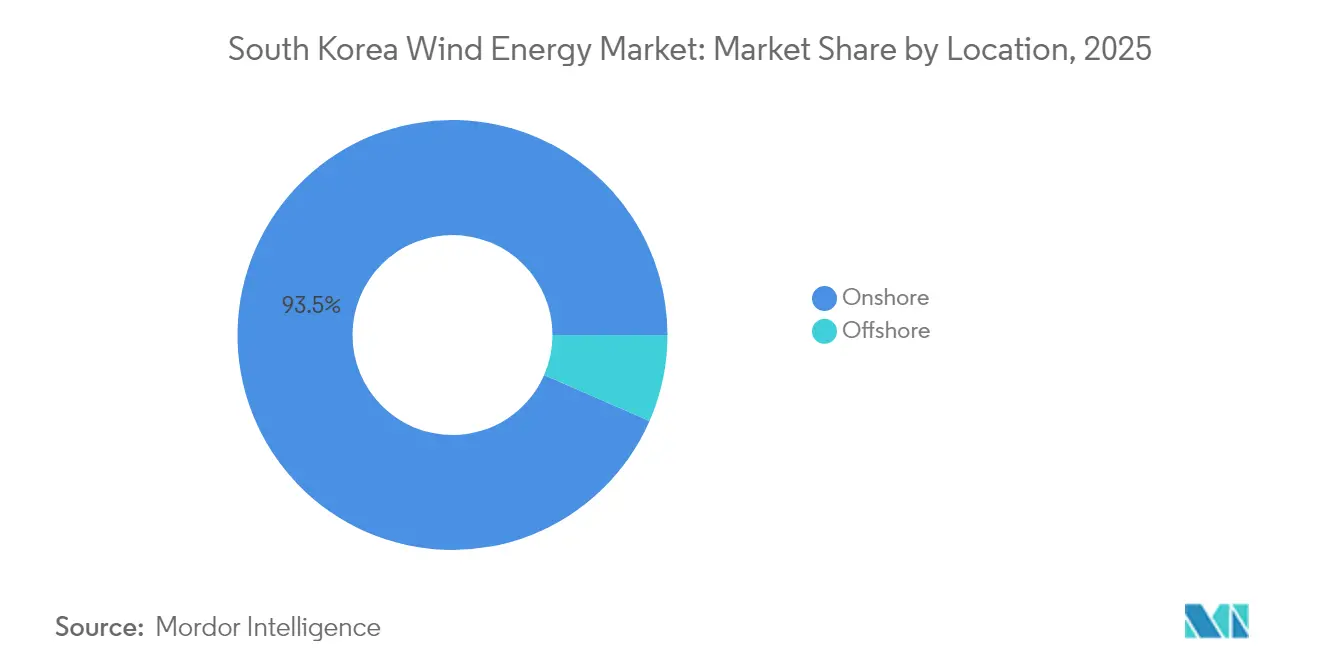
- By location, onshore wind held 93.45% of the South Korea wind energy market share in 2025, while offshore capacity is forecast to compound at 72.90% CAGR through 2031.
- By turbine capacity, the 3–6 MW class accounted for 66.90% of the South Korean wind energy market size in 2025; the above-6 MW segment is projected to expand at a 40.20% CAGR to 2031.
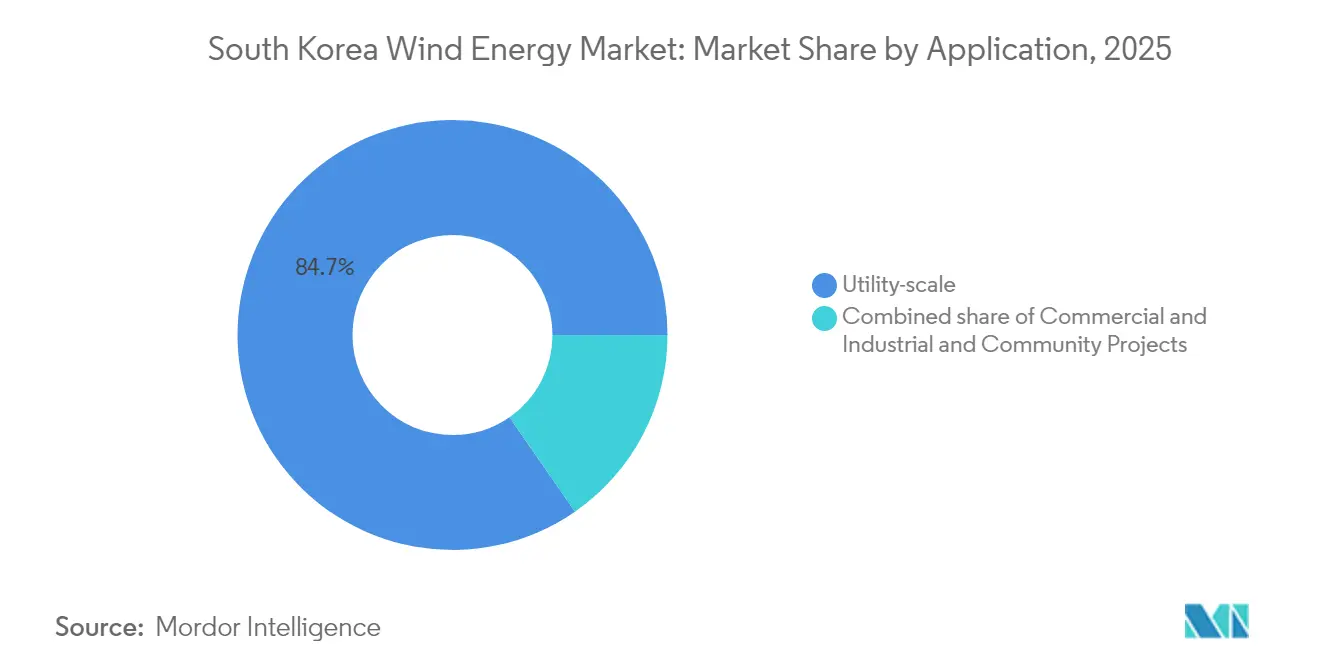
- By application, utility-scale projects captured 84.65% of the South Korea wind energy market size in 2025 and are slated to grow at a 38.10% CAGR over 2026-2031.
Note: Market size and forecast figures in this report are generated using Mordor Intelligence’s proprietary estimation framework, updated with the latest available data and insights as of 2026.
South Korea Wind Energy Market Trends and Insights
Drivers Impact Analysis*
| Driver | (~) % Impact on CAGR Forecast | Geographic Relevance | Impact Timeline |
|---|---|---|---|
| Green New Deal & 9th Basic Plan Mandating 12 GW Offshore by 2030 | +12.5% | National, Jeolla & Gyeongsang | Long term (≥ 4 years) |
| Floating-Wind Testbed off Ulsan Reducing Deep-Sea Project Risk | +6.8% | Ulsan, Busan, East Sea | Medium term (2-4 years) |
| Corporate PPAs From Korean Tech Giants Unlocking Long-Term Offtake | +5.2% | National, Seoul-Incheon belt | Medium term (2-4 years) |
| Jeju Carbon-Free Island 2030 Accelerating Onshore Repowering | +3.1% | Jeju Island | Short term (≤ 2 years) |
| Export Credit Insurance for Renewable OEMs Lowering Financing Cost | +2.9% | National | Medium term (2-4 years) |
| High-Voltage K-SUPCON Cable Localization Boosting Domestic Content | +4.3% | West & South Sea zones | Long term (≥ 4 years) |
| Source: Mordor Intelligence | |||
Green New Deal & 9th Basic Plan Mandating 12 GW Offshore by 2030
Government alignment between the Green New Deal stimulus and the 9th Basic Plan provides an enforceable target to install 12 GW of offshore wind by 2030, an eighty-five-fold jump from the 142 MW operating base. This statutory goal obliges the grid operator to finance transmission upgrades, while the draft Special Act on wind power promises consolidated permitting and clear service-level timelines. Jeollanam-do’s 75 trillion KRW investment program underpins local port deepening, substation upgrades, and training centers that shorten construction lead times. Policy coupling with the national hydrogen roadmap has widened the revenue stack, as offshore projects will supply green hydrogen electrolyzers co-located at the Sinan and Mokpo industrial zones. State-led coordination reduces offtake uncertainty, lowering capital-cost premiums for private developers. These measures anchor the medium-term uplift in the South Korean wind energy market outlook.
Floating-Wind Testbed off Ulsan Reducing Deep-Sea Project Risk
A 1 GW floating-wind testbed administered by the Korea Research Institute of Ships & Ocean Engineering validates mooring systems that withstand typhoon loads and 60-meter waves, derisking future deployments in Korea’s steep continental shelf waters.[1] Prototype trials confirm that 15 MW turbines mounted on semi-submersible hulls meet structural codes, and proximity to Ulsan’s shipyards cuts platform transport costs by 30%. The acquisition of the 1.125 GW MunmuBaram project by Hexicon after Shell’s exit illustrates sustained foreign appetite for floating projects.[2] Successful scale-up will open more than 300 % in additional technically viable acreage along the East Coast, reinforcing long-term South Korean wind energy market growth.
Corporate PPAs From Korean Tech Giants Unlocking Long-Term Offtake
Direct PPAs introduced in 2021 dismantle the Korea Electric Power Corporation monopoly by allowing large corporations to contract electricity directly from generators. Hyundai Motor has already locked in 610 GWh annually for twenty years, an agreement worth about USD 500 million.[3] Samsung Electronics, LG Chem, and an expanding cluster of data-center operators are lining up similar procurement, each time bypassing renewable-certificate volatility and giving lenders twenty-year cash-flow visibility. Corporate demand is shifting bidding dynamics: developers who align projects with PPA windows secure lower financing spreads, enabling faster construction schedules. These contracts, therefore, inject near-term momentum into the South Korean wind energy market.
Jeju Carbon-Free Island 2030 Accelerating On-Shore Repowering
Jeju has set a binding objective to meet all electricity demand with renewables by 2030, and wind is expected to deliver around 60 % of the target capacity. Limited land availability has turned attention to repowering, replacing 2-MW legacy machines with 6-MW models on existing pads, and re-using interconnection rights. Early deployments show capacity factors rising by 15 percentage points, while integrated storage reduces curtailment risk. Jeju’s success strengthens public acceptance and will likely guide similar repowering programs in Ulleung and Chuja archipelagos. Repowering keeps development costs lower than greenfield builds, reinforcing mid-term tailwinds in the South Korean wind energy market.
Restraints Impact Analysis*
| Restraint | (~) % Impact on CAGR Forecast | Geographic Relevance | Impact Timeline |
|---|---|---|---|
| Permit Bottlenecks From “One-Stop” EIA System Delay FID | -5.7% | National, Jeolla & Gyeongsang | Short term (≤ 2 years) |
| Grid Congestion in Southwest Coast Limiting Curtail-Free Dispatch | -4.2% | Jeolla offshore clusters | Medium term (2-4 years) |
| Fisheries & Military Exclusion Zones Shrinking Developable Sites | -3.8% | West & South Sea waters | Long term (≥ 4 years) |
| High LCoE Due to Typhoon-Grade Design Standards | -6.1% | National | Medium term (2-4 years) |
| Source: Mordor Intelligence | |||
Permit Bottlenecks From “One-Stop” EIA System Delay FID
The Environmental Impact Assessment regime remains sequential despite its “one-stop” branding, obliging developers to clear maritime, military, and cultural reviews in turn rather than concurrently.[4] The Haewoori offshore wind project illustrates the stress: the EIA consultation spanned 28 months, well above the twelve-month OECD benchmark. Government plans to devolve authority to provincial agencies could truncate processing time, yet agency staffing levels must rise to handle a bulging pipeline. Until execution gaps close, slow approvals will trim the near-term growth rate built into the South Korean wind energy market.
Grid Congestion in Southwest Coast Limiting Curtail-Free Dispatch
Southwestern corridors were designed for point-source coal rather than distributed renewables, and the resulting bottlenecks have forced wind farms to curtail during peak output. Korea Electric Power Corporation’s USD 15 billion reinforcement plan includes a multi-terminal direct-current (MTDC) offshore backbone that will ferry power directly to Seoul load centers. Construction delays linked to fishing cooperatives and coastal permitting challenge this solution, so AI-enabled dispatch optimization is a stopgap. Until physical upgrades arrive, network saturation will subtract several points from the CAGR of the South Korean wind energy market.
*Our forecasts treat driver/restraint impacts as directional, not additive. The impact forecasts reflect baseline growth, mix effects, and variable interactions.
Segment Analysis
By Location: Offshore Surge Eclipses Onshore Maturity
Offshore installations, which accounted for just 6.55% of capacity in 2025, are expected to eclipse onshore assets by 2031 as developers race to meet the 12 GW target, propelling the South Korean wind energy market toward coastal industrialization. Onshore repowering adds efficiency but only modest net capacity, whereas floating foundations unlock East Sea sites that were previously inaccessible due to depths of 100 meters.
Offshore success reconfigures supply chains: Korean shipyards fabricate semi-submersibles, LS Cable provides localized subsea arrays, and domestic content rules channel spending into Korean steel, electronics, and port infrastructure. High capacity factors of 35–40% offset capex premiums and justify grid reinforcement to Seoul-Incheon load centers, confirming offshore wind as the dominant growth engine of the South Korean wind energy market.

By Turbine Capacity: Gigawatt-Scale Machines Redefine Project Economics
The 3–6 MW class delivered 66.90% of installations in 2025; however, above-6 MW turbines will command future build-outs as fewer, larger machines reduce balance-of-system costs by 20–30%. Units above 6 MW achieve capacity factors exceeding 40% in offshore zones, enhancing grid stability and facilitating KEPCO’s integration agenda.
Demand outstrips domestic nacelle capacity of 1–1.5 GW per year, creating a near-term import gap from Europe. Doosan and Hyosung’s planned expansions for 2025-2026 aim to close this deficit, reinforcing the South Korean wind energy industry’s ambition to export typhoon-class turbines to Japan and Taiwan.
By Application: Utility-Scale Dominance Reflects Grid-Centric Policy
Utility-scale arrays held 84.65% of installations in 2025 and will grow at 38.10% CAGR through 2031 as KEPCO favors ≥ 500 MW projects that connect directly to 345 kV and 765 kV networks. REC auctions, long-term PPAs, and concessional finance endorse large arrays that spread fixed costs over gigawatt volumes.
Commercial-and-industrial (C&I) buyers, led by semiconductor and battery makers, account for roughly 10% of capacity, using direct PPAs to hedge carbon risk. Community projects remain below 5% due to higher financing costs and limited offtake assurances, although Jeju’s benefit-sharing model may spur incremental growth if replicated on the mainland.
Geography Analysis
Concentration along the Southwest Coast makes the region the largest contributor to installed capacity and pipeline volume, thanks to stable 8 m/s average wind speeds and shallow seabed conditions. The Jeollanam-do government’s 8.2 GW flagship complex alone represents more than 10% of the global offshore project pipeline. Complementary investments in port dredging, haul-road widening, and turbine-blade staging areas keep logistics costs competitive, anchoring the Southwest as the centerpiece of the South Korean wind energy market. A corresponding USD 1.1 billion fisheries compensation fund has eased early-stage pushback, illustrating how targeted community benefits can smooth social license risks.
Ulsan, on the southeast peninsula, is pivoting from hydrocarbons to floating wind, leveraging giant dry docks and fabrication yards that once built drilling rigs. The 1.125 GW MunmuBaram project will field 15 MW turbines tethered 70 km offshore, validating deep-water layouts. Ulsan City’s memorandum with local universities to train 3,000 technicians by 2027 addresses skilled-labor gaps, positioning the port as a floating-wind export hub for the wider Asia-Pacific region. This specialization differentiates the locale and injects diversity into the South Korean wind energy market footprint.
Jeju Island offers a living laboratory for smart-grid integration, energy storage pairing, and turbine repowering under its Carbon-Free Island 2030 initiative. Wind already meets a third of peak load, and the island will require 2 GW of added renewables, 60% of which is expected to come from wind, to reach full self-sufficiency. Grid-connected battery banks ease curtailment, while predictive weather data from the Korea Meteorological Administration optimizes dispatch. Jeju’s demonstrable success feeds learning loops that the mainland grid operator now embeds in expansion blueprints, strengthening operational resilience across the national South Korean wind energy market.
Regulatory Landscape
South Korea is shifting offshore wind development toward a government-led, planned-siting regime under the Special Act on the Promotion of Offshore Wind Power Deployment and the Development of Related Industries, which took effect on March 26, 2026. Under the Ministry of Climate, Energy and Environment (MCEE), projects move through designated Power Generation Zones with integrated permitting, a policy change intended to shorten pre-development timelines versus the prior open-door approach that required sequential reviews.
The support framework is also transitioning from the Renewable Portfolio Standard (RPS) toward fixed-price competitive bidding built around Contracts for Difference (CfD). This alignment stabilizes revenue around auction outcomes rather than REC volatility. In June 2026, MCEE outlined its Offshore Wind Medium- and Long-Term Tender Implementation Plan, including a 55 GW offshore wind tender program for 2026-2035 with annual volumes of roughly 4-7 GW, tightening the link between permitting, grid planning, and auctioned capacity.
Competitive Landscape
The market is moderately concentrated, with the top five developers controlling 55–60% of offshore capacity in development, while onshore assets are distributed among 15–20 independent companies. Offshore consortia combine European capital and technology with Korean regulatory experience and supply chains; examples include Ørsted–SK E&S and Equinor–Korea East-West Power.
SK E&S’s vertically integrated model secures offtake, subsea cables, and turbine supply within the chaebol, easing financing and accelerating construction. Hanwha’s diversified approach pairs wind with solar and green hydrogen to meet corporate buyer demand under bundled PPAs.
Doosan Enerbility’s 8 MW typhoon-class turbine wins orders by offering 15–20% lower delivered costs than imported models, helped by export credit insurance and Busan tower capacity expansions. Smaller firms, such as Elenergy, pilot wind-storage hybrids, carving out niches around curtailment mitigation in congested grids.
Overall, strategic moves center on supply-chain localization, scaling up floating wind, and corporate PPAs that shift revenue away from wholesale markets, shaping the competitive landscape of the South Korean wind energy market.
South Korea Wind Energy Industry Leaders
-
Ørsted A/S
-
Vestas Wind Systems A/S
-
Doosan Enerbility Co., Ltd.
-
Equinor ASA
-
Siemens Gamesa Renewable Energy S.A.
- *Disclaimer: Major Players sorted in no particular order
Market Opportunities and Future Outlook
Planned offshore wind siting under the 2026 Special Act creates clearer whitespace for developers and suppliers that can operate inside designated Power Generation Zones and meet consolidated permitting requirements. It is reinforced by the government tender pathway for 55 GW of offshore wind during 2026-2035, which sets a visible cadence for project awards and supports investment cases for domestic ports, installation logistics, subsea cabling, and typhoon-grade equipment against auction schedules.
Financing and execution signals in 2026 also point to deal structures and participation models. In April 2026, financial close was announced for the 390 MW Shinan Ui offshore wind project with domestic capital, highlighting a bankability path that can be reused across later auction rounds. Separately, Korea East-West Power secured a power generation permit in April 2026 for the 110 MW Jeju Handong-Pyeongdae offshore wind farm, positioned as a public-led project. Alongside these project-level milestones, the corporate PPA channel introduced in 2021 remains a practical offtake lever for utility-scale assets supplying industrial and technology buyers, and it complements CfD auctions by widening contracting options for developers that can align COD windows with long-dated demand.
Recent Industry Developments
- July 2026: Korea Western Power advanced a 500 MW offshore wind project in Taean. The progress added momentum to utility-scale offshore development activity and supported the broader shift toward larger projects that can justify dedicated grid and port investments.
- December 2025: Vestas secured a 390 MW order for the Shinan-Ui offshore wind project, supplying V236-15.0 MW turbines. The award strengthened the pipeline for above-6 MW turbine deployments in South Korea and pushed localization and marine logistics requirements further up the supply chain.
- December 2024: South Korea awarded 1.9 GW in its third offshore wind auction at prices near KRW 177,000/MWh. The result reinforced competitive bidding as the primary route to market for new offshore capacity and sharpened the focus on cost reduction, permitting readiness, and grid access for developers.
Research Methodology Framework and Report Scope
Market Definition and Coverage
This market covers wind power development activity in South Korea, measured as installed wind capacity added and in operation, tracked across onshore and offshore projects and their typical turbine size ranges.
Scope exclusions: We exclude non-wind renewables, electricity retailing, and standalone grid assets that are not directly built as part of wind project execution.
Segmentation Overview
- By Location
- Onshore
- Offshore
- By Turbine Capacity
- Up to 3 MW
- 3 to 6 MW
- Above 6 MW
- By Application
- Utility-scale
- Commercial and Industrial
- Community Projects
- By Component (Qualitative Analysis)
- Nacelle/Turbine
- Blade
- Tower
- Generator and Gearbox
- Balance-of-System
Data Sources, Market Sizing, and Validation
Desk Research
Desk research was first used to build a clean view of South Korea wind capacity history, the active pipeline, and the policy and permitting environment that affects project timing. For this, we relied on public sources such as Korea Energy Agency disclosures, the Ministry of Trade, Industry and Energy publications, KOSIS statistics, grid and market updates from the power sector operator, and IEA and IRENA datasets for cross-checking capacity totals.
Next, we reviewed developer announcements, environmental approvals, port and installation constraints, and turbine shipment and commissioning news through reputed press releases, association websites, and company presentations. When needed, we used paid subscriptions for company financials and intelligence, news and financials, patent databases, and an import and export shipment-level database to confirm directionally whether project activity and equipment flows match the modeled build. These examples are not exhaustive, and many other public sources were referenced as well to collect, validate, and clarify the final analysis.
Primary Interviews and Surveys
Primary work was used to stress-test the build timeline and the split between onshore and offshore, especially where public project lists do not fully reflect delays, redesigns, or grid constraints in South Korea. We spoke with a mix of developers, EPC and supply chain participants, financing and advisory roles, and technical experts. The inputs were then used to tune assumptions on commissioning rates, turbine upsizing, and offshore execution readiness across key coastal development zones.
Distribution of primary research fieldwork respondents
| Company type | Respondent position |
|---|---|
| Top tier: 28% | CXOs: 16% |
| Mid tier: 52% | Functional/Unit leaders: 29% |
| Smaller Players: 20% | Managers: 55% |
Market-Sizing & Forecasting
Sizing was built using a top-down capacity reconstruction approach, where national capacity totals and commissioning pathways are translated into annual installed GW. This is done by mapping project awards, permitting progress, grid connection readiness, and typical construction durations. The model is then corroborated with selective bottom-up approximations, such as sampled project-by-project roll-ups and checks on implied turbine counts from average MW ratings. This helps us adjust totals when the timing looks overstated.
In this South Korea wind market, we treated a few variables as main fingerprints, including offshore versus onshore commissioning pace, average turbine size progression (up to 3 MW, 3-6 MW, and above 6 MW), utility-scale project share, expected repowering activity on aging sites, and announced offshore targets that influence permitting and port planning. Where gaps exist in public project disclosures, we filled assumptions using interview-based probability weights for delay and cancellation, then stress-tested outcomes against observable grid and maritime constraints.
For forecasting, scenario analysis was used because the build-out is sensitive to approval timing and offshore execution readiness rather than only to smooth historical trends. The scenarios were anchored to policy direction, auction and pipeline signals, and expert expectations gathered during primary discussions. We then selected the final path based on the most repeatable set of assumptions we could defend on a client call.
Data Validation & Update Cycle
Validation was done through triangulation across capacity totals, pipeline movement signals, and execution constraints that can be independently observed in South Korea. Outliers were flagged when implied annual additions looked inconsistent with grid connection lead times, port and installation capacity, or the typical ramp pattern seen in comparable offshore build cycles, and those items were reviewed again before sign-off.
Our process also includes multi-step internal checks so the definitions, math, and assumptions stay consistent across the time series. The report is refreshed annually, and interim updates are made when material events occur, such as a major policy shift, a large project reaching financial close, or a visible change in offshore permitting. Before delivery, a final analyst pass is completed so clients receive the latest updated view.
Mordor Intelligence's South Korea Wind Energy Market Estimate Compared With Other Published Estimates
Published market sizes for South Korea wind energy can vary a lot, and the main reason is that firms do not measure the same thing. Some track installed capacity in gigawatts, others publish revenue in USD, and a few blend equipment, project services, and even storage into one total.
Commissioning pace by location (onshore versus offshore) and the turbine size mix are also handled differently, which changes the implied annual additions and the forecast curve. Grid connection readiness, permitting lead times, and currency conversion timing can further widen the spread when they are not checked against observable project and infrastructure signals. As a result, the same market can look smaller or larger depending on the modeling choices used.
Benchmark comparison
| Source | Market Size | Gaps in Research Methodology |
|---|---|---|
| Mordor Intelligence | USD 3.27 B (2026) | |
| Global Consultancy A | USD 4.28 B (2024) | Uses revenue sizing and appears to include adjacent value pools beyond installed capacity, which can pull in EPC and broader project spend that does not map cleanly to annual GW additions. |
| Industry Publisher B | USD 1.90 B (2025) | Revenue-based view with a different forecast window and price assumptions, which can understate the impact of offshore commissioning timing and turbine upsizing when the pipeline is still uneven. |
Capacity totals, observed offshore pipeline movement, and turbine rating shifts are the checks that keep Mordor Intelligence tied to an installed GW build path, rather than a spend-based tally. Once the unit of measure and the counted value pool are aligned, the remaining differences usually come down to timing assumptions on offshore delivery and how aggressively delays are modeled.
Key Questions Answered in the Report
How large is the South Korea wind energy market in 2026?
Installed capacity is projected at 3.27 GW in 2026.
What is the forecast CAGR for South Korean wind capacity to 2031?
Capacity is expected to expand at a 35.10% CAGR, reaching 14.73 GW by 2031.
Why are offshore projects growing faster than onshore in Korea?
Offshore arrays benefit from the 12 GW Green New Deal mandate, higher capacity factors, and floating-wind advances that unlock deep-water sites.
Which turbine segment will dominate future Korean installations?
Above-6 MW turbines are set to grow at 40.20% CAGR, driven by 8-15 MW platforms that lower per-MW installation costs.
How are corporate PPAs shaping Korean wind development?
Tech giants like Samsung and SK Hynix sign 15-20-year PPAs that secure revenue streams, enabling non-recourse financing for large offshore farms.
What grid upgrades are planned to handle new offshore capacity?
KEPCO will build 765 kV lines linking Jeolla wind zones to Seoul-Incheon by 2028, funded under a KRW 4.2 trillion plan.